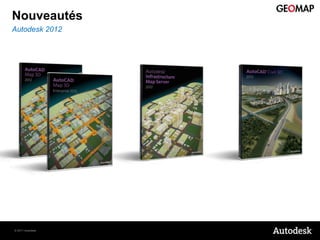
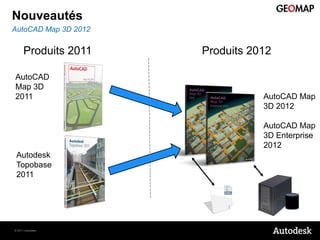
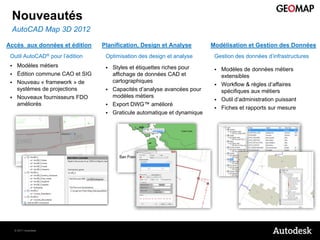
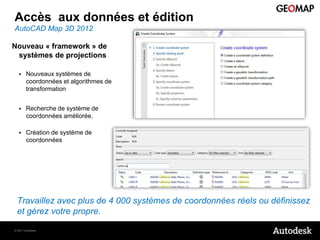
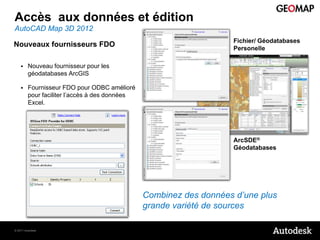
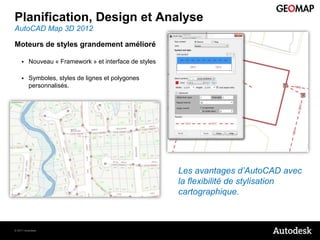
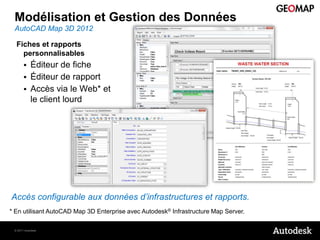
Autodesk Présente Ses Logiciels de Construction 2011InstiCOM
Autodesk, Inc, leader des logiciels de conception 2D et 3D, d'ingénierie et de divertissement, annonce de nouvelles versions de ses logiciels destinés aux secteurs du bâtiment, des infrastructures et de la construction.
Cette mise à jour vise à accélérer l'adoption des processus de modélisation des données du bâtiment (Building Information Modeling, BIM) et à faciliter la collaboration multidisciplinaire ainsi que la réalisation des nouvelles constructions et des projets de rénovation.
Découvrez comment optimiser vos intentions de design dans une approche bioclimatique en temps réel avec ArchiWIZARD Biolcim, dès les premières étapes de votre 3D (Revit, SketchUp, etc.).
Thèmes abordés: Lumière naturelle et artificielle, ombrages et masques, besoins énergétiques prévisionnels, interaction bâtiment/environnement, irradiation solaire, bibliothèque de matériaux, rapports et analyses.
Presentation faite le 27 mars 2015 pour une journée de le cadre de REUNION REGIONALE I. H. F.
Région : Rhône Alpes
Vendredi 27 Mars 2015
Au C.H.U. de GRENOBLE
Organisée par Didier BOUVARD Délégué régional
SQL Server 2012 et ArcGIS d'Esri: Intégrez la dimension géographique dans vos...Microsoft Technet France
SQl Server 2012 apporte de nombreuses améliorations dans la gestion des données géospatiales. Venez découvrir comment cette nouvelle version vous permettra d’enrichir de façon spectaculaire l’expérience visuelle et l’impact de vos rapports.
Restitution des données environnement Microsoft & data visualization : panel ...Microsoft
Reporting, analyse ad-hoc, dashboarding, data crunching… : les besoins en termes de restitution des données sont nombreux, et les outils tout autant ! Vous découvrirez au cours de cette session les différentes solutions de l’offre BI Microsoft à disposition des différentes typologies d’utilisateurs, depuis Excel à SQL Server Reporting Services 2012 & PowerView. Nous vous présenterons également une solution tierce de l’écosystème partenaire Microsoft combinant au sein d’un même outil puissance d’analyse ad-hoc et reporting web : XLCubed.
Améliorations et innovations de 3D_Evolution 4.6, le logiciel d'interopérabilité CAO 3D (migration, simplification, conversion, analyses avancées...)
En savoir plus sur 3D_Evolution https://www.coretechnologie.com/fr/produits/3d-evolution.html
Duet Entreprise 2.0 pour SharePoint et SAP combine les technologies que tout le monde utilise chaque jour – Microsoft Office et Microsoft SharePoint – avec les technologies pour l’entreprise - SAP enterprise resource planning (ERP) et des applications line-of-business (LOB), connectée à des systèmes métier. Duet Entreprise propose aux employés d’accéder via des outils Microsoft à des workflows SAP et des données comme les contacts, les calendriers et d’autres types de données. Nous présenterons durant cette session une vue d’ensemble de ce produit et les gains pour les utilisateurs.
Générez automatiquement vos diagrammes d'architecture | Webinaire Obeo SmartEAObeo
Comment assurer une certaine cohérence des données dans un référentiel d'architecture, et produire à grande échelle des représentations graphiques pertinentes ?
Obeo SmartEA 6.3 apporte deux nouvelles fonctionnalités permettant de répondre à ce besoin :
- des stéréotypes pour cadrer les propriétés dynamiques ArchiMate,
- des templates pour générer des diagrammes spécifiques.
Découvrez ces nouveautés et leur mise en œuvre sur un cas concret : la création d'un catalogue de services applicatifs.
3D_Evolution - Logiciel de conversions de données CAO 3DCORETECHNOLOGIE
Solution logicielle de conversions de données CAO indépendante pour 24 formats majeurs sans autre utilisation de licence de logiciel CAO. La rapidité, la précision et les capacités de correction de données de 3D_Evolution garantissent une qualité certifiée VDA et SASIG des modèles et optimisent votre interopérabilité multi-CAO et optimisent le travail collaboratif de vos équipes.
Depuis 1994, le Service de l'aménagement du territoire de la Ville de Québec a développé et maintenu une maquette 3D dans le cadre de projets d’urbanisme. En 2010, la Section Géomatique des TIT a eu pour mission de diffuser la maquette 3D existante et des futurs projets, en plus de concevoir les assises d'un véritable SIG 3D. L’objectif de la présentation est de donner un aperçu de la façon dont la maquette 3D de la Ville de Québec est conçue, déployée et utilisée, aussi de voir les avantages et les contraintes opérationnelles d’un tel projet.
Similaire à Nouveauté Autodesk 2012 AutoCAD Map 3D 2012 (20)
Présentation du webinaire GoMap, la technologie permettant de faciliter la gestion et la mise en ligne de sites cartographiques web basées sur MapGuide Open Source ou Enterprise.
L'IA connaît une croissance rapide et son intégration dans le domaine éducatif soulève de nombreuses questions. Aujourd'hui, nous explorerons comment les étudiants utilisent l'IA, les perceptions des enseignants à ce sujet, et les mesures possibles pour encadrer ces usages.
Constat Actuel
L'IA est de plus en plus présente dans notre quotidien, y compris dans l'éducation. Certaines universités, comme Science Po en janvier 2023, ont interdit l'utilisation de l'IA, tandis que d'autres, comme l'Université de Prague, la considèrent comme du plagiat. Cette diversité de positions souligne la nécessité urgente d'une réponse institutionnelle pour encadrer ces usages et prévenir les risques de triche et de plagiat.
Enquête Nationale
Pour mieux comprendre ces dynamiques, une enquête nationale intitulée "L'IA dans l'enseignement" a été réalisée. Les auteurs de cette enquête sont Le Sphynx (sondage) et Compilatio (fraude académique). Elle a été diffusée dans les universités de Lyon et d'Aix-Marseille entre le 21 juin et le 15 août 2023, touchant 1242 enseignants et 4443 étudiants. Les questionnaires, conçus pour étudier les usages de l'IA et les représentations de ces usages, abordaient des thèmes comme les craintes, les opportunités et l'acceptabilité.
Résultats de l'Enquête
Les résultats montrent que 55 % des étudiants utilisent l'IA de manière occasionnelle ou fréquente, contre 34 % des enseignants. Cependant, 88 % des enseignants pensent que leurs étudiants utilisent l'IA, ce qui pourrait indiquer une surestimation des usages. Les usages identifiés incluent la recherche d'informations et la rédaction de textes, bien que ces réponses ne puissent pas être cumulées dans les choix proposés.
Analyse Critique
Une analyse plus approfondie révèle que les enseignants peinent à percevoir les bénéfices de l'IA pour l'apprentissage, contrairement aux étudiants. La question de savoir si l'IA améliore les notes sans développer les compétences reste débattue. Est-ce un dopage académique ou une opportunité pour un apprentissage plus efficace ?
Acceptabilité et Éthique
L'enquête révèle que beaucoup d'étudiants jugent acceptable d'utiliser l'IA pour rédiger leurs devoirs, et même un quart des enseignants partagent cet avis. Cela pose des questions éthiques cruciales : copier-coller est-il tricher ? Utiliser l'IA sous supervision ou pour des traductions est-il acceptable ? La réponse n'est pas simple et nécessite un débat ouvert.
Propositions et Solutions
Pour encadrer ces usages, plusieurs solutions sont proposées. Plutôt que d'interdire l'IA, il est suggéré de fixer des règles pour une utilisation responsable. Des innovations pédagogiques peuvent également être explorées, comme la création de situations de concurrence professionnelle ou l'utilisation de détecteurs d'IA.
Conclusion
En conclusion, bien que l'étude présente des limites, elle souligne un besoin urgent de régulation. Une charte institutionnelle pourrait fournir un cadre pour une utilisation éthique.
OCTO TALKS : 4 Tech Trends du Software Engineering.pdfOCTO Technology
En cette année 2024 qui s’annonce sous le signe de la complexité, avec :
- L’explosion de la Gen AI
-Un contexte socio-économique sous tensions
- De forts enjeux sur le Sustainable et la régulation IT
- Une archipélisation des lieux de travail post-Covid
Découvrez les Tech trends incontournables pour délivrer vos produits stratégiques.
Le Comptoir OCTO - Qu’apporte l’analyse de cycle de vie lors d’un audit d’éco...OCTO Technology
Par Nicolas Bordier (Consultant numérique responsable @OCTO Technology) et Alaric Rougnon-Glasson (Sustainable Tech Consultant @OCTO Technology)
Sur un exemple très concret d’audit d’éco-conception de l’outil de bilan carbone C’Bilan développé par ICDC (Caisse des dépôts et consignations) nous allons expliquer en quoi l’ACV (analyse de cycle de vie) a été déterminante pour identifier les pistes d’actions pour réduire jusqu'à 82% de l’empreinte environnementale du service.
Vidéo Youtube : https://www.youtube.com/watch?v=7R8oL2P_DkU
Compte-rendu :
Ouvrez la porte ou prenez un mur (Agile Tour Genève 2024)Laurent Speyser
(Conférence dessinée)
Vous êtes certainement à l’origine, ou impliqué, dans un changement au sein de votre organisation. Et peut être que cela ne se passe pas aussi bien qu’attendu…
Depuis plusieurs années, je fais régulièrement le constat de l’échec de l’adoption de l’Agilité, et plus globalement de grands changements, dans les organisations. Je vais tenter de vous expliquer pourquoi ils suscitent peu d'adhésion, peu d’engagement, et ils ne tiennent pas dans le temps.
Heureusement, il existe un autre chemin. Pour l'emprunter il s'agira de cultiver l'invitation, l'intelligence collective , la mécanique des jeux, les rites de passages, .... afin que l'agilité prenne racine.
Vous repartirez de cette conférence en ayant pris du recul sur le changement tel qu‘il est généralement opéré aujourd’hui, et en ayant découvert (ou redécouvert) le seul guide valable à suivre, à mon sens, pour un changement authentique, durable, et respectueux des individus! Et en bonus, 2 ou 3 trucs pratiques!
Le Comptoir OCTO - Équipes infra et prod, ne ratez pas l'embarquement pour l'...OCTO Technology
par Claude Camus (Coach agile d'organisation @OCTO Technology) et Gilles Masy (Organizational Coach @OCTO Technology)
Les équipes infrastructure, sécurité, production, ou cloud, doivent consacrer du temps à la modernisation de leurs outils (automatisation, cloud, etc) et de leurs pratiques (DevOps, SRE, etc). Dans le même temps, elles doivent répondre à une avalanche croissante de demandes, tout en maintenant un niveau de qualité de service optimal.
Habitué des environnements développeurs, les transformations agiles négligent les particularités des équipes OPS. Lors de ce comptoir, nous vous partagerons notre proposition de valeur de l'agilité@OPS, qui embarquera vos équipes OPS en Classe Business (Agility), et leur fera dire : "nous ne reviendrons pas en arrière".
Welcome to the “What’s New in AutoCAD Map 3D 2012” presentation. Before we begin looking at the many new features available in this release, let me give you a quick overview of what we will be looking at in this presentation.The enhancements in AutoCADMap 3D 2012 can be broadly grouped into three categories1. Improved capabilities to access and edit data from more sources enabling you to use your AutoCAD capabilities to edit data. These include:(read the bullets)2. New tools for planning, analysis and sharing of information enabling you to better plan for projects. These include:(read the bullets)3. Powerful tools for the modeling and management of infrastructure information which includes:(read the bullets)
Combine infrastructure intelligence with the portability of DWG and DWT template files to more easily create, manage and exchange engineering and spatial information.Autodesk®Topobase™ software provided customers with an enterprise database option to help manage infrastructure data, but Oracle®was a requirement. In a lot of cases our customers rely on and use DWG files for managing their as-built infrastructure and the new industry models for AutoCAD Map 3D help to providesexactly that. The power and flexibility of a relational database to model infrastructure assets (attributes and geometry) in a single self contained dwg file. Relational database capabilities within a DWG or DWT file – CAD managers can create DWG files or DWT templates to host data models and related business rules, forms and reports for use by the CAD users.Standardized data models which can be extended or customized with the administration tool – the product includes data models for vertical industries (more to come in the data modeling & management section of this presentation)Built in business rules, forms and reporting engineDynamic symbolization through display models – which enables users to generate graphics in an area of interest using preconfigured display styles for example, use a certain set of symbols and styles for map book production, and another set for analysis.The standalone model is for a single user environment and helps- Improve drafting productivity of facilities for new and experienced staff by using a set of predefined steps via the built in workflows- Define and help apply data standardization and intelligence into the drafting process- More easily prepare engineering/CAD data for GIS or mapping systems - Enable design data to be more effectively understood and used throughout the organization
Improve efficiency and productivity by using your AutoCAD skills to edit and manage a variety of data sources.Uses the same commands with CAD, FDO and industry model data. In the past, there were separate processes that were required to edit and update geometric information. This means that you can better utilize your CAD skills and CAD trained staff.
Transform data on the fly from a variety of different coordinate systems allowing users to see information in the same location context helping to save time and effort spent on manual conversionsThe world does not start at 0,0….Maps have coordinates that define how things are related to each other spatiallyCoordinates are often X,Y positions that sometimes include a ZCoordinate systems allow us to see our designs on a map (or in Google Earth™ mapping service)Coordinate systems are made up of references to datum, ellipsoids and other mathematical elements that help to approximate Earth New or enhance features in the 2012 release include:New coordinate systems and transformation algorithmsBetter searching for coordinate systemsA wizard to create your own custom local coordinate systems
Enhance your planning workflows by aggregating data from more sources to produce a more comprehensive view of the existing conditions.New providersinclude:New FDO Provider for ArcGIS 9.3 (64 bit) and ArcGIS 10.x (32bit) that includes both:- File/Personal Geodatabases- ArcSDEGeodatabaseEnhanced Access to Microsoft Excel Spreadsheets that enablesusers to specify a primary key to a column in the Excel spreadsheet that is then available in the properties and data tables, as well as for stylization.With AutoCAD Map 3D 2012, you now have access to even more data formats and types helping you to save time and work more efficiently with your planning and analysis workflows.
Use the strength of AutoCAD with the flexibility of the stylization engine to represent engineering, CAD and mapping data in a single environmentAutoCAD Map 3D ships with two options for stylization, the traditional framework as well as the new enhanced version. The user is given the option of upgrading previous versions automatically to the new stylization option. CAD Managers and users can also control which framework is used via a deployable sysvar (MAPSTYLE) controls. The new framework exposes more capabilities such as the ability to stack symbols onto line styles and custom polygon fill styles. The styles are sharable with the Autodesk® Infrastructure Map Server software (formerly Autodesk MapGuide® Enterprise) by a single click publish function.
Powerful labeling and annotation using AutoCAD tools helps increase flexibility and productivity when preparing data for plotting and publishing.AutoCAD Map 3D has three ways of representing text:AutoCAD TEXT and MTEXTFDO Text Annotation Layer (standalone text in an SDF file)Dynamic Feature labels (setup in the display manager)Convert dynamic labels to MTEXT or FDO text annotationsConvert MTEXT to FDO text layerInteractive repositioning of dynamic labelsGenerate leader lines for repositioned textThe enhanced labeling capability in the 2012 release, allows users to interchange between the three options. Also included is the option to manually reposition a dynamic feature label as well as the option of assigning a leader line. Editing the labels invokes the AutoCAD MTEXT editor as well as allowing for complex labeling where required.
Make more informed planning decisions with powerful network analysis tools for what if scenarios, impact analysis and project prioritizationThe Autodesk Storm and Sanitary Analysis 2012 Software is more closely integrated with AutoCAD Map 3D 2012 to automatically detect the wastewater industry model and enable analysis on storm and sanitary networks. The software is available an optional install when installing AutoCAD Map 3D 2012The industry models also have a built in connectivity model that establishes what is connected to and in which direction. This enables topologic analysis such as shortest distance, minimum spanning tree, find connected and other types of network traces.
Help improve efficiency by sharing robust mapping content with AutoCAD® and AutoCAD LT®software users in your design, planning and data management workflows.The enhanced DWG output option enables users to export maps built using a variety of data sources into an AutoCAD DWG for use in AutoCAD and AutoCAD LT.The visual option is focused on visual fidelity and generates more AutoCAD entities in an intent to retain the visual stylization as much as possibleThe editable option is focused on AutoCAD editing and generates fewer AutoCAD entities attempting to convert the graphics as follows:Feature Class -> Layer (Color, Linetype, Lineweight)LineStyle -> LinetypePoint Symbol -> BlockFill Pattern -> HatchStyles can be defined/overridden using a DWT Template if you wish to use a different AutoCAD line style instead of the rendered option. There is an also an optional feature attribute to XData output for use in AutoCAD-based custom applications and routines.
Better tools for exhibit and map production combines the best of AutoCAD plotting with CAD, GIS and Industry Model dataNew Reference Systems include the following in addition to the Military Grid Reference System (MGRS) from the previous release:US National GridLat/LonUser selected coordinate systemThe generated labels on the layout are created as AutoCAD Mtext which are editable and stackable (or unstackable) within an AutoCAD layout.The reference system includes the option of controlling the scale and precision (intervals between grid lines) of the generated grid.The grid templates used for creating the grid reference system are customizable xml templates that can be loaded using the MapLoadGridStylecommand.AutoCAD hasvery powerful and flexible plotting capabilities, the improved grids and graticules feature enables you to use that very same flexible tool directly with CAD, GIS and the industry model information.
Create and manage infrastructure information with help from standardized intelligent vertical data models:There are two options for the industry data models- Standalone which is DWG based- Enterprise which uses OracleCapabilities formerly available with Autodesk TopobaseClient, the extensible industry data models are now a part of AutoCAD Map 3D 2012. AutoCAD Map 3D 2012 includes the standalone option for the industry data models and uses a DWG file format and therefore does not require an Oracle database. The enterprise version of the industry data models uses Oracle database software and is available as a part of AutoCAD Map 3D Enterprise 2012. AutoCAD Map 3D Enterprise 2012 includes all of AutoCAD Map 3D 2012 plus the ability to use Oracle database software as the data storage format for the industry data models.Industry vertical data modelsWaterWastewater (storm & sanitary sewer)ElectricSurveyGas (enterprise version only)Land (Swiss & German standards, enterprise version only)The product includes built in vertical data models for water, wastewater, and electric for North America and Central Europe. The Enterprise version also includes a Gas model. In addition, the enterprise option includes land models specifically for Swiss and German land customers. The survey module enables users to import and process survey information and convert them into features. In addition, it is also possible to create your very own data models from scratch or use a 3rd party data model built for Topobase or AutoCAD Map 3D.The extensible industry data models include powerful functions for:Attribute forms, workflows and business rulesConnectivity, network topology and trace templatesSearching and locating assetsDisplaying models for dynamic symbolizationAlso included are function extensions for Coordinate Geometry functions for data creation, dimensioning and reusable smart templates (for e.g. a switch cabinet with multiple switches and wiring modeled as a switch cabinet template)Specifically for the enterprise version, the following additional capabilities are also included:Functional ExtensionsData driven plottingAn Oracle data import tool for converting existing Oracle data to the industry model schema structureProfiles for wastewater sectionsJobs & Versioning
Workflows and businessruleshelp streamline the data capture process improving the quality of data and provides a step by step process to work information to all levels of users to save time and to standardize their data capture and analysis processes.Workflows are step by step processes thattake a user through the process of completing a task. Business rules are automated functions that help update or check the data that is digitized or entered for completeness and correctness.Includes workflows and business rules that are specific to the industry verticals. Examples include:ElectricElectric Explorer to help manage overhead & underground networksAutomatic phase and voltage propagationReconfigure circuit & phaseFind feedersWaterAutomatic fitting insertion on connecting pipesHouse connection creation workflowFind ConnectedWastewaterSub drain area creationData import classificationFind Connected
Enables CAD Managers and system administrators tomore quickly configure data models, and application options to suit specific business requirements better.In the case of the standalone option,the administration tool can be used to create a DWT template or modify settings in an industry vertical DWGIn the case of the enterprise option (formerly available as Autodesk TopobaseClient) that runs on Oracle, it enables the administrator to manage the database system without the need to extensive Oracle DBA expertise.Tools include the ability to Configure, build or extend Industry Models – using the visual data model editor 1-Click Data Maintenance tool –helps administrators or CAD managers to optimize the data models for performance and scalabilitySetup Feature Search Options – allowing users tomore quickly locate an area or asset of interestConfigure Workflows – help streamline the drafting and analysis process using step by step commands making it easier for any level of user to work with the dataConfigure User Interface options – Feature Explorer Manager – control the feature explorer to only show those features that are relevant to the user’s tasks or roleAttribute Forms – define the layout, form controls and detail most relevant to your users tasks or role.Additional AutoCAD Map 3D Enterprise 2012 options User Access Privileges (for enterprise) – create users, users group and access privileges to the commands as well as dataAccess to commands and functions – control of which commands are available for your usersRead/write privileges – control who has read and who has write access to your dataJobs & versioning – store data in versions with the option of merging and helping to resolve conflicts between versions when promoting to the live version. This option also helps keep track of the state of your infrastructure at various points of time
Customizable forms and reporting helps CAD Managers and system administrators to configure user access to information and reports based on their users workflows and reporting needs.Form Designer ToolVisual Drag & Drop editorAssign lookup valuesAssign user form by user profileThe form designer tool allows administrators to design or customize the forms that users have access to, providing options for example, lookup values for fields, automatic check of data entry. In the case of the enterprise option (on Oracle), the administrator can define specific forms based on user profiles exposing as much information as is relevant to the users role. For example in operations the forms might show detail related to operating conditions such as status, while for planners the forms might show the age of an asset.The forms interface also allows administrators in the enterprise version to show information from external systems, such as work management, operational or ERP systems directly to the user via a single dialog box. This is powerful functionality that can provide the user full access to the information needed for better analysis in the operation systems.One very powerful feature for forms and reports is that they can be created once and available on both the desktop client as well as on the web when using AutoCAD Map 3D Enterprise software along with Autodesk Infrastructure Map Server (formerly known as Autodesk MapGuide Enterprise). This means that the same business rules to evaluate information, user interface features such as forms and reports are available on the desktop using AutoCAD Map 3D as well as using just a browser enabling remote users to see and use the information more effectively. It also enables administrators to manage both the desktop and web users via the same system. This does require a common database as the ‘single source of truth’ for infrastructure information which is provided by Oracle database software.