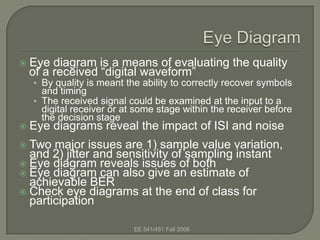
1. Eye diagram is a means of evaluating the quality
of a received “digital waveform”
• By quality is meant the ability to correctly recover symbols
and timing
• The received signal could be examined at the input to a
digital receiver or at some stage within the receiver before
the decision stage
Eye diagrams reveal the impact of ISI and noise
Two major issues are 1) sample value variation,
and 2) jitter and sensitivity of sampling instant
Eye diagram reveals issues of both
Eye diagram can also give an estimate of
achievable BER
Check eye diagrams at the end of class for
participation
EE 541/451 Fall 2006
2. The eye diagram is created by taking the
time domain signal and overlapping the
traces for a certain number of symbols.
The open part of the signal represents the
time that we can safely sample the signal
with fidelity
Figure 7.22
EE 541/451 Fall 2006
3. Eye diagram is a retrace display
of data waveform
• Data waveform is applied to
input channel
• Scope is triggered by data
clock
• Horizontal span is set to
cover 2-3 symbol intervals
Measurement of eye opening is
performed to estimate BER
• BER is reduced because of
additive interference and
noise
• Sampling also impacted by
jitter
EE 541/451 Fall 2006
4. The vertical eye opening or noise
margin is related to the SNR, and
thus the BER
• A large eye opening
corresponds to a low BER
The horizontal eye opening relates
the jitter and the sensitivity of the
sampling instant to jitter
• The red brace indicates the
range of sample instants with
good eye opening
• At other sample instants, the
eye opening is greatly reduced,
as governed by the indicated
slope
EE 541/451 Fall 2006
7. The larger , the
wider the opening.
The larger , the
larger bandwidth (1+
)/Tb
But smaller will lead
to larger errors if not
sampled at the best
sampling time which
occurs at the center
of the eye.
EE 541/451 Fall 2006