
Recommandé
Contenu connexe
Similaire à LESSON 08 Hypothesis Testing (continued)Lesson ObjectivesS.docx
Similaire à LESSON 08 Hypothesis Testing (continued)Lesson ObjectivesS.docx (20)
Plus de ssuser47f0be
Plus de ssuser47f0be (20)
Dernier
Dernier (20)
LESSON 08 Hypothesis Testing (continued)Lesson ObjectivesS.docx
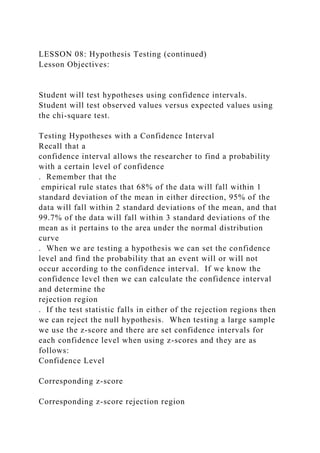
- 1. LESSON 08: Hypothesis Testing (continued) Lesson Objectives: Student will test hypotheses using confidence intervals. Student will test observed values versus expected values using the chi-square test. Testing Hypotheses with a Confidence Interval Recall that a confidence interval allows the researcher to find a probability with a certain level of confidence . Remember that the empirical rule states that 68% of the data will fall within 1 standard deviation of the mean in either direction, 95% of the data will fall within 2 standard deviations of the mean, and that 99.7% of the data will fall within 3 standard deviations of the mean as it pertains to the area under the normal distribution curve . When we are testing a hypothesis we can set the confidence level and find the probability that an event will or will not occur according to the confidence interval. If we know the confidence level then we can calculate the confidence interval and determine the rejection region . If the test statistic falls in either of the rejection regions then we can reject the null hypothesis. When testing a large sample we use the z-score and there are set confidence intervals for each confidence level when using z-scores and they are as follows: Confidence Level Corresponding z-score Corresponding z-score rejection region
- 2. 90% 1.645 z < -1.645 or z > 1.645 95% 1.96 z < -1.96 or z < 1.96 99% 2.575 z < 2.575 or z > 2.575 Recall that the confidence interval formula is the sample mean +/- z(standard deviation/√n) For t-scores, it is a little different since the t-score depends on n - 1 degrees of freedom. The first row of the t-table gives alpha (a) which is 1 - confidence level. The 2nd column has .40 which is equal to the amount of area left in the two tails of the normal distribution if the confidence level is set at 60%. The 3rd column represents 75% and so on. Below is a list of the confidence levels and the corresponding alpha for each one so that you will know which column holds the correct t-score based on the given confidence level. Remember that the table gives you the total area left after you have considered the confidence level and it will need to be divided by two to come up with the area in each tail of the normal distribution. Confidence level Corresponding a-value for t-table 60% .40 75% .25 90% .10 95% .05 97.5% .025 99% .01 99.5% .005 99.95% .0005 Recall that the confidence interval formula is the sample mean
- 3. +/- t(standard deviation/√n) Let's practice: The average yearly income of families in a particular state is $40,000. However a sample of 100 people show that the average income is $45,000 with a population standard deviation of $500. Conduct a hypothesis test at confidence level 95% to see if the true average income of families reported by the state is correct. Step 1 : State the null and alternative hypothesis H 0 = sample mean = population mean H 1 = sample mean ≠ population mean Step 2 : Determine the confidence interval. (we will use a z-score since this is a large sample) Since the confidence level is 95%, the confidence interval is -1.96< z <1.96 Step 3: Determine the z-score z = 45000-40000 /500=10 Step 3: Compare this z-score to the confidence interval and make a conclusion. This is outside of the confidence interval which means that we must reject the null hypothesis and conclude that the average income reported by the state is incorrect. A particular school gives annual standardized tests at the end of the year and last year's average score was 70 with a standard deviation of 5. A sample of 10 students' tests were pulled and
- 4. the average score was 85. Considering a 99% confidence level, did the school report the correct overall average for the students' test scores? State the null and alternative hypotheses . H 0 = sample mean = population mean H 1 = sample mean ≠ population mean Determine the confidence level(we will use a t-score since the sample size is small) 10 -1 = 9 degrees of freedom 99% confidence level = t .005 with 9 degrees of freedom = 3.24 or 3.24/2 = 1.62 So the confidence interval is -1.62 > t > 1.62 and the rejection region is t < -1.62 or t > 1.62 Determine the t-score t = 85 - 70 / 5 = 3 Compare the t-score to the confidence interval and make a conclusion. Since the t-score is beyond the confidence interval and within the rejection region we must reject the null hypothesis. Using the Chi-Squared Distribution The chi-squared statistic (x 2 ) is used to compare observed values to the expected values in an experiment . The formula for the chi-squared statistic is the sum of all (observed values - expected value)
- 5. 2 / expected value . The chi-squared table is much like the t-table meaning that you have to calculate the degrees of freedom but this time we use the number of categories -1 rather than n -1. The chi- squared table has p-values listed in the first row which represent the area left under the chi-squared distribution as it relates to the confidence interval. P=.05 represents a 95% confidence interval, P= .01 represents a 90% confidence interval, and P= .001 represents a 99% interval . Once you have found the degrees of freedom then you look over to the corresponding column for the p-value. The number where that row and that column meet is the chi-squared statistic. The data must fill two conditions in order to use the chi-squared distribution: 1) the total observed values must exceed 20 and 2) the expected value must exceed 4 for each category. Watch this video to see what the chi-squared distribution looks like and how it works. Let's Practice: A high school principal gave a questionnaire to 25 boys and 25 girls to see if gender played a role in the students' responses to the following statement: "All gym classes should be scheduled at the end of the day." 1- disagree 2-don't know 3-agree The principal is only concerned with the number of disagree responses obtained. The principal's hypotheses and the results of the questionnaire are listed below: H 0 = Gender does not play a role in the students' responses. H 1 = Gender does play a role in the students' responses.
- 6. Categories (Gender) Frequency of "disagree" responses Boys 20 Girls 10 Step 1 : Organize all values to find x 2 Steps to finding x 2 Boys Girls Total Observed Values (o) 20 10 30 Expected Values (e) 15 15 30 o - e 5 -5 ( o - e) 2 25 25 (o - e) 2 / e
- 7. 1.6 1.6 the sum of all (o -e) 2 / e 1.6 1.6 3.2 What does this mean? The observed values are the actual number of males and females who answered disagree to the question. The expected values is the average of the observed values(total expected value/# of categories). Now that we have calculated the chi-squared or critical value we must compare it to the actual chi-squared statistic. We find the degrees of freedom by subtracting 1 from the number of categories. Since we have two categories (male and female) the degrees of freedom = 2 - 1 = 1. Remember that the confidence level is 95% so that means that there is a = .05 so we are looking for the number where row 1(degrees of freedom) and column p = .05 (alpha level) intersect. Find this number on the chi-squared table . The value is 3.84. To conclude we must determine whether x 2 is greater than or equal to that value or less than that value. If the chi squared that we calculated from the set of data is ≥ the p-value (value from chi-squared table) then we must reject the null hypothesis and if it is less than the p-value then we can not reject the null hypothesis. Since x 2 = 3.2 and 3.2 < 3.84 we can not reject the null hypothesis. So
- 8. the principal can not rule out the fact that the genders did not play a role in the students' responses to the statement. Additional Resources chi-squared worked examples NEXT TEACHER OFFICE HOURS ARE: Grading Rubric: Grading for this lesson: To get a 10 : All answers are correct the first time, or within first revision. To get a 9 : You can have 1 incorrect answer after your original submission. To get an 8 : You can have 2 incorrect answers after your original submission. To get a 7 : You can have 3 incorrect answers after your original submission. To get a 6 : You can have 4 incorrect answers after your original submission. To get a 5 : Cheating- Plagiarism - purposeful or mistaken, which will lower your finalgrade for the course (so be very careful when posting your work!); lack of effort, disrespect, or attitude (we are here to communicate with you if you don't understand something); lesson requirements have not been met. Note: For this class it is necessary to post the questions over each answer. Failure to do so will result in asking for a revision. No grade will be given for incomplete work .
- 9. Assignment: For questions 1- 5 use confidence intervals to test the hypothesis. 1) A light bulb producing company states that its lights will last an average of 1200 hours with a standard deviation of 200 hours. A sample of 100 light bulbs from the company were tested and the researcher found that the average life of each light bulb was 1050 hours. At a 95% confidence level, determine whether these light bulbs are in compliance with the company's claim. 2) A company's human resource department claims that all employees are present on the average 4 days out of the work week with a standard deviation of 1. They hired an outside company to do an audit of their employees' absences. The company took a sample a 10 people and found that on the average the employees were present 3 days per week. With a 95% confidence level, determine whether the company's claim is true based on the data from the sample. 3) A teacher claims that all of her students pass the state mandated test with an average of 90 with a standard deviation of 10. The principal gave the test to 20 of her students to see if the teacher's claim was true. He found that the average score was 75. With a 95% confidence level, determine whether the teacher is making the correct claim about all of her students. 4) The lifeguard's at a local pool have to be able to respond to a distressed swimmer at an average of 10 seconds with a standard deviation of 4 in order to be considered for employment. If a sample of 100 lifeguards showed that their average response time is 15 seconds, with a confidence level of 95% determine whether this group may be considered for employment. 5) It is believed that an average of 20 mg of iodine is in each antibiotic cream produced by a certain company with a standard deviation of 5 mg. The company pulled 150 of its antibiotic creams and found that on the average each cream contained 29 mg of iodine. Determine with a 95% confidence level whether
- 10. or not these creams are in compliance with the company's belief? For questions 6 - 10 use the chi-squared distribution to test the hypothesis. 6) A restaurant owner wants to see if the business is good enough for him to purchase a restaurant. He asks the present owner for a breakdown of how many customers that come in for lunch each day and the results are as follows: Monday - 20, Tuesday - 30, Wednesday - 25, Thursday - 40 and Friday - 55. The prospective owner observes the restaurant and finds the following number of customers coming for lunch each day: Monday- 30, Tuesday - 15, Wednesday- 7, Thursday 40, and Friday - 33. At a 95% confidence level determine whether the present owner reported the correct number of customers for lunch each day. 7) An employer polled its employers to see if they agree with the proposed new store hours and whether or not their present shift made a difference in their answers. The customers answered 1 for agree, 2 for don't know, and 3 for disagree. Nine first shift employees answered "agree", 15 second shift employees answered "agree", and 20 third shift employees answered agree. With a 95% confidence level determine whether or not the employees' present shift played a role in their responses to the poll. 8) A politician surveyed 100 citizens to determine if their job title had anything to do with the way they responded to the following statement: "A city-wide curfew will be put into place. Select the time that you think it should be put into place. 8pm, 9pm, or 10pm". He is mostly concerned with the 10 pm responses. 25 teachers chose 10pm, 40 doctors chose 10pm, and 35 police responded 10pm. With a 95% confidence level, determine whether job title plays a role in how the citizens responded to the statement. 9) A meter reader did an experiment to see if there is a relationship between the number of tickets she writes and the number of blocks she is away from the park that is considered
- 11. the heart of the city. At 0 blocks from the park she writes 35 tickets, at 1 block away from the park she writes 25 tickets, at 2 blocks from the park she writes 20 tickets and at 3 blocks from the park she writes 25 tickets. Use a 95% confidence level. 10) A high school principal asks his students to respond to the following statement: "School should start at 9:00am rather than 7:00am. Answer 1 for agree, 2 for don't know, and 3 for disagree." There were 90 seniors who answered agree, 35 juniors, 30 sophomores, and 25 freshmen. Help the principal decide with a 95% confidence level that the students' status played a role in how they responded to the question. To upload a file for the teacher to see, click here.