Infographic: Women CEOs of the last 10 years
•
12 j'aime•2,463 vues

This infographic draws on Strategy&’s unique database about outgoing and incoming CEOs. We highlight two key differences in the career tracks of women and men CEOs at the world’s largest public companies between 2004 and 2013. The graphic also shows where women CEOs have been most and least prevalent in terms of geography and industry — and predicts how the share of women CEOs will grow. Learn more: http://www.strategyand.pwc.com/global/home/what-we-think/chief-executive-study
Recommandé

Recommandé
Contenu connexe
Tendances
Tendances (20)
Similaire à Infographic: Women CEOs of the last 10 years
Similaire à Infographic: Women CEOs of the last 10 years (20)
Plus de PwC's Strategy&
Plus de PwC's Strategy& (9)
Dernier
Dernier (17)
Infographic: Women CEOs of the last 10 years
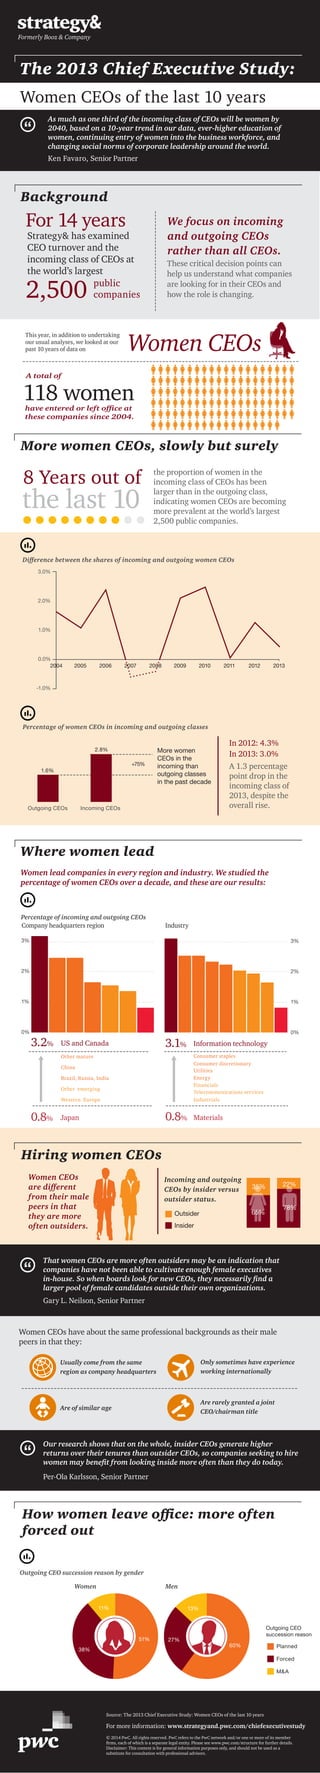
- 1. Women CEOs have about the same professional backgrounds as their male peers in that they: Are rarely granted a joint CEO/chairman title Usually come from the same region as company headquarters Only sometimes have experience working internationally Are of similar age Our research shows that on the whole, insider CEOs generate higher returns over their tenures than outsider CEOs, so companies seeking to hire women may benefit from looking inside more often than they do today. Per-Ola Karlsson, Senior Partner Where women lead Women lead companies in every region and industry. We studied the percentage of women CEOs over a decade, and these are our results: US and Canada Information technology Japan 3.2% 0.8% Materials0.8% Percentage of incoming and outgoing CEOs 3.1% Company headquarters region Industry 0% 1% 2% 3% 0% 1% 2% 3% Other mature China Brazil, Russia, India Other emerging Western Europe Consumer staples Consumer discretionary Utilities Energy Financials Telecommunications services Industrials Hiring women CEOs Women CEOs are different from their male peers in that they are more often outsiders. That women CEOs are more often outsiders may be an indication that companies have not been able to cultivate enough female executives in-house. So when boards look for new CEOs, they necessarily find a larger pool of female candidates outside their own organizations. Gary L. Neilson, Senior Partner Incoming and outgoing CEOs by insider versus outsider status. Outsider Insider the proportion of women in the incoming class of CEOs has been larger than in the outgoing class, indicating women CEOs are becoming more prevalent at the world’s largest 2,500 public companies. More women CEOs, slowly but surely the last 10 8 Years out of -1.0% 0.0% 1.0% 2.0% 3.0% 20052004 2006 2007 2008 2009 2010 2011 2012 2013 Difference between the shares of incoming and outgoing women CEOs Percentage of women CEOs in incoming and outgoing classes More women CEOs in the incoming than outgoing classes in the past decade Outgoing CEOs Incoming CEOs +75% 1.6% 2.8% have entered or left office at these companies since 2004. A total of 118 women This year, in addition to undertaking our usual analyses, we looked at our past 10 years of data on The 2013 Chief Executive Study: Women CEOs of the last 10 years As much as one third of the incoming class of CEOs will be women by 2040, based on a 10-year trend in our data, ever-higher education of women, continuing entry of women into the business workforce, and changing social norms of corporate leadership around the world. Ken Favaro, Senior Partner How women leave office: more often forced out Outgoing CEO succession reason by gender Women Men Outgoing CEO succession reason Planned Forced M&A Source: The 2013 Chief Executive Study: Women CEOs of the last 10 years 11% 38% 51% 13% 27% 60% Women CEOs A 1.3 percentage point drop in the incoming class of 2013, despite the overall rise. In 2012: 4.3% In 2013: 3.0% © 2014 PwC. All rights reserved. PwC refers to the PwC network and/or one or more of its member firms, each of which is a separate legal entity. Please see www.pwc.com/structure for further details. Disclaimer: This content is for general information purposes only, and should not be used as a substitute for consultation with professional advisors. For more information: www.strategyand.pwc.com/chiefexecutivestudy Background We focus on incoming and outgoing CEOs rather than all CEOs. For 14 years Strategy& has examined CEO turnover and the incoming class of CEOs at the world’s largest 2,500 These critical decision points can help us understand what companies are looking for in their CEOs and how the role is changing. public companies 35% 22% 65% 78%