1. Normal Distribution
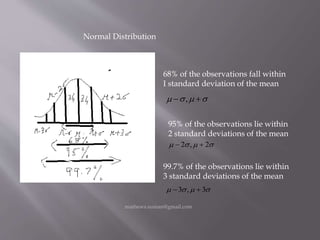
68% of the observations fall within
I standard deviation of the mean
,
95% of the observations lie within
2 standard deviations of the mean
2,2
99.7% of the observations lie within
3 standard deviations of the mean
3,3
mathews.suman@gmail.com
2. Between 1 and 2 standard deviations above
the mean, no. of observations = 13.5%
Between 1 and 2 standard deviations
below the mean, no. of observations = 13.5%
Between 2 and 3 standard deviations
above the mean,
no. of observations = 2 %
Between 2 and 3 standard deviations
below the mean,
no. of observations = 2 %
mathews.suman@gmail.com
3. The random variable X is normally distributed. The values 650 and 850
are at the 60th and the 90th percentile of the distribution of X respectively.
Quantity A Quantity B
The value at the 75th percentile 750
of the distribution of X
A)The quantity in Column Ais greater
B)The quantity in Column B is greater
C)The 2 quantities are equal
D) The relationship cannot be determined from the information given.
mathews.suman@gmail.com
4. A(between the 60th and 75th percentile)=A(between the 75th and 90th percentile)
The 75th percentile has to be more towards the 60th percentile since the graph
tapers toward the end and area towards the end is small.
Hence as shown in the graph the value 750 is greater
Answer = B
mathews.suman@gmail.com
5. Assuming a normal distribution in a sample of 1000, if the average is 0.135
with a standard deviation of 0.021, .205 is how many standard deviations
from the mean
0.205-0.135=0.07
3.3021.07.0
.205 is 3 to 4 standard deviations from the mean
mathews.suman@gmail.com
6. A survey is conducted to determine how many strawberries are eaten
by 100,000 people during a one year period. The number of strawberries
is approximately normally distributed with a mean of 29 strawberries and
a standard deviation of 4 strawberries eaten by approximately each person.
According to this data, approximately how many of the surveyed people ate
more than 25 strawberries during the course of the year
A) 16000
B) 48000
C) 60000
D) 68000
E) 84000
mathews.suman@gmail.com
7. One standard deviation below the mean = 29-4=25
Approximately 34% lie one standard deviation below the mean.
No of people who ate more than 25 strawberries = 50 %+34%=84%
Ans = 84% of 100,000 = 84,000
Ans = E
mathews.suman@gmail.com
9. As shown in the figure, no. of adult penguins between 65 cm and 75 cm
= 48% of 3000= 1440
No. of penguins with height <60 cm = 15% of 3000= 450
Estimated probability = 450/3000=0.15 approximately
mathews.suman@gmail.com