AURH - Analytical Atlas of freigth transport in NWE
•
1 j'aime•1,390 vues

Published in november 2014

Recommandé
Contenu connexe
Tendances
Tendances (20)
En vedette
En vedette (20)
Similaire à AURH - Analytical Atlas of freigth transport in NWE
Similaire à AURH - Analytical Atlas of freigth transport in NWE (20)
Plus de AURH - Agence d'urbanisme Le Havre - Estuaire de la Seine
Plus de AURH - Agence d'urbanisme Le Havre - Estuaire de la Seine (20)
Dernier
Dernier (14)
AURH - Analytical Atlas of freigth transport in NWE
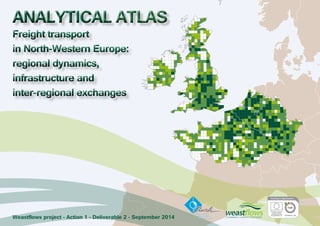
- 1. ANALYTICAL ATLAS Freight transport in North-Western Europe: regional dynamics, infrastructure and inter-regional exchanges Weastflows project - Action 1 - Deliverable 2 - September 2014
- 3. CONTENT Executive summary....................................................................................................p.5 Part 1: geographical analysis of North-Western Europe.....p.7 About geographical analysis....................................................................................................p.8 1.1 European territorial organisation ...............................................................................p.10 1.2 Maritime organisation.....................................................................................................p.12 1.3 Organisation of transport infrastructure networks..................................................p.18 Part 2: focus on each of the eleven remarkable areas in North-Western Europe.............................................................................................p.25 About quantitative and qualitative analysis.........................................................................p.26 2.1 Ireland..................................................................................................................................p.30 2.2 Shannon-Limerick Gateway..........................................................................................p.32 2.3 Scotland...............................................................................................................................p.34 2.4 Liverpool and the west coast........................................................................................p.36 2.5 Greater London and central England.........................................................................p.38 2.6 Southern England.............................................................................................................p.40 2.7 Southern Netherlands......................................................................................................p.42 2.8 Benelux and Eastern France........................................................................................p.44 2.9 Western Germany............................................................................................................p.46 2.10 Northern France................................................................................................................p.48 2.11 Seine Gateway®................................................................................................................p.50 Part 3: analysis of interactions.......................................................................p.53 About the analysis of interactions..........................................................................................p.54 3.1 General analysis of interactions broken down by geozone..................................p.56 3.2 Key interactions between geozones.............................................................................p.58 3.3 Modal analysis of interactions........................................................................................p.60 3.4 Dominant interactions by individual geozones..........................................................p.62 3.5 Transnational dominant interactions.............................................................................p.64 Conclusion Rolling out new European dynamics........................................................p.68 Map index.............................................................................................................................p.71
- 4. North-Western Europe NORWAY Münster DENMARK Dortmund NETERLANDS Antwerp Dusseldorf Köln Den Haag Lille Shetland, Scotland Shetland Dundee UNITED KINGDOM Edinburgh Newcastle upon Tyne Sheffield Cambridge Chelmsford Canterbury Dunkerque Amiens Paris Glasgow Belfast Aberdeen Sunderland Armagh Carlisle Lancaster Dublin Leeds Salford Birmingham Wolverhampton Hereford Bristol London Amsterdam Brussel Kassel GERMANY Frankfurt am Main SWEDEN Nürnberg Mannheim Stuttgart Gent BELGIUM Charleroi LUXEMBOURG Dijon Reims Liège Portsmouth Caen Angers Southampton Rennes Nantes Swansea Augsburg Le Havre Cardiff Plymouth Luxembourg Saarbrücken Strasbourg Freiburg im Breisgau Metz Galway Limerick Cork Rouen Le Mans Tours Brest Nancy Orléans Mulhouse Besançon IRELAND FRANCE Cities between 45,038 and 145,000 inhabitants between 145,001 and 450,000 inhabitants between 450,001 and 1,000,000 inhabitants over 1 million inhabitants Contextual information North-Western Europe Other European countries $ Data source powered by AURH Boudaries ©MBR and EuroGeographics,©ESRI Km Map data © OpenStreetMap contributors, ODbl ®AURH -2013/06 4 Analytical atlas - Freight transport in North-Western Europe: regional dynamics, infrastructure and inter-regional exchanges - AURH - September 2014 AUSTRIA ITALY UNITED KINGDOM SWITZERLAND NORTH SEA ATLANTIC OCEAN ENGLISH CHANNEL ATLANTIC OCEAN 0 25 50 100 GeoWeastflows platform November 2013 - The interactive cartography tool developed by the Henri Tudor Public Research Centre in Luxembourg and AURH can be accessed free of charge through a simple registration at: http://geo.weastflows.eu ATLAS Major North-West European freight infrastructures Weastflows project - Action 1 - Deliverable 1 - June 2013 The Atlas of North-Western Europe freight transport infrastructures June 2013 - 47 maps bringing together context maps, maps by transport mode and regional maps. It can be downloaded on www.aurh.fr and www.aurhinweastflows.com
- 5. Development of ports and freight flow management have a strong correlation with the infrastructure network and its capacity to propose a panel of multimodal services that decrease the environmental impact of goods transport. Knowing the characteristics, strengths and weaknesses, opportunities and threats of this network is thus crucial, as well as deep knowledge of the main inter-regional goods exchanges. This is the goal of the work carried out by AURH in this report with a quantitative, qualitative and cartographical analysis of the transport infrastructures and regional dynamics. This publication is a part of the European Weastflows project (INTERREG IV B for North- Western Europe). This four-year project (2011-2014) is aimed at improving North-Western Europe logistics and freight transport as well as identifying alternative solutions to mitigate congestion in the Northern Range ports and traditional North-South roads. The scope of the study includes seven European countries (cf. map). It does not include the southern part of France, the northern part of the Netherlands, the eastern part of Germany and because of this, a part of the Northern Range, including Hamburg. This Analytical Atlas is the second stage of work AURH has carried out for Weastflows. It follows The Atlas of Major North-West European Freight Infrastructures published in June, 2013. This atlas listed an inventory of transport infrastructures, including all types of goods and modes, whether they already existed or were planned. This second opus goes even further and readers will be invited to comprehend stakes concerning transport of goods in North-Western Europe, taking into account the infrastructures and looking at this from a sustainable development point of view. It raises the question of the massification of exchanges, of modal changes as well as the environmental impact freight transport has. This deliverable uses data from the Geographical Information System (GIS) designed by AURH. This GIS data base, drawn up with the assistance of all partners in this project, is today considered as a reference work. It is a free of charge source of information on North-Western Europe freight transport infrastructures. OpenStreetMap is the main reference document and has been laid out and enriched to comply with Weastflows’ requirements. This data can be consulted, after registration, on the GeoWeastflows interactive cartography platform developed by AURH and the Henri Tudor Public Research Centre, a Weastflows partner, based in Luxembourg at the following link: http://geo.weastflows.eu For this deliverable, AURH designed a method that uses GIS spatial analysis tools applied to the infrastructure network, and including, in particular: • development of a grid analysis for a geographical study of the network which points out its concentrations; • definition of indicators to highlight strengths and weaknesses; • cartography of goods exchanged between North-Western Europe regions for a preliminary matching with infrastructures. This document is organised in three parts, each preceded by a methodological introduction. The first part proposes a geographical analysis of North-Western Europe. It focuses on regional characteristics: demography, land use, the port network and transport infrastructures. The second part presents a quantitative and qualitative analysis on the network of infrastructures. It concerns eleven remarkable strategic regional areas for freight transport. These areas were defined, in a collusive manner, at the beginning of the project. The Atlas had already included a series of maps at this scale. Lastly, the third part focuses on the analysis and qualification of the main goods exchanged between regions in North-Western Europe. These interactions were analysed using a theoretical goods flow matrix structure. This matrix structure was designed by the Scottish partner, SEStran in the framework of Action 4 of the project on the analysis of freight demand. AURH integrated the data into the GIS. Analytical atlas - Freight transport in North-Western Europe: regional dynamics, infrastructure and inter-regional exchanges - AURH - September 2014 5 EXECUTIVE SUMMARY
- 7. Part 1 Geographical analysis of North-Western Europe
- 8. About geographical analysis This geographical analysis provides keys allowing readers to better understand territorial and maritime stakes of freight transport. It includes three parts: • demographic and industrial densities; • port organisation; • transport infrastructures using the grid analysis method. Why use grid analysis? The European Union statistical system is based on a territorial division shared by the entire European Union called NUTS (Nomenclature of Territorial Units for Statistics). This reference system has three stages of division from NUTS 1 to NUTS 3. It is based on administrative divisions of member States correlated to population weight. Because of this, there are large divergences from one country to another, in particular in terms of area, which generates disequilibrium when comparing two zones between themselves. How does it work? Knowing this, AURH has designed a specific grid variation that divides the North-West European area into 1,290 squares of 800 km2 each. This division is more precise than the NUTS reference system which divides the same area into 485 NUTS 3, with an average area of 1,650 km2. The size chosen corresponds to the area of the smallest German administration division, which is equivalent to districts or city districts. Each square then brings information stemming from crossing it with network infrastructures. The grid analysis method was developed for roads, railways and inland waterways as well as for nodal elements such as ports, railway terminals and airports: • the infrastructure density was measured for networks by including each square in the total length of the network ; • for nodal infrastructures (ports, railways terminal and airports), the density of infrastructures was measure by the total number of nodes in each square. By cross referencing this data, each square gives information indications on the accumulated lengths of intersected networks or the total number of nodal infrastrutures. In order to make the grid variation easier to read, a discretization of data into three classes was made, using the standard discretization method. Each class was qualified according to the following categorization: strong, average and weak for the infrastructure concentration level. Some squares can belong to no class at all, and thus give “absence of data” information. This can mean two things: • either there are no infrastructures at all, • or there are no infrastructures adapted to mass freight transport. Methodological interest of grid analysis With grid analysis, you can: • exceed limitations of administrative divisions or traditional statistics, • supply a homogeneous data repository in which each area can be compared objectively to the others, • cross reference data. What grid analysis shows Grid analysis methods, when applied to the analysis of transport infrastructures for each of the three modes inland waterways, and the associated nodal infrastructures (ports, railways terminal and airports) give a geographical analysis of freight transport infrastructures: • it highlights concentrated infrastructures, • it pre-identifies congested zones as well as sectors conducive to the development of intermodality, • it highlights the continuities and discontinuities of the network. The grid analysis method focuses on territorial divergences by highlighting network densities. 8 Analytical atlas - Freight transport in North-Western Europe: regional dynamics, infrastructure and inter-regional exchanges - AURH - September 2014
- 9. Commentaires Fromto NgUridT Sd i3vi sdioivnision infraVsetrnutciltautrioen n oeft wthoerk in the squares of the grid (Sources : Weastflows project, AURH processing) Analytical atlas - Freight transport in North-Western Europe: regional dynamics, infrastructure and inter-regional exchanges - AURH - September 2014 9
- 10. " " " " " " " " " Warszawa " " " European territorial organisation $ Data source ©CorineLandCover2006; ©Powered by AURH Boudaries ©MBR and EuroGeographics,©ESRI Km Map data © OpenStreetMap contributors, ODbl ®AURH -2013/06 0 50 100 200 Areas with the highest densities Areas with the lowest densities " " " " " " " " Rome Paris Madrid Berlin London Brussels Wien Oslo Praha Zagreb Dublin Budapest Sarajevo Stockholm Kobenhavn Ljubljana Amsterdam Bratislava Luxembourg en nombre d’habitants par km² 150 250 500 1 500 5 000 21 100 2 50 densités les plus faibles densités les plus fortes Capitales et villes européennes Dissymétrie Capitale européenne Ville de plus de 1 million d'habitants Éléments de contexte number of inhabitants per square kilometre lowest density highest density 2 50 European capitals and main cities Dissymmetry Capital city 150 250 500 1 500 5 000 21 100 City over 1 million of inhabitants Perimeter 10 Analytical atlas - Freight transport in North-Western Europe: regional dynamics, infrastructure and inter-regional exchanges - AURH - September 2014 Demographic dissymmetry In 2013, the European Union had 505.7 million inhabitants of which 35% live in North-Western Europe (sources Eurostat). Germany, France and the United Kingdom come in first as the most heavily populated Member States with respectively 80, 65 and 63 million inhabitants. North-Western Europe has the most cities with a dense population: 216 inhabitants per square kilometre as compared with 117 inhabitants per square kilometre for the European Union as a whole. Population breakdown has strong spacial divergences which seem like a fracture line dividing Europe into two distinct parts: • in the East, the highest densities are found in five cities with over a million inhabitants in the scope of our study: London, Birmingham, Paris, Brussels and Cologne; • in the West, countries with the lowest population densities include Spain, Portugal, as well as the Western sides of Ireland and France. Ligne de fracture Densité de population Ville entre 450 000 et 1 million d'habitants Europe du Nord-Ouest Dividing line Population density City between 450,000 and 1 million inhabitants North-West Europe 1.1
- 11. !( !( !( !( !( !( !( !( !( !( !( !( !( !( !( !( !( !( !( !( !( !( !(!( !( !( !( !( !( !( !( !( !( !( !( !( !( !( !( !( !( !( !( !( !( !( !( !( !( !( !( !( !( !( !( !( !( !( !( !( !( !( !( !( !( !( !( !( !( !( !( !( !( !( !( !( !( !( !( !( !( !( !( !( !( !( !( !( !( !( !( !( !( !( !( !( $ !( Data source ©CorineLandCover2006; ©Powered by AURH Boudaries ©MBR and EuroGeographics,©ESRI Map data © OpenStreetMap contributors, ODbl ®AURH -2013/06 !( !( !( !( !( !( Warszawa !( !( " " " " " " " " " " " " " " " " " " " " Rome Paris Madrid Berlin London Brussels Wien Oslo Praha Zagreb Dublin Budapest Sarajevo Stockholm Kobenhavn Ljubljana Amsterdam Bratislava Luxembourg Km 0 50 100 200 Areas with the highest densities Areas with the lowest densities Densité industrielle surface en m² / 1 000m² dédiée à l’industrie 5 7 12 20 43 175 densités les plus faibles densités les plus fortes Volume total de marchandises chargées et déchargées Dissymétrie 0 2 Ligne de fracture Europe du Nord-Ouest NUTS 2 maritimes en milliers de tonnes, par NUTS 2 203 000 !(!(!(!( Éléments de contexte Industrial density area in m² dedicated to industry 5 7 12 20 43 175 lowest density highest density Total volume of goods loaded and unloaded Dissymmetry 0 2 in thousands of tonnes per NUTS 2 area Perimeter Dividing line North-Western Europe !(!(!(!( Coastal NUTS 2 area 100 000 60 000 20 000 11 000 203,000 100,000 60,000 20,000 11,000 Analytical atlas - Freight transport in North-Western Europe: regional dynamics, infrastructure and inter-regional exchanges - AURH - September 2014 11 Industrial dissymmetry Industrial density measures the space dedicated to industrial infrastructures in square metres in a 1,000 square metre area. This ratio allows us to visualise the area’s largest industrial basins. The average North-Western Europe industrial density is 101 m2 per 1,000 m2. North-Western Europe’s largest industrial infrastructure densities are thus concentrated in the German Ruhr River Basin, the Parisian Basin in France and in the Manchester-Liverpool industrial basin in the United Kingdom. Like the population, industry is not spread smoothly throughout the territory. It is located around a type of fault line that cuts Europe into two parts. Industrial infrastructures starting with Dublin, Paris and Northern Italy are completely concentrated along the European backbone to the East, with Poland and Austria, thus excluding Western Ireland and France as well as Spain. The heaviest maritime traffics are concentrated in the regions located to the East of this fault line, where demographic and industrial densities are the highest.
- 12. " Coastline of the British and Irish Isles $ Data source ©Eurostat 2010; ©Powered by AURH Boudaries ©MBR and EuroGeographics,©ESRI Km Map data © OpenStreetMap contributors, ODbl ®AURH -2014/05 0 50 100 200 Baltic Arc Mediterranean Arc Atlantic Coastline North Range Rome Paris Madrid Berlin London Brussels Wien Oslo Praha Zagreb Dublin Warszawa Budapest Sarajevo Stockholm Kobenhavn Ljubljana Amsterdam Bratislava Luxembourg " " " " " " " " " " " " " " " " " " " Maritime organisation 1.2 Range Nord Arc Baltique Arc Méditerranée Façade des Iles Britanniques Façade Atlantique North Range Baltic Arc Mediterranean Arc 12 Analytical atlas - Freight transport in North-Western Europe: regional dynamics, infrastructure and inter-regional exchanges - AURH - September 2014 European maritime facades North-Western Europe is an area facing the sea. Its littoral is 26,000 km long. A third of the population, amounting to 61 million persons, lives near the coast and generates over 40% of the GDP. This littoral is composed of three maritime facades : • the British and Irish Isles facade with Ireland, England, Scotland and Wales, • the Atlantic facade on the Western French coast which begins in Brittany and goes until the South of Portugal border, • the Northern Range which goes from Le Havre to Hamburg. Please note the North-West European division does not include the Atlantic facade Façades or maritimes the Northern Range facade. Éléments de contexte NUTS 2 maritimes Europe du Nord-Ouest North-Western Europe European coastlines Perimeters Coastline of the British and Irish Isles Atlantic Coastline Coastal NUTS 2 area
- 13. $ Data source Eurostat - 2012 Km Boudaries ©MBR and EuroGeographics,©ESRI ®AURH -2014/05 0 25 50 100 Amsterdam North Range 900 Mt Atlantic Coastline 29,8 Mt Coastline of the British and Irish Isles 500 Mt Paris London Dublin Brussels Luxembourg Shetland, Scotland Shetland Trafic total de marchandises par principaux ports* en milliers de tonnes, en 2012 Range Nord Façades maritimes 400 000 100 000 50 000 10 000 1 000 Façade des Îles Britanniques Façade Atlantique Façade maritime 500 Mt Trafic total en millions de tonnes par façade maritime *sélection des ports ayant un trafic supérieur à 1 million de tonnes Éléments de contexte Europe du Nord-Ouest Capitale Total freight traffic by main ports* per thousand tonnes, in 2012 North Range Maritime coastlines 400,000 100,000 50,000 10,000 1,000 Coastline of the British and Irish Isles Atlantic coastline Maritime coastline 500 Mt Total trafic in millions of tonnes per maritime coastline *selection of ports with a freight traffic over 1,000 thousand tonnes Contextual information North-Western Europe Capital city Analytical atlas - Freight transport in North-Western Europe: regional dynamics, infrastructure and inter-regional exchanges - AURH - September 2014 13 Maritime port traffic North-Western Europe has 65 maritime ports with a freight traffic of over one million tonnes (sources Weastflows). They generate a total traffic density of over 1.5 billion tonnes annually. Nevertheless, the three North-Western Europe maritime coastlines have a heterogeneous number of ports and different traffic intensities. The British and Irish Isles coastline has 43 ports generating a total amount of traffic of nearly 500 million tonnes of goods. Because the United Kingdom and Ireland are islands, the strong port grid on their coastlines is easily comprehensible. The Atlantic coastline, with its main entrance port of Nantes-St Nazaire, has lesser traffic with 29.8 million tonnes of goods. Lastly, most of North-Western Europe’s freight traffic is concentrated on the Northern Range coastline with ports generating heavy traffic of over 900 million tonnes. Rotterdam and Antwerp are the main ports. It must be noted that : • All traffic on the Atlantic coastline as well as in the Northern Range is not taken into account here, because of the scope of our study. • All freight traffic is taken into account in this analysis whatever the product may be.
- 14. 16th Edinburg (Leith) 10th Tees and Hartlepool Total 1.2 billion tonnes = 62% of NWE traffic 4th : Grimsby and Immingham ! ! ! ! ! ! ! ! ! ! ! ! ! ! ! $ Data source : Eurostat - 2012 Km Boudaries ©MBR and EuroGeographics,©ESRI ®AURH -2014/05 0 25 50 100 3rd : Amsterdam 1st : Rotterdam 2nd : Antwerpen 5th : Le Havre 20th Dublin 11th Liverpool 8th Milford Haven 14th Felixstowe 6th London 9th Southampton 19th Rouen 15th Ghent 16thDover 13th Zeebrugge 7th Dunkerque 12th Nantes-St Nazaire 17th Ijmuiden Shetland, Scotland Shetland In 2012, 20 North-Western Europe maritime ports had mass freight traffic exceeding 20 million tonnes (source: Eurostat). These top 20 ports generate a total traffic of 1.2 billion tonnes. The five top ports in this ranking have 62% of total traffic. Excepting Grimsby- Immingham, located in the United Kingdom, four of these ports are located on the Northern Range coastline. • Rotterdam comes in first place in North-Western European ports with the highest amount of freight traffic: 400 million tonnes in 2012; • Antwerp comes in second with 165 million tonnes; • Amsterdam comes in third with 71 million tonnes; • Grimsby-Immingham comes in fourth in this ranking with 60 million tonnes; • Le Havre is the fifth North-Western European port with 59 million tonnes. London comes in sixth place. It must be noted that all freight traffic is taken into account in this analysis whatever the product may be. Ranking of main seaports in terms of freight traffic in 2012 ! 20 first seaports 5 first seaports Élément de contexte Contextual information North-Western Europe Classement des ports maritimes d’après leur trafic de marchandises en 2012 ! 20 premiers ports 5 premiers ports Europe du Nord-Ouest 14 Analytical atlas - Freight transport in North-Western Europe: regional dynamics, infrastructure and inter-regional exchanges - AURH - September 2014 Port ranking: top 20
- 15. Port ranking: top 5 per country 2nd :Shannon Foynes Total 44 Mt = 89% of national traffic 3rd : Milford Haven Southampton $ Data source Eurostat - 2012 Km Boudaries ©MBR and EuroGeographics,©ESRI ®AURH -2014/05 0 25 50 100 5th: Tees and Hartlepool Total 216 Mt = 43% of national traffic 1st : Grimsby and Immingham 2nd : Port of London 2nd :Dunkerque 5th : Calais 1st : Le Havre Total 167 Mt = 55% of national traffic 1st : Rotterdam 2nd : Amsterdam 4th : Vlissigen Total 520 Mt = 96% of national traffic Total 1 Mt Total 223 Mt = 99% of national traffic 4th : Rouen 4th : 3rd : Nantes Saint-Nazaire 3rd : Cork 1st : Dublin 4th : Bantry Bay 5th : Rosslare 1st : Duisburg 2nd : Krefeld 4th : Andernach 1st : Antwerpen 2nd : Zeebrugge 3rd : Ghent 4th : Ostend 5th : Liège 3rd : Ijmuiden 5th : Terneuzen 3rd : Koeln 5th :Wesel Shetland, Scotland Shetland This map presents the five largest maritime or interior ports in each country of North-Western Europe in terms of freight traffic. The total amount of freight traffic, in millions of tonnes, of the five highest ranked ports in each country is given and compared to the total maritime freight traffic of the country, except for Germany, as it only has interior ports on the North-West European perimeter. The ranking of the five most important ports per country indicates the main North-Western Europe maritime entrance ports. The top five Belgian and Dutch maritime ports respectively concentrate 96% and 99% of their domestic freight maritime traffic. In Ireland, the top five ports share 89% of domestic traffic. The top five ports of Northern France, which is split into two parts by the North-Western Europe perimeter, generate a bit over one half of the French maritime freight traffic. Le Havre is the maritime entrance port of this Northern half of France, as well as being a complement to the Rouen sea port. Lastly, in the United Kingdom, the top five ports concentrate less than half of the total of domestic freight traffic. The Grimsby-Immingham port, England’s main maritime entrance port, is located north of London. Classement portuaire, top 5 par pays d’après leur trafic de marchandises en 2012 1er port 2ème au 5ème port Pays concernés par le classement Élément de contexte Europe du Nord-Ouest Irlande Royaume-Uni France Pays-Bas Belgique Allemagne It must be noted that all freight traffic is taken into account in this analysis whatever the product may be. Port ranking, top 5 by country Contextual information in terms of freight traffic in 2012 North-Western Europe 1st seaport 2nd to 5th port Country Ireland United-Kingdom France The Netherlands Belgium Germany Analytical atlas - Freight transport in North-Western Europe: regional dynamics, infrastructure and inter-regional exchanges - AURH - September 2014 15
- 16. Shetland, Scotland Breakdown of import/export traffic 1st : Edinburg (Leith) 2nd : Tees and Hartlepool 5th : Rouen 4th : Glensanda 1st : Rotterdam 3rd :Amsterdam 2nd :Antwerpen 5th :Le Havre 3rd : Sullom Voe 4th : Londres $ Data source ©Ports Authority; ©Powered by AURH Boudaries ©MBR and EuroGeographics,©ESRI Km Map data © OpenStreetMap contributors, ODbl ®AURH -2013/06 0 25 50 100 Shetland Each port’s freight traffic is broken down between the share of imported and exported traffic. Here, we want to differentiate profiles that import or export more as ports in order to locate the main entrance and exit freight ports in North-Western Europe. The majority of Northern Range ports are import ports. The Rotterdam, Amsterdam, Antwerp and Le Havre ports all have the same proportional profile: nearly three quarters of traffic volume is imported as compared with a bit over a quarter that is exported. These are the main European freight entrance ports serving the hinterlands. On the United Kingdom scale, London is the main importing port, coming in fourth place in North-Western Europe. Trafic total The en millions four leading de tonnes, exporting en 2011 ports in North-Western Europe are located in the United Kingdom: • 1 in England, Tees and Hartlepool, • 3 in Scotland: Edinburgh, Glensanda (sand and gravel for United 430 276 70 30 Kingdom and European construction industries) and Sullom Voe (crude oil). They show goods production and distribution sites with regional, national or European markets. Part du trafic dédié à l’import Part du trafic dédié à l’export Classification import/export Port majoritairement importateur Top 5 des ports ayant la balance commerciale à l’import la plus excédentaire Port majoritairement exportateur Top 5 des ports ayant la balance commerciale à l’export la plus excédentaire Élément de contexte It must be noted that all freight traffic is taken into account in this analysis whatever the product may be. Europe du Nord-Ouest Total traffic in millions of tonnes, in 2011 Import/export classification 430 276 70 30 Share of import traffic Share of export traffic Port that mainly imports Top 5 ports with the highest balance of trade when importing Port that mainly exports Top 5 ports with the highest balance of trade when exporting Contextual information North-Western Europe 16 Analytical atlas - Freight transport in North-Western Europe: regional dynamics, infrastructure and inter-regional exchanges - AURH - September 2014
- 17. Port ranking per type of goods Milford Haven Amsterdam $ Data source ©ESPO, ©Autorités Portuaires Km Boudaries ©MBR and EuroGeographics,©ESRI ®AURH -2014/05 0 25 50 100 2 1 1 1 3 5 2 3 5 5 4 2 1 5 3 4 3 2 London Le Havre 4 4 Immingham Felixstowe Dover Rotterdam Zeebrugge Dunkerque Calais Antwerpen Shetland, Scotland Shetland In order to pinpoint the specificities of the main maritime ports in our study, we ranked the ports according to the volume of traffic by type of goods transported: containers, liquid bulk, solid bulk, and roll-on/roll-off shipping (RoRo). The map presents port rankings per type of goods with the top five in each category. On the 12 ports in this ranking, seven are located in the Northern Range and five in England. Rotterdam and Antwerp stand out as being in the top five for three types of goods: freight containers, liquid bulk and solid bulk. Rotterdam is the leading liquid and solid bulk port as well as the leading freight container port. Antwerp comes in second for freight containers, and in third and fifth place for liquid and solid bulk. Located on the same maritime facade, Le Havre and Zeebrugge are both in the top five for two types of goods. Le Havre comes in fourth for freight containers, just in front of Zeebrugge. Ports in the United Kingdom mainly deal with RoRo and bulk traffic. Other ports, Calais and Dunkirk on the Northern Range and Dover, London, Felixstowe, Immingham and Milford Haven on the Atlantic façade, are in the top five of the North-West European thanks to just one type of traffic volume. Élément de contexte Contextual information North-Western Europe Top 5 des trafics portuaires d’après ESPO, 2010 Port dans le Top 5 pour 2 types de marchandises ou plus Top 5 in port traffic according to ESPO, 2010 Type of freight Container Liquid Bulk Dry Bulk RoRo 5 leading ports 1 for one or several types of freight Port with two or more types of traffic in the ranking Other port with a freight traffic over 1,000 tonnes Catégories de marchandises Conteneur Vrac liquide Vrac solide RoRo 5 premiers ports 1 pour un ou plusieurs types de marchandises Autre port ayant un trafic supérieur à 1 million de tonnes Europe du Nord-Ouest Analytical atlas - Freight transport in North-Western Europe: regional dynamics, infrastructure and inter-regional exchanges - AURH - September 2014 17
- 18. 1.3 Organisation of transport infrastructure networks Inland waterway network: grid analysis method $ Data sources: Weastflows project, Km powered by AURH ®AURH - 2014/06 0 25 50 100 Manchester ship canal Thames Seine Valley Netherlands, Belgium and Rhine basin Loire Saône Valley This map represents concentrations of inland waterways whose ECMT classification exceeds or equals V*, the relevant threshold value for mass freight transport. This highlights the unequal breakdown of the large clearance inland waterway network, stemming from both natural and human factors. Ireland and Scotland have none, thus limiting the potentialities of modal changes to this mode, whereas Benelux and Germany have stronger network concentrations as well as longer continuities. France’s network is also much less developed, and characterised by the absence of continuity and connection with Belgian, Dutch and German networks. England has a nearly non-existing network which, nonetheless, does link country’s two main production and consumption basins to the sea: London to the North Sea with the Thames River and the Liverpool/Manchester region to the Atlantic Ocean via the Manchester Canal. We can identify two complementary networks: the Loire region on the Atlantic facade and the Saone Valley region with interconnections to inland waterways in the South of France. Inland waterways concentration Type of inland waterway concentration* Total length of network per square based on inland waterways with a CEMT class V and over High Medium Low No data** Inland waterway regions Perimeter North-West Europe area *only are considered the relevant infrastructure for high level of freight transportation **no data can mean no infrastructures or no infrastructures relevant for high level of freight transportation Data sources: Weastflows project, powered by AURH Shetland, Scotland Shetland * The ECMT classification indicates the seaworthiness level of the European network of inland waterways. It has seven classes, from I to VII. Type of inland waterway concentration* based on inland waterways with a CEMT class V and over High Medium Low No data** Inland waterway region Contextual information North-Western Europe * only relevant freight transport infrastructures have been considered ** no data can means no infrastructure or no infrastructure relevant for freight transport Concentration de voies navigables* 18 Analytical atlas - Freight transport in North-Western Europe: regional dynamics, infrastructure and inter-regional exchanges - AURH - September 2014
- 19. Road network: grid analysis method $ Data sources: Weastflows project, Km ®AURH 0 25 50 100 powered by AURH - 2014/06 North East of United Kingdom South of United Kingdom Seine Valley Benelux and Rhine basin South of Ireland Saône Valley Karlsruhe / Nuremberg axis Rhine Valley Belfast area square No data** infrastructure transportation infrastructures or level of Shetland, Scotland Shetland Contrary to the inland waterway network, the road network is characterised by quite a homogeneous distribution in the area we studied. This maps shows that nearly all of North-Western Europe is equipped with a road network that is adapted to mass freight transport. Urban centres with dense population levels thus logically have the densest road networks. This is the case, amongst others, of the Rhine River Basin, the Seine River Valley, the central and Southern parts of the United Kingdom, including Greater London, as well as the South of Ireland, with Cork and Waterford. For France, the Seine River Valley stands out as being the axis with the highest number of road infrastructures both in intensity and continuity. At a European level, the South of the United Kingdom is the region with the strongest network densities. Benelux and the Rhine River Basin are characterised by a more homogeneous and regular distribution, well covering their areas. Four complementary areas were also identified: the Belfast region, the Saone River Valley, the Rhine River Valley in its French part as well as the Karlsruhe/Nuremberg axis. The last three allow Southern and Eastern Europe to be interconnected. Type of road concentration* High Medium Low No data** Road region Contextual information North-Western Europe * only relevant freight transport infrastructures have been considered ** no data can means no infrastructure or no infrastructure relevant for freight transportation Concentration de réseau routier* Analytical atlas - Freight transport in North-Western Europe: regional dynamics, infrastructure and inter-regional exchanges - AURH - September 2014 19
- 20. $ Data sources: Weastflows project, Km ®AURH - 2014/06 0 25 50 100 powered by AURH Railway network: grid analysis method Centre of United Kingdom London area Paris area Belgium Netherlands Duisburg and Rhine corridor As is the case with the road network, the railway network is broken down in a quite homogeneous manner throughout the North-West European area, though some disequilibrium does exist. Ireland and Scotland has the smallest concentrations as does Western France, where several zones have no railway Railways infrastructures concentration whatsoever. These regions, from this point of view, are in peripheral positions. It can quite logically be seen that the highest Type concentrations of railway concentration* are found in densely populated urban centres. Areas identified Total length are: of network Belgium per square and the Rhine River axis, Paris and its surrounding region, Greater London and the centre of the United Kingdom. They can differ from those identified for the road networks, which shows the absence of a systematic correlation between the ways in which these two networks were rolled out. Luxembourg and the region around Metz also have a dense concentration of networks. This area holds a central position in the continental part of the area we studied. Last but not least, we must not forget that the English, German and Belgian railway networks are among the densest in North-Western Europe. High Medium Low No data** Railway regions Perimeter North-West Europe area *only are considered the relevant infrastructure for high level of freight transportation **no data can mean no infrastructures or no infrastructures relevant for high level of freight transportation Data sources: Weastflows project, powered by AURH Luxembourg and Metz area Mannheim and Ludwigshafen Shetland, Scotland Shetland Type of railway concentration* High Medium Low No data** Contextual information North-Western Europe * only relevant freight transport infrastructures have been considered ** no data can means no infrastructure or no infrastructure relevant for freight transportation Concentration de réseau ferroviaire* Railway region 20 Analytical atlas - Freight transport in North-Western Europe: regional dynamics, infrastructure and inter-regional exchanges - AURH - September 2014
- 21. Transport hubs: grid analysis method Bristol - Cardiff $ Km ®AURH - 2014/06 0 25 50 100 Data sources: Weastflows project, powered by AURH Newcastle and Durham Manchester - Liverpool - Leeds axis London area Seine Valley Belgium, Netherlands and Rhine basin Luxembourg and Metz area Rhine Valley Glasgow - Edinburgh axis Shannon, Limerick and Cork Portsmouth and Southampton terminals No data** infrastructure transportation infrastructures or level of Shetland, Scotland Shetland A geographical readout of the cumulated concentrations of port, railway and airport hubs highlights the regions of connection where the passage from one mode of transport to another could possibly be facilitated by the presence of infrastructures allowing load splitting. Eleven areas have been identified. The Netherlands, Belgium and the Northern part of the Rhine River Basin are the first sub-assembly, both in continuity and in regularity, highlighting a dense concentration. The Seine River Valley and Rhine River Valley make up two similar areas, which can be explained by the presence of two large rivers. The longitudinal breakdown of transport hubs highlights a predisposition to value a multimodal transport corridor, such as those found in the most Northern part of the United Kingdom: the Glasgow-Edinburgh axis and the Liverpool-Manchester-Leeds axis. It also must be noted that the Liverpool-Manchester-Leeds axis acts as an interface between the North and South of the country. The four remaining areas, (London, Portsmouth, Luxembourg and Shannon- Cork), are the most compact but not the least dense, which brings us back to our hub logic. The position of the Luxembourg-Metz area must also be highlighted, as it is used as a central subsystem, as is the Rhine River Valley. Type of node concentration* High No data** Contextual information North-Western Europe Concentration de noeuds* basée sur les ports et les terminaux ferroviaires Nodes region based on port nodes and railway terminals Medium Low * only relevant freight transport infrastructures have been considered ** no data can means no infrastructure or no infrastructure relevant for freight transportation Analytical atlas - Freight transport in North-Western Europe: regional dynamics, infrastructure and inter-regional exchanges - AURH - September 2014 21
- 22. The cross analysis of industrial densities and population densities shows: • in grey: the large European urban and industrial hubs, that are very dense and dynamic and are located near capital cities (Paris, Brussels, Amsterdam); • in pink: the large North-West European industrial basins: in England, Manchester and Birmingham and in Germany, Manheim, Frankfurt, Karlsruhe and the Ruhr River basin; • in purple: large population basins with little industry surrounding capital cities or large North-West European cities: the outskirts of Paris and the South of England; • in hachuring: peripheral regions with a strong disequilibrium between densities, especially in Western France and in the West of the Seine River Valley where industry, usually food-processing, is strong though the population is weak. The position of maritime entrance/exits allow us to relate industrial characteristics and population basins with dynamic exchanges of goods. Paris London Dublin Amsterdam Brussels Luxembourg Cross analysis of densities Km 0 25 50 100 Data source ©CorineLandCover 2006/AURH Boudaries ©MBR and EuroGeographics,©ESRI Map data © OpenStreetMap contributors, ODbl ®AURH -2013/06 Crossing of industrial density and population density The data crossing was made using an above average selection of industrial and population densities. The aim was to cross the two types of densities to highlight areas where there is a correlation / balance between the two densities and the areas where there is an over-representa-tion balance betwen industrial density of one over the other. highest level of population density lowest level of industrial density population > industry +++ ++ - ++ - lowest level of population density industry > population +++ Inbound/outbound of maritime freight Main entrance and exit way and population density highest level of industrial density Secondary entrance and exit way Contextual information North-Western Europe 22 Analytical atlas - Freight transport in North-Western Europe: regional dynamics, infrastructure and inter-regional exchanges - AURH - September 2014
- 23. Cross analysis of infrastructure concentrations The accumulation of strong infrastructures allows us to identify several regional hubs. The Benelux / Rhine River Basin area is the most concentrated. It is characterised by a strong continuity of multimodal networks, leading it to be seen as a very connected region with heavy flows. The Seine River Valley is one of the few regions, with Benelux and the Rhine River Basin, where modal changes could take place massively towards rivers and railways. The map however, highlights an insular region, poorly connected to the rest of Europe. In the United Kingdom, three regions show strong road/railway concentrations. The Greater London region is connected to the continent by the Channel Tunnel, thus creating continuity with Benelux and the Rhine River Basin. Glasgow-Edinburgh holds a peripheral position, whilst the Centre of the United Kingdom region holds a central place for the United Kingdom, though a secondary one at the North- Western European scale. Lastly, peripheral regions characterised by weak concentration have been identified: Western France, Ireland and the North of the United Kingdom. d’infrastructures* Shetland, Scotland Shetland $ Data sources: Weastflows project, Km ®AURH 0 25 50 100 powered by AURH - 2014/06 Centre of United Kingdom London area Seine Valley Benelux and Rhine basin Glasgow - Edinburgh axis Saône Valley concentrations noeuds routier, routier fluvial routier d’infrastructures transport transport pour cette n’y a pas d’infrastructure Infrastructure concentrations* from crossing the highest network and nodal concentrations Multimodal concentrations High concentration of ports and railway terminals High concentration of road, railway and inland waterway networks Bimodal concentrations High concentration of road and railway networks High concentration of railway and inland waterway networks Single mode concentrations High concentration of inland waterway networks High concentration of road networks Cumulated infrastructure concentrations Infrastructure region Contextual information North-Western Europe No data** * only relevant freight transport infrastructures have been considered ** no data can mean no infrastructures or no infrastructure relevant for freight transportation Analytical atlas - Freight transport in North-Western Europe: regional dynamics, infrastructure and inter-regional exchanges - AURH - September 2014 23
- 25. Part 2 Focus on each of the eleven remarkable areas in North-Western Europe
- 26. About quantitative and qualitative analysis Why use quantitative and qualitative analysis? Quantitative and qualitative analysis completes The Atlas of Major North-West European Freight Infrastructures which presented the state of the existing and upcoming freight transport network. It is based on a series of indicators that highlight: • strengths and weaknesses of the infrastructure network; • the potential the network has to be sustainable; • under-used potentials that could identify alternative routes instead of the traditional North/South routes. What geographical areas are concerned by this analysis? This analysis concerns eleven remarkable areas in North-Western Europe (NWE). They correspond to areas interesting Weastflows’ partners and highlight regions that are intense and/or strategic in the organisation of freight transport. For these reasons, some zones are not identified and thus are not included in a regional analysis (cf. map). What data was used? The analysis was carried out using data from the Geographical Information System built by AURH. Data included: road, railway and inland waterway networks, ferry routes, as well as remarkable hubs such as ports, railway terminals and airports. This basic data was then enriched with qualitative information such as population density, land use, port traffic, intermodality levels, projects of infrastructures and whether or not the network belonged to the strategic European network (TEN-T), thus allowing crossed analyses. How were the indicators defined? The indicators were defined through a dialogue with project partners in compliance with the following criteria: • their relevance in showing sustainability of the existing infrastructure network; • their capacity to ensure continuity with The Atlas of Major North-West European Freight Infrastructures; • the availability and accessibility of data in the Geographical Information System. What were the results? A series of 57 indicators was drawn up. With these indicators, the key characteristics of the remarkable regional infrastructure network in each area can be described. Each of these areas has a specific sheet including: • a table with all the associated indicators and data, • a map with the main transport infrastructures, • and a comment on the characteristics of the area, the infrastructure network, remarkable hubs as well as its strengths and weaknesses. The table below show in a synthetic manner the finality of the analysis and the type of indicators that correspond. A precise description of these indicators is presented pages 28 and 29. Category Goal of the analysis Indicators Regional characteristics Key regional characteristics 26 Analytical atlas - Freight transport in North-Western Europe: regional dynamics, infrastructure and inter-regional exchanges - AURH - September 2014 • Area • Number of inhabitants • Density • Land use • Maritime port traffic Networks (inland waterways, railways and roads) Accessibility and connection Continuities and discontinuities Size of infrastructures • Belonging to the central European network (TEN-T) • Network density • Electrification of railway network • Share of motorways or dual carriageways • ECMT classification (inland waterways) Hubs (Airports, ports, railway terminals) Accessibility and connection Intermodality • Level of intermodality • Proximity of strategic European networks (TEN-T) • Number of hubs registered in the central TEN-T core network • Ferry connections
- 27. Commentaires Remarkable regional areas NETHERLANDS Amsterdam NORWAY Oostende Brugge Dortmund Köln Karlsruhe Peterhead Londonderry Southampton Analytical atlas - Freight transport in North-Western Europe: regional dynamics, infrastructure and inter-regional exchanges - AURH - September 2014 27 l’Angleterre Main regions Ireland Shannon-Limerick Gateway Scotland Liverpool and the west coast Greater London and central England Southern England Southern Netherlands Benelux and Eastern France Western Germany Northern France Seine Gateway® Contextual information Main city or port city Capital North-Western Europe Km 0 25 50 100 Data source powered by AURH Boudaries ©MBR and EuroGeographics,©ESRI Map data © OpenStreetMap contributors, ODbl ®AURH -2013/06 Paris London Dublin Brussel Luxembourg Metz Caen Cork Mainz Rouen Brest Nancy Leeds Dover Perth Essen Nantes Calais Dieppe Galway Lorient Glasgow Belfast Cardiff Bristol Grimsby Mannheim Nüremberg Duisburg Plymouth Kirkwall Limerick Aberdeen Stuttgart Edinburgh Sheffield Waterford Tynemouth Lancaster Liverpool Rotterdam Strasbourg Hartlepool Birmingham Portsmouth Felixstowe Manchester Rosslare Cherbourg Saint-Nazaire Le Havre Dunkerque Lille Charleroi Namur Liège Dusseldorf Gent Antwerp IRELAND FRANCE GERMANY BELGIUM UNITED KINGDOM LUXEMBOURG DENMARK SWEDEN AUSTRIA ITALY UNITED KINGDOM SWITZERLAND Shetland, Scotland ShetSlahnedtland
- 28. Lists and descriptions of indicators 1 Indicator Description ID card Acreage Area Area of geographical right-of-way % of the region Share of the geographical zone as compared with the total in NWE Demography Number of inhabitants Number of inhabitants in the geographical area % of inhabitants Share of inhabitants in the geographical zone as compared with the total in NWE Population density Number of inhabitants per square kilometre Land use Urbanised land Total urbanised land including land used for industry and transport % of urbanised land Share of the urbanised land of the geographical zone as compared with the total in NWE, including land used for industry and transport Dedicated industrial land Total area of dedicated industrial land % of dedicated industrial land Share of the dedicated industrial land in the geographical zone as compared with the total in NWE Maritime traffic Maritime traffic Total maritime traffic in thousands of tonnes % of maritime traffic Share of the maritime traffic in the geographical zone as compared with the total in NWE Hubs Ports Ports Total number of ports (maritime ports and inland ports) Only main sites are considered % of ports Share of ports in the geographical zone as compared with the total in NWE Maritime ports Number of maritime ports Ferry ports Number of ports with ferry links Inland ports Number of inland ports Ports in the central TEN-T core network Number of maritime and inland ports in the central TEN-T core network Ports with a channel that is over 15 m deep Number of ports with a channel that is over 15 m deep Level of intermodality of ports Ports with over three modal connections Number of ports with over three modal connections (river, rail, road, pipeline) Ports with three modal connections Number of ports with three modal connections (river, rail, road) Ports with two modal connections Number of ports with two modal connections (rail and road) Proximity of ports to the central RTE-T network Proximity of the European road network Number of ports near a European level road network (central TEN-T core network) Proximity to a strategic network is calculated as being in a 10 km radius around the port Proximity of the European railway network Number of ports near a European level railway network (central TEN-T core network) Proximity to a strategic network is calculated as being in a 10 km radius around the port Proximity of the European inland waterway network Number of ports near a European level inland waterway network (central TEN-T core network) Proximity to a strategic network is calculated as being in a 10 km radius around the port Airports Airports Number of airports with freight traffic % of airports Share of airports in the geographical zone as compared with the total in NWE Airports in the central TEN-T core network Number of airports in the central TEN-T core network Level of intermodality of Airports Airports with a rail/road connection Number of airports with a rail/road connection 28 Analytical atlas - Freight transport in North-Western Europe: regional dynamics, infrastructure and inter-regional exchanges - AURH - September 2014
- 29. Indicator Description Analytical atlas - Freight transport in North-Western Europe: regional dynamics, infrastructure and inter-regional exchanges - AURH - September 2014 29 Hubs Proximity of airports to the central RTE-T network Proximity of the European road network Number of airports near a European level road network (central TEN-T core network) Proximity to a strategic network is calculated as being in a 20 km radius around the airport Proximity of the European railway network Number of airports near a European level railway network (central TEN-T core network) Proximity to a strategic network is calculated as being in a 20 km radius around the airport Proximity of the European inland waterway network Number of airports near a European level inland waterway network (central TEN-T core network) Proximity to a strategic network is calculated as being in a 20 km radius around the airport Proximity to a maritime port Number of airports near a maritime port Proximity to a maritime port is calculated as being in a 20 km radius around the airport Railway terminals Railway terminals Number of railway terminals Maritime and inland waterway ports with a railway terminal are taken into account % of railway terminals Number of railway terminals integrated into the central TEN-T core network Railway terminals in the central TEN-T core network Number of railway terminals integrated into the central TEN-T core network Level of intermodality of railway terminals Railway terminals with a sea/road connection Number of railway terminals connected to a maritime port and to the road network Railway terminals with an inland waterway/road connection Number of railway terminals connected to a river port and to the road network Railway terminals with a railway/road connection Number of railway terminals with a railway/road connection Proximity of railway terminals to the central RTE-T network Proximity of the European road network Number of railway terminals near a European level road network (central TEN-T core network) Proximity to a strategic network is calculated as being in a 20 km radius around a railway terminal Proximity of the European railway network Number of railway terminals near a European level railway network (central TEN-T core network) Proximity to a strategic network is calculated as being in a 20 km radius around a railway terminal Proximity of the European inland waterway network Number of railway terminals near a European level inland waterway network (central TEN-T core network) Proximity to a strategic network is calculated as being in a 20 km radius around a railway terminal Networks Inland waterway network Navigable length of network Total length in km of the inland waterway network % of navigable inland waterways Share of the inland waterway network in the geographical zone as compared with the total in NWE Density of navigable inland waterways Number of km of inland waterway network for a 1,000 km2 area % of navigable inland waterways with a large clearance (ECMT class equal or exceeding V) Share of inland waterway network with a ECMT classification exceeding or equalling V % of navigable inland waterways registered in the central TEN-T core network Share of navigable inland waterways registered in the central TEN-T core network Railway network Length of railway network Total length of railway network in km Unused railways are not taken into account % of railway network Share of the railway network in the geographical zone as compared with the total in NWE Density of the railway network Number of km of railway network for a 1,000 km2 area % of electrified railway network Share of electrified railway network % of railway network registered in the central TEN-T core network Share of railway network registered in the central TEN-T core network Road network Length of the road network Total length in km of the road network Only main roads that can be used to transport freight, are taken into account % of road network Share of the road network in the geographical zone as compared with the total in NWE Density of the road network Number of km of road network for a 1,000 km2 area % of motorways Share of motorways in the road network The motorway network corresponds to high-speed roads, including toll ways, that are accessed by a motorway junction % of dual carriageway network Share of the road network that is a dual carriageway or motorway The motorway network corresponds to high-speed roads, which are accessed by a motorway junction, but are not toll ways. The dual carriageway network corresponds to roads with 2 lanes, with no tolls and with no motorway junction. % of the road network registered in the central TEN-T core network Share of road network registered in the central TEN-T core network
- 30. Identity card Area Demography Land use Maritime traffic 69,884 km² corresponding to 4,076,557 inhabitants corresponding to 1,594 km² urbanised land corresponding to 2.5% of NWE 42,325 Mt corresponding to 8.6% of NWE 2.3% of NWE 183 km² dedicated to industry corresponding to 3.1% of NWE maritime traffic 58 inhabitants per km² 11.5% of urbanised land 2.1 Ireland Nodes Network P ort nodes: 18 corresponding to 7% of NWE Inland waterways: 0 km corresponding to 0% of NWE and to 0 km for 1,000 km² 18 seaports 4 ferry ports 0 % are CEMT Class V and over 0 inland port 0 % are part of main European network (part of the ʺTEN-T coreʺ network) 2 are major European ports (part of the ʺTEN-T coreʺ network) 2 have a channel depth of over 51 feet (15m) Railway network: 1,762 km corresponding to 4.5% of NWE and to 25,2 km for 1,000 km² Level of intermodality Proximity to strategic networks 7.9 % are electrified networks 0 port with more than 3 modes 3 ports are near the strategic road network 23.5 % are part of main European network (part of the ʺTEN-T coreʺ network) 6 ports with 3 modes 1 port is near the strategic rail network 12 ports with 2 modes 0 port is near the strategic inland Road network: 1,450 km corresponding to 10.6% of NWE and to 20,7 km for 1,000 km² waterway network 68 % are motorway 32 % are dual carriageways or freeways Railway terminals: 21 corresponding to 4.8% of NWE 42 % are part of main European network (part of the ʺTEN-T coreʺ network) 0 railway bi-modal terminal is major European terminal (part of the ʺTEN-T coreʺ network) Level of intermodality Proximity to strategic network 20 with rail/road connection link to a seaport 0 terminal is near the strategic road network 0 with rail/road connection link to an inland port 0 terminal is near the strategic rail network 1 railway bi-modal (rail/road) terminal 0 terminal is near the strategic inland waterway network Airport nodes: 8 corresponding to 8.7% of NWE 2 are major European airports (part of the ʺTEN-T coreʺ network) Level of intermodality Proximity to strategic networks 0 airport with rail/road connection 2 airports are near the strategic road network 2 airports are near the strategic rail network 0 airport is near the strategic inland waterway network Sources : The Atlas of Major North-West European Freight Infrastructures (Weastflows, AURH processing) 2 airports are near the maritime port 30 Analytical atlas - Freight transport in North-Western Europe: regional dynamics, infrastructure and inter-regional exchanges - AURH - September 2014
- 31. ! ! ! ! ! ! " ! Larne Galway Limerick Waterford Rosslare Harbour Londonderry Dublin Cork SShhaannnnoonn $0 10 20 40 Km Data source powered by AURH & ©Voies Navigables de France; ©European Commission, DG Move, TEN-Tec Information System; ©2012 National Geospatial Intelligence Agency ©OpenStreetMap contributors, ODbl;Boudaries ©MBR and EuroGeographics,©ESRI Map data ©OpenStreetMap contributors, ODbl/ ®AURH -2014/05 Key characteristics Located at the top of Western Europe, Ireland is characterised by population density and maritime traffic that are amongst the lowest in North-Western Europe. Networks The network of infrastructures is organised in a star shape from Dublin, the capital and largest city in the country. Only two types of transport are represented: road and railways. Network densities are amongst the weakest in North-Western Europe, approximately the same as in Scotland. Nevertheless, 42% of the road network is registered as a central European network which indicates that Ireland is well connected to the TEN-T network (only for this mode). The Irish railway network is poorly developed and the least electrified in North-Western Europe, with only 7.9%. Hubs Because it is an island, Ireland has a dense network of 18 maritime ports. Four of these ports have ferry connections; Three are registered in the TEN-T network and connected to the road network at a European level. However, only 1 of these ports is linked to the strategic railway network as identified by Europe. This is the Port of Dublin where the main railway terminal in this country is also located. Two ports have a channel that is over 15 m deep: Shannon and New Ross. This is a remarkable characteristic that Ireland shares only with the Southern part of the Netherlands. Weaknesses Ireland’s main shortcomings stem from the weakness of its road and railway networks. The railway network is poorly electrified and developed. There are discontinuities in the motorway network, in particular between Cork and Shannon and between Cork and Rosslare, showing a lack of connections between secondary urban centres. Strengths The proximity between ports and airports is the main strength in the Irish network as it facilitates connections between maritime and airport flows. This is the case in the ports of Dublin, Cork, and Shannon. These three ports have a European level. It must also be noted that container traffic could potentially be developed in the ports of Dublin, Waterford and Cork as well as short-distance maritime traffic, which would encourage modal changes. Analytical atlas - Freight transport in North-Western Europe: regional dynamics, infrastructure and inter-regional exchanges - AURH - September 2014 31
- 32. 2.2 Shannon-Limerick Gateway Identity card Area Demography Land use Maritime traffic 7,968 km² corresponding to 373,473 inhabitants corresponding to 146 km² urbanised land corresponding to 0.2% of NWE 9,134 Mt corresponding to 1.0% of NWE 0.2% of NWE 20 km² dedicated to industry corresponding to 0.7% of NWE maritime traffic 47 inhabitants per km² 32.2% of urbanised land Nodes Network P ort nodes: 1 corresponding to 0.4% of NWE Inland waterways: 0 km corresponding to 0% of NWE and to 0 km for 1,000 km² 1 seaport 0 ferry port 0 % are CEMT Class V and over 0 inland port 0 % are part of main European network (part of the ʺTEN-T coreʺ network) 1 is major European port (part of the ʺTEN-T coreʺ network) 1 have a channel depth of over 51 feet (15m) Railway network: 362 km corresponding to 0.9% of NWE and to 45,4 km for 1,000 km² Level of intermodality Proximity to strategic networks 26 % are electrified networks 0 port with more than 3 modes 1 port is near the strategic road network 50 % are part of main European network (part of the ʺTEN-T coreʺ network) 0 port with 3 modes 0 port is near the strategic rail network 1 port with 2 modes 0 port is near the strategic inland Road network: 384 km corresponding to 0.9% of NWE and to 48,2km for 1,000 km² waterway network 80 % are motorways 20 % are dual carriageways or freeways Railway terminals: 2 corresponding to 0.5% of NWE 69 % are part of main European network (part of the ʺTEN-T coreʺ network) 0 railway bi-modal terminal is major European terminal (part of the ʺTEN-T coreʺ network) Level of intermodality Proximity to strategic networks 1 with rail/road connection link to a seaport 0 terminal is near the strategic road network 0 with rail/road connection link to an inland port 0 terminal is near the strategic rail network 1 railway bi-modal (rail/road) terminal 0 terminal is near the strategic inland waterway network Airport nodes: 1 corresponding to 1.1% of NWE 0 is major European airport (part of the ʺTEN-T coreʺ network) Level of intermodality Proximity to strategic networks 1 airport with rail/road connections 1 airport is near the strategic road network 0 airport is near the strategic rail network 0 airport is near the strategic inland waterway network Sources : The Atlas of Major North-West European Freight Infrastructures (Weastflows, AURH processing) 1 airport is near the maritime port 32 Analytical atlas - Freight transport in North-Western Europe: regional dynamics, infrastructure and inter-regional exchanges - AURH - September 2014
- 33. ! ! ! Galway Limerick Cork Shannon $0 10 20 40 Km Data source powered by AURH & ©Voies Navigables de France; ©European Commission, DG Move, TEN-Tec Information System; ©2012 National Geospatial Intelligence Agency ©OpenStreetMap contributors, ODbl;Boudaries ©MBR and EuroGeographics,©ESRI Map data ©OpenStreetMap contributors, ODbl/ ®AURH -2014/05 Key characteristics Shannon-Limerick Gateway corresponds to a sub-assembly in Ireland located on the West, on the Atlantic coast. This zone has a weak population density and a strong share of industrial dedicated land, with 30% of urban space, which puts it at the top of the 11 geographical areas studied. Networks Railway network and road network densities in this part of the country are up to two times more than the national average. These two networks are well linked to the central TEN-T network: 50% of the railway network and 69% of the road network, which shows a good connection level, in spite of a secondary location. Hubs Shannon-Limerick Gateway has 1 major maritime port whose depth exceeds 15 m, Shannon Foynes*, and is a part of the central TEN-T network. This port is connected to a European level road network and linked to an airport that is thriving, though it is not registered in the TEN-T network. Nonetheless, this part of Ireland is lacking in multiple mode connections, in particular towards the railway mode. * It counts six terminals including the Limerick port terminal. Weaknesses This region suffers from a lack of connections, both by road and by rail with the South of Ireland (Cork, Waterford and Rosslare). The weak population density is a handicap, as the fewer the people, the fewer the needs in freight transport. The Shannon Airport is also not registered in the central European TEN-T network, though the gateway project is based on this. Strengths One of the main strengths in this region is the gateway project between the two cities Shannon and Limerick which aims to encourage port and airport development. With a channel depth of over 15 m, the nautical qualities of the Shannon Port are definitely an asset, especially so as its western position makes it the first deep-water port on the Atlantic coastline of North-Western Europe. The large share of industrial dedicated land is also an asset for the gateway project. Analytical atlas - Freight transport in North-Western Europe: regional dynamics, infrastructure and inter-regional exchanges - AURH - September 2014 33
- 34. 2.3 Scotland Identity card Area Demography Land use Maritime traffic 77,395 km² corresponding to 5,159,128 inhabitants corresponding to 2,067 km² urbanised land corresponding to 3.3% of NWE 30,295 Mt corresponding to 9.5% of NWE 2.9% of NWE 328 km² dedicated to industry corresponding to 2.2% of NWE maritime traffic 67 inhabitants per km² 15.8% of urbanised land Nodes Network P ort nodes: 35 corresponding to 13.6% of NWE Inland waterways: 0 km corresponding to 0% of NWE and to 0 km for 1,000 km² 35 seaports 9 ferry ports 0 % are CEMT Class V and over 0 inland port 0 % are part of main European network (part of the ʺTEN-T coreʺ network) 2 are major European ports (part of the ʺTEN-T coreʺ network) 1 have a channel depth of over 51 feet (15m) Railway network: 2,216 km corresponding to 5.6% of NWE and to 28,6 km for 1,000 km² Level of intermodality Proximity to strategic networks 20 % are electrified networks 0 port with more than 3 modes 3 ports are near the strategic road network 25 % are part of main European network (part of the ʺTEN-T coreʺ network) 7 ports with 3 modes 4 ports are near the strategic rail network 28 ports with 2 modes 0 port is near the strategic inland Road network: 1,042 km corresponding to 2.5% of NWE and to 13,4 km for 1,000 km² waterway network 39 % are motorways 61 % are dual carriageways or freeways Railway terminals: 52 corresponding to 11.9% of NWE 33 % are part of main European network (part of the ʺTEN-T coreʺ network) 0 railway bi-modal terminal is major European terminal (part of the ʺTEN-T coreʺ network) Level of intermodality Proximity to strategic networks 45 with rail/road connection link to a seaport 3 terminals are near the strategic road network 0 with rail/road connection link to an inland port 5 terminals are near the strategic rail network 7 railway bi-modal (rail/road) terminal 0 terminal is near the strategic inland waterway network Airport nodes: 14 corresponding to 15.2% of NWE 2 are major European airports (part of the ʺTEN-T coreʺ network) Level of intermodality Proximity to strategic networks 0 airport with rail/road connections 3 airports are near the strategic road network 3 airports are near the strategic rail network 0 airport is near the strategic inland waterway network Sources : The Atlas of Major North-West European Freight Infrastructures (Weastflows, AURH processing) 2 airports are near the maritime port 34 Analytical atlas - Freight transport in North-Western Europe: regional dynamics, infrastructure and inter-regional exchanges - AURH - September 2014
- 35. ! ! ! ! ! ! ! ! ! ! Larne Perth Glasgow Aberdeen Edinburgh Peterhead Tynemouth Hartlepool Belfast Kirkwall $0 10 20 40 Km Data source powered by AURH & ©Voies Navigables de France; ©European Commission, DG Move, TEN-Tec Information System; ©2012 National Geospatial Intelligence Agency ©OpenStreetMap contributors, ODbl;Boudaries ©MBR and EuroGeographics,©ESRI Map data ©OpenStreetMap contributors, ODbl/ ®AURH -2014/05 Key characteristics Scotland, like Ireland, is located in the Northern part of North-Western Europe, and has a weak population density. Its population and industrial density are concentrated in the Glasgow-Edinburgh axis and on the East coast. Networks As is the case for the population, road and railway infrastructure networks are located on the Glasgow-Edinburgh East/West axis. Its road and railway networks are among the weakest in North-Western Europe. A mere 20% of the railway network is electrified. Nevertheless, this network offers good connections toward the United Kingdom’s economic centres of London, Birmingham, Manchester and Leeds. Hubs As is the case with Ireland, because it is an island, Scotland has a strong port network with 35 ports identified. Many of them however, are small fishing ports or local ferry ports. Nine ports have European level ferry links. Scotland has a remarkable number of railway hubs, most of which are located in ports, which shows a potential for intermodality development in the railway mode. Glasgow and Edinburgh have the only port and airport infrastructures of the central European network. Weaknesses The network of infrastructures in the Northern part of the zone is the least developed. Consequently, it has not been identified in the TEN-T, even though there is heavy freight movement. For the railway network, Scotland suffers from capacity limited to the South of the United Kingdom, which impacts its connectivity with the rest of North-Western Europe. Lastly, in spite of a relatively large number of ports with ferry links, Scotland has very few connections of this type with other countries in the NWE zone. Strengths Strengths of the Scottish region include the existence of a relatively calm road network, as well as a large electrification programme on-going in strategic railway itineraries. There is a potential to expand short distance maritime links and encourage the development of intermodality both on railway and maritime modes. Analytical atlas - Freight transport in North-Western Europe: regional dynamics, infrastructure and inter-regional exchanges - AURH - September 2014 35
- 36. 2.4 Liverpool and the west coast Identity card Area Demography Land use Maritime traffic 14,180 km² corresponding to 6,886,010 inhabitants corresponding to 2,053 km² urbanised land corresponding to 9.1% of NWE 34,618 Mt corresponding to 1.7% of NWE 3.9% of NWE 277 km² dedicated to industry corresponding to 2.6% of NWE maritime traffic 486 inhabitants per km² 13% of urbanised land Nodes Network P ort nodes: 7 corresponding to 2.7% of NWE Inland waterways: 53 km corresponding to 0.5% of NWE and to 3,7 km for 1,000 km² 7 seaports 2 ferry ports 100 % are CEMT Class V and over 0 inland port 0 % are part of main European network (part of the ʺTEN-T coreʺ network) 1 is major European port (part of the ʺTEN-T coreʺ network) 0 have a channel depth of over 51 feet (15m) Railway network: 1 162 km corresponding to 3.0% of NWE and to 81,9 km for 1,000 km² Level of intermodality Proximity to strategic networks 39 % are electrified networks 0 port with more than 3 modes 1 port is near the strategic road network 40 % are part of main European network (part of the ʺTEN-T coreʺ network) 4 ports with 3 modes 2 ports are near the strategic rail network 3 ports with 2 modes 0 port is near the strategic inland Road network: 863 km corresponding to 2.0% of NWE and to 60,8 km for 1,000 km² waterway network 78 % are motorways 22 % are dual carriageways or freeways Railway terminals: 26 corresponding to 6.0% of NWE 49 % are part of main European network (part of the ʺTEN-T coreʺ network) 0 railway bi-modal terminal is major European terminals (part of the ʺTEN-T coreʺ network) Level of intermodality Proximity to strategic network 8 with rail/road connection link to a seaport 17 terminals are near the strategic road network 0 with rail/road connection link to an inland port 17 terminals are near the strategic rail network 18 railway bi-modal (rail/road) terminal 0 terminal is near the strategic inland waterway network Airport nodes: 4 corresponding to 4.3% of NWE 1 is major European airport (part of the ʺTEN-T coreʺ network) Level of intermodality Proximity to strategic networks 1 airport with rail/road connections 3 airports are near the strategic road network 3 airports are near the strategic rail network 0 airport is near the strategic inland waterway network Sources : The Atlas of Major North-West European Freight Infrastructures (Weastflows, AURH processing) 1 airport is near the maritime port 36 Analytical atlas - Freight transport in North-Western Europe: regional dynamics, infrastructure and inter-regional exchanges - AURH - September 2014
- 37. ! ! Bradford Leeds ! ! ! ! ! Sheffield Lancaster Fleetwood Liverpool Manchester $0 10 20 40 Km Data source powered by AURH & ©Voies Navigables de France; ©European Commission, DG Move, TEN-Tec Information System; ©2012 National Geospatial Intelligence Agency ©OpenStreetMap contributors, ODbl;Boudaries ©MBR and EuroGeographics,©ESRI Map data ©OpenStreetMap contributors, ODbl/ ®AURH -2014/05 Key characteristics Located on the North-Western coast of England, the Liverpool/Manchester region is one of the most densely populated and most industrialised regions in North-Western Europe. It, however, has relatively weak maritime traffic density. This sector is concerned by a gateway project. Networks The transport infrastructure network has all 3 modes of land transport: roads, railways and inland waterways. At the scale of the British Isles, this is a remarkable achievement. The largest part of the infrastructure network is concentrated on a West/East axis between Liverpool and Manchester. A major railway axis linking Scotland to the South of England also goes through this region. Railway network densities are relatively high nonetheless and paradoxically, only a small part of the network is electrified. Hubs Four out of the 7 identified ports propose a tri-modal connection. Nevertheless, only 2 of them are located near a European level railway and road network: Liverpool and Lancaster. The ports propose many ferry connections with Ireland. The many ferry terminals are located near road and railways in the central TEN-T network. Weaknesses As like Scotland, the infrastructure network is limited because of the railway network which requires heavy investments to increase its capacity. Moreover, the small number of itineraries that link Liverpool and Manchester to Birmingham and London, the other English economic hubs, leads to congestion, also hampering the development of this zone. Strengths The main asset of these region is its gateway project, which aims to encourage use of the inland waterway mode for freight transport using the Manchester Ship Canal, which is currently underused. This project is justified by the zone’s western location, linked to the presence of the very large Liverpool Port and a dense population. This region can also count on a dense railway network which well serves the other urban centres in the country, leading to a potential in the development of multi-modal transport for freight. Analytical atlas - Freight transport in North-Western Europe: regional dynamics, infrastructure and inter-regional exchanges - AURH - September 2014 37
- 38. 2.5 Greater London and central England Identity card Area Demography Land use Maritime traffic 31,666 km² corresponding to 21,342,074 inhabitants corresponding to 5,766 km² urbanised land corresponding to 0% of NWE 116,762 Mt corresponding to 3.9% of NWE 12.1% of NWE 619 km² dedicated to industry corresponding to 8.6% of NWE maritime traffic 674 inhabitants per km² 10% of urbanised land Nodes Network P ort nodes: 14 corresponding to 5.4% of NWE Inland waterways: 63,6 km corresponding to 0.6% of NWE and to 2,0 km for 1,000 km² 14 seaports 5 ferry ports 54.7 % are CEMT Class V and over 0 inland port 0 % are part of main European network (part of the ʺTEN-T coreʺ network) 3 are major European ports (part of the ʺTEN-T coreʺ network) 1 have a channel depth of over 51 feet (15m) Railway network: 3,893 km corresponding to 9.9% of NWE and to 122,9 km for 1,000 km² Level of intermodality Proximity to strategic networks 53 % are electrified networks 1 port with more than 3 modes 5 ports are near the strategic road network 32 % are part of main European network (part of the ʺTEN-T coreʺ network) 5 ports with 3 modes 7 ports are near the strategic rail network 8 ports with 2 modes 0 port is near the strategic inland Road network: 2,467 km corresponding to 5.8% of NWE and to 77,9 km for 1,000 km² waterway network 47 % are motorways 53 % are dual carriageways or freeways Railway terminals: 26 corresponding to 6.0% of NWE 40 % are part of main European network (part of the ʺTEN-T coreʺ network) 1 railway bi-modal terminal is major European terminal (part of the ʺTEN-T coreʺ network) Level of intermodality Proximity to strategic networks 9 with rail/road connection link to a seaport 5 terminals are near the strategic road network 0 with rail/road connection link to an inland port 8 terminals are near the strategic rail network 18 railway bi-modal (rail/road) terminal 0 terminal is near the strategic inland waterway network Airport nodes: 7 corresponding to 7.6% of NWE 5 are major European airports (part of the ʺTEN-T coreʺ network) Level of intermodality Proximity to strategic network 2 airports with rail/road connections 3 airports are near the strategic road network 3 airports are near the strategic rail network 0 airport is near the strategic inland waterway network Sources : The Atlas of Major North-West European Freight Infrastructures (Weastflows, AURH processing) 1 airport is near the maritime port 38 Analytical atlas - Freight transport in North-Western Europe: regional dynamics, infrastructure and inter-regional exchanges - AURH - September 2014
- 39. ! ! ! ! ! ! ! ! ! ! ! " Manchester ! ! ! ! Southampton ! ! ! Leeds Goole Barnet Ipswich Bristol Croydon Bradford Sheffield Birmingham Bournemouth Kingston upon Hull London Dover Newport Grimsby Liverpool Portsmouth $0 10 20 40 Km Data source powered by AURH & ©Voies Navigables de France; ©European Commission, DG Move, TEN-Tec Information System; ©2012 National Geospatial Intelligence Agency ©OpenStreetMap contributors, ODbl;Boudaries ©MBR and EuroGeographics,©ESRI Map data ©OpenStreetMap contributors, ODbl/ ®AURH -2014/05 Key characteristics Located in the South-Western part of the United Kingdom, this geographical area including Greater London and Central England up until Birmingham, is the country’s economic pulse. It concentrates the strongest population densities and comes in third place in North-Western Europe for maritime traffic. This region has an advanced gateway project: Thames Gateway. Networks Concerning transport infrastructures, this area is similar to that of Liverpool/Manchester in terms of density and characteristics of the network, with, for example, a navigable waterway. The Greater London and Central England railway network is nonetheless more compact and well developed, with over 50% of the network electrified. Hubs The Greater London and Central England region has a dense port network, with 14 ports, and 5 of them offer ferry links. Three ports are a part of the central TEN-T network: London, Felixtowe and Dover. These ports globally have a good level of intermodality with at least 3 types of modal connections. Five of the 7 regional airports are a part of the central TEN-T network. This is quite high as compared to other regions we have studied. One airport, the London City Airport, is located near a strategic port. There is also a European level railway terminal located in Birmingham. Weaknesses The main weakness this zone has stems from the longitudinal organisation of its infrastructure network on only one axis linking London to Manchester/Liverpool, which goes through Birmingham. Moreover, the road network seems to be less developed than that of other regions, with a mere 47% of motorways. Strengths This part of England is well connected to the continent by the English Channel, which helps mitigate the effects of insularity by offering a regional continuity with Europe, numerous ferry connections, in particular with France, Germany and the Netherlands. The Thames Gateway project is also an asset to promote intermodality. Analytical atlas - Freight transport in North-Western Europe: regional dynamics, infrastructure and inter-regional exchanges - AURH - September 2014 39
- 40. 2.6 Southern England Identity card Area Demography Land use Maritime traffic 9,623 km² corresponding to 4,527,877 inhabitants corresponding to 1,500 km² urbanised land corresponding to 2.4% of NWE 44,934 Mt corresponding to 1.2% of NWE 2.6% of NWE 83 km² dedicated to industry corresponding to 3.3% of NWE maritime traffic 471 inhabitants per km² 5.3% of urbanised land Nodes Network P ort nodes: 11 corresponding to 4.3% of NWE Inland waterways: 0 km corresponding to 0% of NWE and to 0 km for 1,000 km² 11 seaports 8 ferry ports 0 % are CEMT Class V and over 0 inland port 0 % are part of main European network (part of the ʺTEN-T coreʺ network) 2 are major European ports (part of the ʺTEN-T coreʺ network) 0 have a channel depth of over 51 feet (15m) Railway network: 794 km corresponding to 2.0% of NWE and to 82,4 km for 1,000 km² Level of intermodality Proximity to strategic networks 72 % are electrified networks 0 port with more than 3 modes 3 ports are near the strategic road network 10 % are part of main European network (part of the ʺTEN-T coreʺ network) 3 ports with 3 modes 1 port is near the strategic rail network 8 ports with 2 modes 0 port is near the strategic inland Road network: 707 km corresponding to 1.7% of NWE and to 73,4 km for 1,000 km² waterway network 32 % are motorways 68 % are dual carriageways or freeways Railway terminals: 10 corresponding to 2.3% of NWE 25 % are part of main European network (part of the ʺTEN-T coreʺ network) 0 railway bi-modal terminal is major European terminal (part of the ʺTEN-T coreʺ network) Level of intermodality Proximity to strategic networks 3 with rail/road connection link to a seaport 1 terminal is near the strategic road network 0 with rail/road connection link to an inland port 1 terminal is near the strategic rail network 1 railway bi-modal (rail/road) terminal 0 terminal is near the strategic inland waterway network Airport nodes: 3 corresponding to 3.3% of NWE 1 is major European airport (part of the ʺTEN-T coreʺ network) Level of intermodality Proximity to strategic networks 0 airport with rail/road connections 2 airports are near the strategic road network 2 airports are near the strategic rail network 0 airport is near the strategic inland waterway network Sources : The Atlas of Major North-West European Freight Infrastructures (Weastflows, AURH processing) 1 airport is near the maritime port 40 Analytical atlas - Freight transport in North-Western Europe: regional dynamics, infrastructure and inter-regional exchanges - AURH - September 2014
- 41. Barnet ! ! " ! Southampton ! ! London Croydon Bournemouth Portsmouth $0 10 20 40 Km Data source powered by AURH & ©Voies Navigables de France; ©European Commission, DG Move, TEN-Tec Information System; ©2012 National Geospatial Intelligence Agency ©OpenStreetMap contributors, ODbl;Boudaries ©MBR and EuroGeographics,©ESRI Map data ©OpenStreetMap contributors, ODbl/ ®AURH -2014/05 Key characteristics Southern England, which includes the Portsmouth and Southampton ports, is located on the English Channel. This region can be characterised as under-represented in dedicated industrial zones, though its population density is one of the highest in North-Western Europe. Networks Its road and railway infrastructure network is one of the densest in North-Western Europe. It is organised in a star shape coming to and from London, which must be crossed when traveling to the North of the country. They railway network, with a 71% electrification rate, is the most developed one in the United Kingdom. Nevertheless, a mere 10% of it is connected to the central European network (25% of the road network). Hubs As is the case in other regions in the United Kingdom and Ireland, Southern England has many ports and 11 of them have been identified. Eight of them offer ferry links only to France. The intermodality level of these ports however, remains limited. Thus, 3 of them offer a railway connection but only one of them, Southampton, belongs to the TEN-T network. Three airports have been identified and 2 of them are near a strategic railway network. Weaknesses The main weakness of this regional network concerns the poor integration of its infrastructure network into the central TEN-T network. Transport infrastructures, which all lead to London, are also a weakness, especially when traveling to the North of the country. Strengths Southern England has an interesting geostrategic position: near London, across from the Le Havre Port, one of the largest ports in North-Western Europe, and upstream from the Pas-de-Calais strait. This location allows it to play an important role in sourcing for the English capital, by developing in particular, short sea shipping. The railway network is well equipped and has a good potential for further development, especially as 3 ferry ports have a railway terminal: Portsmouth, Southampton and Newhaven. Analytical atlas - Freight transport in North-Western Europe: regional dynamics, infrastructure and inter-regional exchanges - AURH - September 2014 41
- 42. 2.7 Southern Netherlands Identity card Area Demography Land use Maritime traffic 26,899 km² corresponding to 14,776,966 inhabitants corresponding to 4,390 km² urbanised land corresponding to 6.9% of NWE 485,661 Mt corresponding to 3.3% of NWE 8.4% of NWE 672 km² dedicated to industry corresponding to 36.0% of NWE maritime traffic 549 inhabitants per km² 14.1% of urbanised land Nodes Network P ort nodes: 20 corresponding to 7.8% of NWE Inland waterways: 1,347 km corresponding to 12.0% of NWE and to 50,0 km for 1,000 km² 12 seaports 3 ferry ports 81 % are CEMT Class V and over 8 inland ports 75 % are part of main European network (part of the ʺTEN-T coreʺ network) 7 are major European ports (part of the ʺTEN-T coreʺ network) 2 have a channel depth of over 51 feet (15m) Railway network: 2,210 km corresponding to 5.6% of NWE and to 82,1 km for 1,000 km² Level of intermodality Proximity to strategic networks 83 % are electrified networks 2 ports with more than 3 modes 8 ports are near the strategic road network 42 % are part of main European network (part of the ʺTEN-T coreʺ network) 9 ports with 3 modes 7 ports are near the strategic rail network 9 ports with 2 modes 15 ports are near the strategic inland Road network: 2,208 km corresponding to 5.2% of NWE and to 82,0 km for 1,000 km² waterway network 99 % are motorways 1 % are dual carriageways or freeways Railway terminals: 25 corresponding to 5.7% of NWE 35 % are part of main European network (part of the ʺTEN-T coreʺ network) 0 railway bi-modal terminal is major European terminal (part of the ʺTEN-T coreʺ network) Level of intermodality Proximity to strategic network 14 with rail/road connection link to a seaport 2 terminals are near the strategic road network 9 with rail/road connection link to an inland port 1 terminal is near the strategic rail network 2 railway bi-modal (rail/road) terminal 0 terminal is near the strategic inland waterway network Airport nodes: 5 corresponding to 5.4% of NWE 2 are major European airports (part of the ʺTEN-T coreʺ network) Level of intermodality Proximity to strategic networks 2 airports with rail/road connections 4 airports are near the strategic road network 3 airports are near the strategic rail network 2 airports are near the strategic inland waterway network Sources : The Atlas of Major North-West European Freight Infrastructures (Weastflows, AURH processing) 1 airport is near the maritime port 42 Analytical atlas - Freight transport in North-Western Europe: regional dynamics, infrastructure and inter-regional exchanges - AURH - September 2014
- 43. Den Haag ! " ! ! Antwerpen ! ! ! ! " ! ! ! ! ! ! Essen Liège Essen Brussel Amsterdam Köln Gent Namur Duisburg Rotterdam Terneuzen Charleroi Düsseldorf $0 10 20 40 Km Data source powered by AURH & ©Voies Navigables de France; ©European Commission, DG Move, TEN-Tec Information System; ©2012 National Geospatial Intelligence Agency ©OpenStreetMap contributors, ODbl;Boudaries ©MBR and EuroGeographics,©ESRI Map data ©OpenStreetMap contributors, ODbl/ ®AURH -2014/05 Key characteristics The Southern part of the Netherlands has an extremely dense population and intense maritime traffic corresponding to one third of the total North-Western Europe traffic. Networks Consequently, the infrastructure network, including railways, roads and inland waterways is one of the densest and most developed in all of North-Western Europe. Some remarkable characteristics include: 81% of the inland waterway network is adapted for mass freight transport, with an ECMT class equal to or exceeding V; 75% of this network is a part of the TEN-T central network. Over 80% of the railway network is electrified and the road network adapted to freight transport is exclusively a motorway network. Hubs The Southern part of the Netherlands has 12 maritime ports and 8 inland waterway ports. A third of these ports are in the central TEN-T network and 2 maritime ports have channels that are over 15 m deep: Rotterdam and Amsterdam. The majority of these ports proposes advanced intermodality solutions. Two of them have over 3 types of modal connections: Amsterdam and Rotterdam. 9 of them have 3. Weaknesses The risk of congestion, due to the intensity of maritime traffic correlated with a very dense population, with ever increasing needs in travellers and freight mobility, are potential weaknesses. There is also little leeway for further development of existing infrastructures. Moreover, ports in this region are located downstream from the Pas-de-Calais strait, a high-risk sector for maritime traffic because of the intensity of its traffic volume. Strengths Because of its multimodal transport infrastructures which are the most developed in North-Western Europe, the Southern Netherlands is the most favourable and most operational region in North- Western Europe for the development of intermodality. This region benefits from efficient connections with all of North-Western Europe, including the United Kingdom, through intense short distance maritime links. Analytical atlas - Freight transport in North-Western Europe: regional dynamics, infrastructure and inter-regional exchanges - AURH - September 2014 43
- 44. 2.8 Benelux and Eastern France Identity card Area Demography Land use Maritime traffic 105,747 km² corresponding to 17,562,943 inhabitants corresponding to 9,768 km² urbanised land corresponding to 15.4% of NWE 198,783 Mt corresponding to 12.9% of NWE 10.0% of NWE 1,212 km² dedicated to industry corresponding to 14.7% of NWE maritime traffic 166 inhabitants per km² 12.4% of urbanised land Nodes Network P ort nodes: 21 corresponding to 8.1% of NWE Inland waterways: 3,966 km corresponding to 36.0% of NWE and to 37,5 km for 1,000 km² 3 seaports 2 ferry ports 39 % are CEMT Class V and over 18 inland ports 55 % are part of main European network (part of the ʺTEN-T coreʺ network) 11 are major European ports (part of the ʺTEN-T coreʺ network) 0 have a channel depth of over 51 feet (15m) Railway network: 7,019 km corresponding to 17.8% of NWE and to 66,3 km for 1,000 km² Level of intermodality Proximity to strategic networks 72 % are electrified networks 4 ports with more than 3 modes 17 ports are near the strategic road network 48 % are part of main European network (part of the ʺTEN-T coreʺ network) 17 ports with 3 modes 17 ports are near the strategic rail network 0 port with 2 modes 21 ports are near the strategic inland Road network: 4,503 km corresponding to 10.6% of NWE and to 45,5 km for 1,000 km² waterway network 82 % are motorways 17 % are dual carriageways or freeways Railway terminals: 40 corresponding to 9.2% of NWE 44 % are part of main European network (part of the ʺTEN-T coreʺ network) 1 railway bi-modal terminal is major European terminal (part of the ʺTEN-T coreʺ network) Level of intermodality Proximity to strategic networks 3 with rail/road connection link to a seaport 7 terminals are near the strategic road network 26 with rail/road connection link to an inland port 9 terminals are near the strategic rail network 11 railway bi-modal (rail/road) terminal 7 terminals are near the strategic inland waterway network Airport nodes: 9 corresponding to 9.8% of NWE 2 are major European airports (part of the ʺTEN-T coreʺ network) Level of intermodality Proximity to strategic network 3 airports with rail/road connections 9 airports are near the strategic road network 8 airports are near the strategic rail network 5 airports are near the strategic inland waterway network Sources : The Atlas of Major North-West European Freight Infrastructures (Weastflows, AURH processing) 2 airports are near the maritime port 44 Analytical atlas - Freight transport in North-Western Europe: regional dynamics, infrastructure and inter-regional exchanges - AURH - September 2014