SlideShare une entreprise Scribd logo
1  sur  7
Autofacts
R
For information regarding our
products and services please visit us at
www.autofacts.com
© 2013 PwC. All rights reserved. PwC refers to the PwC network and/or one or more of
its member firms, each of which is a separate legal entity. Please see
www.pwc.com/structure for further details. This content is for general information
purposes only, and should not be used as a substitute for consultation with professional
advisors.
October 2013
Growth in July and September helped the EU record the first positive quarter
in two years. With the UK making a disproportionate contribution and some
markets still falling, the situation remains finely balanced but Autofacts
believes this quarter has marked a turning point in the overall EU market.
EU: Green shoots growing?
Growth seen in the third quarter
European Market Review
EU+EFTA: Monthly car sales 2012-2013 (millions)
Source: European Automobile Manufacturers’ Association
(ACEA)
-40%
-20%
0%
20%
40%
0.0
0.5
1.0
1.5
2.0
Jan Feb Mar Apr May Jun Jul Aug Sep Oct Nov Dec
2012 2013 % Change 2013 vs 2012 (R-scale)
Market commentary
According to ACEA data and Autofacts estimates,
EU+EFTA new car registrations grew by 2.7%, or
75k units in the third quarter, marking the first
quarterly expansion in two years. This better than
anticipated result was due to growth of 5% in July
and an estimated 5.5% in September suggesting that
the market as a whole has indeed now bottomed out,
as anticipated previously. For the year-to-date, the
market has fallen by 4%, or 390k units, due largely
to the very heavy fall seen in the first quarter.
A key driver for the relatively strong September and
third quarter performance was the UK. September is
typically the second highest volume month in the
UK, due to the date change on registration plates.
However, owing to very strong growth of 12.1%, to
403,136 units, September was the strongest month
this year, thus accounting for 58% of the total
volume increase in the region. Nevertheless, the
belief that the bottom may now have passed is
supported by the Autofacts estimate that at least 18
of the 29 markets in the region achieved growth in
September, as was the case in July.
Two of the markets that have been hardest hit by the
crisis over the past few years have been Portugal and
Hungary and both are showing clear and consistent
signs of growth. Hungary has now grown for seven
consecutive months, and leapt by 32.4% in
September. Portugal has grown for four successive
months including a 15.9% increase in September.
Sweden also recorded its third month of growth in a
row with a pick up to 11.2% and Poland its fourth
consecutive month of growth. Indeed Poland, which
is the largest market amongst the newer members of
the EU, achieved 13.2% growth in the third quarter.
However, it is the top five markets that dominate
regional volumes. In September, the UK, France and
Spain achieved growth while a fall of just 1.2% in
Germany and 2.9% in Italy helped minimise the
negative impact. Germany remains something of a
conundrum given the economic and employment
situation, although demand weakness is partially
attributed to the national elections in September and
uncertainty over tax policy. Italy may remain weak
for some months yet due to a VAT increase in
October and continued political uncertainty.
70
80
90
100
110
120
Mar-11 Aug-11 Jan-12 Jun-12 Nov-12 Apr-13 Sep-13
EU-27 DE FR
IT UK ES
EU Top 5: Monthly Economic Sentiment (ECU)
Source: European Commission
Autofacts
R
For information regarding our
products and services please visit us at
www.autofacts.com
© 2013 PwC. All rights reserved. PwC refers to the PwC network and/or one or more of
its member firms, each of which is a separate legal entity. Please see
www.pwc.com/structure for further details. This content is for general information
purposes only, and should not be used as a substitute for consultation with professional
advisors.
Forecast
First half may have marked the bottom
A slightly stronger third quarter than forecast, results in a full year upward
revision although the fourth quarter could still see some negative results.
michael.x.gartside@de.pwc.com
Tel: +49(0)711250341104
Economic commentary and demand outlook
While it is too soon to see how the economy
performed in the third quarter, the second quarter
economic growth figures surprised most observers
with many markets including Germany and the UK
achieving better than expected results and also
showing France moving out of recession.
Clearly, the economic situation in most countries
remains challenging. But after the reasonably
positive second quarter, many forward looking
indicators suggest the economic picture could
continue to improve. If we take the Eurostat
Economic Sentiment Indicator (ESI) then these have
shown very strong growth within both the Eurozone
and the EU in recent months. A large increase in
September for the EU took the reading to 100.6,
above the long term average of 100 for the first time
since July 2011. Likewise, if we take the EU
Consumer Sentiment Indicator then again it has
improved significantly in recent months in most
economies. For the EU as a whole it stood at -11.7 in
September, above the long run average of -12.3.
Within the smaller Eurozone, it improved to -14.9
which is just below the long run average of -13.3 and
the highest level recorded since July 2011.
These improving sentiment indicators are supported
by Markit’s Purchasing Managers’ Index (PMI),
which suggested the recovery gathered pace through
the third quarter, with the index improving to a 27
month high of 52.2 in June. Markit also stated that
the jobs outlook was improving with the rate of jobs
losses easing to a very moderate pace.
In the previous European Market Review July 2013
issue, Autofacts reported improving sentiment and
PMI indicators and suggested these should start
translating into a better demand situation in the
third quarter and this did indeed happen. If we see a
repeat, with the relatively bullish third quarter
forward looking indicators translating into growing
demand in the fourth quarter then the year should
end on a positive note. However, Autofacts remains
cautious about the fourth quarter for a number of
reasons. Demand in France and the UK was
relatively strong in late 2012 making year-on-year
comparisons less favourable, especially given the
economic and fiscal headwinds faced by France. In
addition, the outlook for Italy remains challenging
also, given the VAT increase and continued political
uncertainty. Finally in Germany, where the market
remains stubbornly weak despite the positive
economic situation, it remains to be seen if there will
be a post election improvement in demand.
Nevertheless, with the Seasonally Adjusted Annual
Rate (SAAR) standing at 12.9m units in September,
the highest level since January 2012, and many of
the other EU markets now clearly returning to
growth, Autofacts has raised its full-year forecast for
2013 to 12.15m units, a 3% fall over 2012.
Conversely, Autofacts has slightly reduced its 2014
outlook, due to a more cautious outlook for France
and Italy, forecasting growth of around 3.5% to just
under 12.6m units. If the employment situation
improves more rapidly than currently assumed, this
could provide some upside potential.
Europe France / Germany / Italy / Spain / United Kingdom
EU+EFTA: new car SAAR & forecast (millions)
Source: PwC Autofacts Analysis
-2.5%
-1.5%
-0.5%
0.5%
1.5%
2.5%
EZ DE FR UK IT ES
2013 2014 15-19
EU Top 5: Economic outlook – GDP growth (%)
Source: PwC Economics (September 2013)
10
12
14
16
18
2007 2008 2009 2010 2011 2012 2013 2014 2015
SAAR Annual Sales Sales Forecast
Autofacts
R
For information regarding our
products and services please visit us at
www.autofacts.com
© 2013 PwC. All rights reserved. PwC refers to the PwC network and/or one or more of
its member firms, each of which is a separate legal entity. Please see
www.pwc.com/structure for further details. This content is for general information
purposes only, and should not be used as a substitute for consultation with professional
advisors.
Forecast
1.5
2
2.5
3
2007 2008 2009 2010 2011 2012 2013 2014 2015
SAAR Annual Sales Sales Forecast
France
A difficult start to 2013 mixed with a lack of visibility is holding back
consumers.
Source: Comité des Constructeurs Français d’Automobiles (CCFA)
-40%
-20%
0%
20%
40%
0
50
100
150
200
Jan Feb Mar Apr MayJun Jul AugSep Oct NovDec
2012 2013 % Change 2013 vs 2012 (R-scale)
France: Monthly car sales 2012-2013 (000s)
Market Commentary
CCFA data showed that new car registrations
dropped by 1.2% to 378,024 units in the third
quarter. This moderated the fall recorded since the
beginning of 2013 to -8.5%, 1,309,858 units,
although this was the lowest first nine month result
since 1997. With respective increase of 0.9% and
3.4% in comparison to 2012, July and September
suggest the French market may be bottoming out,
although year-on-year declines in the fourth
quarter are likely given the strong fourth quarter of
2012. In addition, several elements must be
highlighted. September was boosted by an extra
selling day. The positive results are also partly
explained by the high level of “tactical sales”
(demonstration cars, rentals, etc.) and in
September these sales amounted to more than 17%
of the 142,211 units. The numerous product
launches from the French carmakers in the second
and third quarter also help to explain the slightly
more positive situation.
France: new car SAAR & forecast (millions)
Source: PwC Autofacts Analysis
France: Sentiment and Confidence Indicator
The third quarter showed improvement of the overall
French economic sentiment. The industry and
consumer confidence indicators improved
respectively by more than 4.5 and 7 points compared
to the previous quarter. But France is the only major
EU economy to experience a deterioration in
economic sentiment since Autumn last year, when
the low point was reached in most economies. Plus,
for the second quarter in a row, its indicators are
lower than the ones of Spain or Italy. However,
contrary to statistical data, some polls show that
individuals and companies are feeling that the French
economic situation is not improving. The reforms
that have been introduced, including the new tax
increases and reductions of state subsidies, are not
seen to meet the structural problems of the country.
It doesn’t offer them clear visibility for the future,
which is weighing on consumer sentiment. To add to
that, the prospect of an increase in the VAT could
constrain economic growth prospects.
The third quarter SAAR, at 1.76m, was the highest
quarterly result this year. While Autofacts forecasts a
further improvement in the SAAR in the final
quarter, given the relatively strong fourth quarter in
2012, this still equates to a falling market on a year-
on-year comparison basis. For the year as a whole
Autofacts maintains its forecast at 1.75m units, a
7.9% fall over 2012. Due to the challenging economic
situation and increased tax burden, Autofacts sees
little prospect for a strong recovery in France in 2014
and forecast growth of just 2.9% to 1.8m units.
Europe France / Germany / Italy / Spain / United Kingdom
josselin.chabert@fr.pwc.com
Tel: +33(0)156577158
-40
-30
-20
-10
0
10
20
70
80
90
100
110
120
Mar-11Jul-11Nov-11Mar-12Jul-12Nov-12Mar-13Jul-13
FR Economic Sentiment Industry (R-scale)
Consumer (R-scale)
Source: European Commission (September 2013)
Autofacts
R
For information regarding our
products and services please visit us at
www.autofacts.com
© 2013 PwC. All rights reserved. PwC refers to the PwC network and/or one or more of
its member firms, each of which is a separate legal entity. Please see
www.pwc.com/structure for further details. This content is for general information
purposes only, and should not be used as a substitute for consultation with professional
advisors.
Forecast
Germany: new car SAAR & forecast (millions)
Germany
Despite weak demand in the first three quarters, strong economic sentiment
combined with certainty over future tax policies in Q4 could turn the market
Source: Kraftfahrt-Bundesamt (KBA)
-40%
-20%
0%
20%
40%
0
100
200
300
400
Jan Feb Mar Apr MayJun Jul AugSep Oct NovDec
2012 2013 % Change 2013 vs 2012 (R-scale)
Germany: Monthly car sales 2012-2013 (000s)
Market Commentary
In September new car sales in Germany fell by 1.2%
to 247,199 units according to KBA data. This
resulted in a market contraction of 6.0% to 2.22m
units for the first three quarters of 2013. While this
is a weak result, the fall in new car registrations at
least slowed when looking at the market evolution
by quarter. The decrease in new car sales in the first
quarter by 12.9% followed by a fall of 3.7% in the
second quarter can be partly explained by the
strong first half of the German market in 2012.
Thus, the 1.4% fall from July to September could
mark the end of the market’s contraction. While
new car demand weakened in Germany, economic
sentiment increased markedly over the last year,
reaching a 17-month high in September according
to the European Commission. The German market
research institute GfK even forecasts that consumer
confidence will hit its highest level in six years
heading into October. Source: PwC Autofacts Analysis
Germany: Sentiment and Confidence Indicator
-20
-10
0
10
20
80
90
100
110
120
Mar-11Jul-11Nov-11Mar-12Jul-12Nov-12Mar-13Jul-13
DE Economic Sentiment Industry (R-scale)
Consumer (R-scale)
Although Germany’s unemployment rate rose to
6.9% in September, it remained close to its lowest
level since reunification more than two decades ago.
Driven by the stable labor market and historically low
interest rates, German consumers, who traditionally
tend to save, became more willing to spend in
September than at any point since December 2006.
Given the weak demand for new cars but the strong
willingness to buy, the question remains why the
positive consumer sentiment is not reflected in
vehicle demand. One possible explanation can be
found in a political rather than an economic issue.
Although Angela Merkel's conservative party recently
won the national elections, a coalition partner has to
be found after falling just short of a parliamentary
majority. While Merkel unequivocally rejected tax
hikes in the election campaign, it is thought that she
is likely to seek a grand coalition with the Social
Democrats (SPD) who had campaigned on a platform
of tax increases for Germany's highest earners.
Therefore, it is possible that some consumers fear
tax hikes and thus defer purchases until future tax
policies become certain. Despite a low SAAR of
2.91m units in September, given the said factors,
Autofacts forecast a recovery in the SAAR by fourth
quarter. This results in an expected overall decline of
3.6% to 2.98m units for the German market in 2013.
Further, given the current average age of the German
car fleet is now at a record high of 8.7 years, pent-up
demand is building, which is expected to enhance
demand in the mid-term, contributing to a return to
growth in 2014 with a 2.4% increase to 3.05m units.
2.5
3
3.5
4
4.5
2007 2008 2009 2010 2011 2012 2013 2014 2015
SAAR Annual Sales Sales Forecast
Europe France / Germany / Italy / Spain / United Kingdom
Keisuke.Kusaba@de.pwc.com
Tel: +49(0)711250341457Source: European Commission (September 2013)
Autofacts
R
For information regarding our
products and services please visit us at
www.autofacts.com
© 2013 PwC. All rights reserved. PwC refers to the PwC network and/or one or more of
its member firms, each of which is a separate legal entity. Please see
www.pwc.com/structure for further details. This content is for general information
purposes only, and should not be used as a substitute for consultation with professional
advisors.
Forecast
Italy
Despite some positive economic developments, Italy faces a number of
challenges which could undermine recovery hopes over the short-term.
Source: Ministero delle Infrastrutture e Trasporto (MIT), ISTAT
-40%
-20%
0%
20%
40%
0
50
100
150
200
Jan Feb Mar Apr MayJun Jul AugSep Oct NovDec
2012 2013 % Change 2013 vs 2012 (R-scale)
Italy: Monthly car sales 2012-2013 (000s)
Market Commentary
A lot has been said regarding a potential market
recovery, which would benefit the whole value
chain, but in relation to Italy signs remain elusive.
The whole local automotive value chain has been in
survival mode for over three years and, as a
confirmation of this downward trend, July closed
with 107,848 units, a fall of 1.6 % year-on-year,
August with 52,997 units, a decline of 6.6 % year-
on-year, and September posted 106,363 units, a fall
of 2.9 % year-on-year. For the year-to-date,
registrations fell by 8.34% to 1,000,032 units.
Viewed against 2007 pre-crisis volumes, the
contraction is even worse at -48%. Weak market
performance is partially due to heavy fiscal
pressures recently introduced from the Italian
government negatively impacting the purchase of
new vehicles. These include duties, taxes and high
maintenance costs, with the tax element on fuel
now equating to 58.4% of the price.
Italy: new car SAAR & forecast (millions)
Source: PwC Autofacts Analysis
Italy: Sentiment and Confidence Indicator
-60
-40
-20
0
60
80
100
120
Mar-11Jul-11Nov-11Mar-12Jul-12Nov-12Mar-13Jul-13
IT Economic Sentiment Industry (R-scale)
Consumer (R-scale)
Further negative influences come in the form of the
convergence of political instability and increased
VAT, boosted from 21% to 22%, which may further
weaken the already depressed demand for vehicles.
As a consequence, the Italian automotive market is
going through a transition which, on one side,
alternative fuel vehicles achieved 15.2% year-to-date
of penetration and, on the other side, a progressive
switch toward smaller size segments is taking place
(A segment went from 18.8% in 2012 to 19.1 in 2013
and MINI SUV’s from 2.6% to 4.2%).
Some hope may be taken from Italian National
Institute of Statistics’ (ISTAT) consumer confidence
index posting an improved attitude toward the
purchase of durable goods (turning from 97.4 to
98.3). In addition, the Italian dealer network
displayed a positive sentiment for the coming quarter
in combination with a higher flow of visitors,
according to Centro Studi Promotor (CSP).
Despite these potential positive developments,
downside risks in the form of the current macro-
economic landscape and increased tax burden,
appear stronger and demand is expected to remain
underperforming. As a result, Autofacts has
marginally downgraded its full-year forecast for Italy
to 1.28m units, an 8.8% decline on 2012.
1
1.5
2
2.5
3
2007 2008 2009 2010 2011 2012 2013 2014 2015
SAAR Annual Sales Sales Forecast
Europe France / Germany / Italy / Spain / United Kingdom
giorgio.elefante@it.pwc.com
Tel: +390280646325Source: European Commission (September 2013)
Autofacts
R
For information regarding our
products and services please visit us at
www.autofacts.com
© 2013 PwC. All rights reserved. PwC refers to the PwC network and/or one or more of
its member firms, each of which is a separate legal entity. Please see
www.pwc.com/structure for further details. This content is for general information
purposes only, and should not be used as a substitute for consultation with professional
advisors.
Forecast
Spain
The extension, again, of Spain’s PIVE incentive plan continues to support the
market at a 700k unit level.
Source: Association of Spanish Automobile Manufacturers
(ANFAC)
-40%
-20%
0%
20%
40%
0
25
50
75
100
Jan Feb Mar Apr MayJun Jul AugSep Oct NovDec
2012 2013 % Change 2013 vs 2012 (R-scale)
Spain: Monthly car sales 2012-2013 (000s)
Market Commentary
In September, new car registrations in Spain rose
by 28.5% to 45,175 units according to ANFAC.
Strong year-on-year growth was virtually inevitable
given the very weak September 2012 as a result of
the VAT increase at the start of that month. In
addition, an extra selling day further helped as did
the extension of the PIVE scrappage scheme with
PIVE3. This growth helped the market record a
decline of just 1.6% in the first nine months to
546,435 units. Not surprising, given the plan PIVE
scrappage schemes, it is private buyers that are
supporting the market at this low level, with a
69.4% leap in registration in September to 28,695
units. For the year-to-date, volumes were up by
10.5% to 283,347 units. Conversely, sales to
companies remain weak, with a 10.9% fall in
September to just 14,737 units while for the year-to-
date they have fallen by 20.4% to 138,636 units.
Spain: new car SAAR & forecast (millions)
Source: PwC Autofacts Analysis
Spain: Sentiment and Confidence Indicator
-60
-40
-20
0
80
90
100
110
Mar-11Jul-11Nov-11Mar-12Jul-12Nov-12Mar-13Jul-13
ES Economic Sentiment Industry (R-scale)
Consumer (R-scale)
With the holiday season coming to an end,
September is inevitably a small month for rental
sales, although the 1,743 units did represent a 4.3%
year-on-year increase. For the year-to-date, rental
companies have bought 124,450 cars, a 0.4% increase
on 2012.
While Spain remains in recession, and continues to
suffer from extremely high unemployment and faces
significant challenges, the dramatic improvements
seen in sentiment over the past year may point
towards an improving situation over the next six
months. Consumer sentiment has improved from -40
in December to -17.5, only slightly below the average
of -14.5 since 1990. Likewise, economic sentiment
has improved consistently over the past year, but
gained strength in recent months. Less positive was
the second monthly decline in the Markit Purchasing
Managers’ Index (PMI), although it still stood well
above levels seen over the previous 24 months.
The Spanish SAAR has been remarkably stable this
year and stood at 720k units in September. As a
result, Autofacts maintains its forecast for 700k units
for the full-year. For 2014, one of the biggest
concerns now is the impact of a withdrawal of the
government scrappage incentive. So far, each PIVE
scheme has been relatively small so the improving
economic fundamentals may offset any negative
influence from scrappage withdrawal. Therefore, on
balance, Autofacts forecast a marginal increase in
Spanish demand to 710k units in 2014.
0.5
1
1.5
2
2007 2008 2009 2010 2011 2012 2013 2014 2015
SAAR Annual Sales Sales Forecast
Europe France / Germany / Italy / Spain / United Kingdom
Source: European Commission (September 2013)
michael.x.gartside@de.pwc.com
Tel: +49(0)711250341104
Autofacts
R
For information regarding our
products and services please visit us at
www.autofacts.com
© 2013 PwC. All rights reserved. PwC refers to the PwC network and/or one or more of
its member firms, each of which is a separate legal entity. Please see
www.pwc.com/structure for further details. This content is for general information
purposes only, and should not be used as a substitute for consultation with professional
advisors.
Forecast
United Kingdom
Registrations in September were the highest since March 2008, with an
improving economy increasingly supporting the growth being seen.
Source: Society of Motor Manufacturers and Traders (SMMT)
-40%
-20%
0%
20%
40%
0
100
200
300
400
Jan Feb Mar Apr MayJun Jul AugSep Oct NovDec
2012 2013 % Change 2013 vs 2012 (R-scale)
UK: Monthly car sales 2012-2013 (000s)
Market Commentary
According to SMMT data, the UK market
experienced an extremely strong September, with
registrations up by 12.1% to 403,176 units. This was
the highest monthly result since March 2008 and
contributed to third quarter growth of 12.2% to
631,301 units, the highest third quarter result since
2007. For the year-to-date, registrations grew by
10.8% to 1,794,924 units. Private consumers
continue to drive the market with registrations up
by 17.9% in September and 16.7% for the year-to-
date. As a result, private share of the market in
September, at 51.8%, was the highest since March
2010 and for the year-to-date, at 48.4%, the highest
since 2009. Part of this boom in private demand is
being driven by the widespread cash payments
made in compensation for mis-sold payment
protection insurance (PPI). With around £8bn paid
out in 2012 and a greater amount expected this
year, these windfall cash payments are providing a
large cash boost to UK consumers.
UK: new car SAAR & forecast (millions)
Source: PwC Autofacts Analysis
UK: Sentiment and Confidence Indicator
-30
-20
-10
0
10
20
70
80
90
100
110
120
Mar-11Jul-11Nov-11Mar-12Jul-12Nov-12Mar-13Jul-13
UK Economic Sentiment Industry (R-scale)
Consumer (R-scale)
However, while this cash windfall has no doubt
helped the UK market, the company car sector is also
showing stronger growth as the year progresses. At
the mid-year point, company car registrations were
just 4.3% up, but by the nine month point they had
grown by 8.5%. While strong incentives and key new
models are helping the market, it appears that
economic fundamentals are increasingly playing their
part. Second quarter economic output was stronger
than anticipated and unemployment is now starting
to fall. In addition, dramatic increases have been seen
in the consumer and economic sentiment indicators
over the past few months which support the positive
picture. Consumer sentiment leapt from -17.5 in May
to -1.0 in September, well ahead of the average of -10
since 1990. Likewise, economic sentiment stood at
115.4, well above the 100 average and just below the
peak level of 116.5. These suggest that demand
should remain strong in the coming months.
The SAAR stood at 2.38m in September, the highest
level since the scrappage scheme boosted the market
in late 2009. Given the extremely strong September,
the dramatic improvement in sentiment and
stronger economic position, Autofacts has raised its
full-year forecast for the UK to 2.22m units some
8.6% higher than 2012. However, with the impact of
the PPI compensation likely to diminish next year,
and economic growth likely to remain below its long
run average, we do not see demand continuing to
grow at these exalted levels and forecast moderate
growth of 2.2% to 2.27m into 2014.
Europe France / Germany / Italy / Spain / United Kingdom
michael.x.gartside@de.pwc.com
Tel: +49(0)711250341104Source: European Commission (September 2013)
1.5
2.0
2.5
3.0
2007 2008 2009 2010 2011 2012 2013 2014 2015
SAAR Annual Sales Sales Forecast

Contenu connexe

Tendances

Before the Open March 24 2017
Before the Open March 24 2017Before the Open March 24 2017
Before the Open March 24 2017John Pendrith
 
US lead the M&A surge, but confidence hits European dealmakers
US lead the M&A surge, but confidence hits European dealmakersUS lead the M&A surge, but confidence hits European dealmakers
US lead the M&A surge, but confidence hits European dealmakersDeloitte UK
 
Deloitte State of the State 2015
Deloitte State of the State 2015Deloitte State of the State 2015
Deloitte State of the State 2015Deloitte UK
 
Feb MarketMonitor
Feb MarketMonitor Feb MarketMonitor
Feb MarketMonitor jspeltz
 
Klöckner & Co - German Investment Seminar 2011
Klöckner & Co - German Investment Seminar 2011Klöckner & Co - German Investment Seminar 2011
Klöckner & Co - German Investment Seminar 2011Klöckner & Co SE
 
Presentation to the Causeway Chamber of Commerce
Presentation to the Causeway Chamber of CommercePresentation to the Causeway Chamber of Commerce
Presentation to the Causeway Chamber of CommerceRichard Ramsey
 
Klöckner & Co - German Corporate Conference 2011
Klöckner & Co - German Corporate Conference 2011Klöckner & Co - German Corporate Conference 2011
Klöckner & Co - German Corporate Conference 2011Klöckner & Co SE
 
AT&S Half-Year Financial Report H1 2016/17
AT&S Half-Year Financial Report H1 2016/17AT&S Half-Year Financial Report H1 2016/17
AT&S Half-Year Financial Report H1 2016/17AT&S_IR
 
The Deloitte M &A Index Q4 2015 infographic
The Deloitte M &A Index Q4 2015 infographicThe Deloitte M &A Index Q4 2015 infographic
The Deloitte M &A Index Q4 2015 infographicDeloitte UK
 
Before the open march 6 2017
Before the open march 6 2017Before the open march 6 2017
Before the open march 6 2017John Pendrith
 
2014.10 ethenea-market-commentary-ethna-aktiv-e
2014.10 ethenea-market-commentary-ethna-aktiv-e2014.10 ethenea-market-commentary-ethna-aktiv-e
2014.10 ethenea-market-commentary-ethna-aktiv-eFrank Ragol
 
Before the Open May 5 2017
Before the Open May 5 2017Before the Open May 5 2017
Before the Open May 5 2017John Pendrith
 
The Deloitte Consumer Tracker Q1 2017
The Deloitte Consumer Tracker Q1 2017The Deloitte Consumer Tracker Q1 2017
The Deloitte Consumer Tracker Q1 2017Deloitte UK
 
Before the Open March 8 2017
Before the Open March 8 2017Before the Open March 8 2017
Before the Open March 8 2017John Pendrith
 
GT - Automotive Messenger UK - October 2012
GT - Automotive Messenger UK - October 2012GT - Automotive Messenger UK - October 2012
GT - Automotive Messenger UK - October 2012Grant Thornton
 
COFACE Panorama Encuesta de Pagos Marruecos Sept16 EN
COFACE Panorama Encuesta de Pagos Marruecos Sept16 ENCOFACE Panorama Encuesta de Pagos Marruecos Sept16 EN
COFACE Panorama Encuesta de Pagos Marruecos Sept16 ENJaime Cubillo Fleming
 
Before the Open April 21 2017
Before the Open April 21 2017Before the Open April 21 2017
Before the Open April 21 2017John Pendrith
 
Before the open March 7 2017
Before the open March 7 2017Before the open March 7 2017
Before the open March 7 2017John Pendrith
 
AIM Italia market update 2Q 2017
AIM Italia market update 2Q 2017AIM Italia market update 2Q 2017
AIM Italia market update 2Q 2017Giovanni Tommasi
 
Before the Open May 3 2017
Before the Open May 3 2017Before the Open May 3 2017
Before the Open May 3 2017John Pendrith
 

Tendances (20)

Before the Open March 24 2017
Before the Open March 24 2017Before the Open March 24 2017
Before the Open March 24 2017
 
US lead the M&A surge, but confidence hits European dealmakers
US lead the M&A surge, but confidence hits European dealmakersUS lead the M&A surge, but confidence hits European dealmakers
US lead the M&A surge, but confidence hits European dealmakers
 
Deloitte State of the State 2015
Deloitte State of the State 2015Deloitte State of the State 2015
Deloitte State of the State 2015
 
Feb MarketMonitor
Feb MarketMonitor Feb MarketMonitor
Feb MarketMonitor
 
Klöckner & Co - German Investment Seminar 2011
Klöckner & Co - German Investment Seminar 2011Klöckner & Co - German Investment Seminar 2011
Klöckner & Co - German Investment Seminar 2011
 
Presentation to the Causeway Chamber of Commerce
Presentation to the Causeway Chamber of CommercePresentation to the Causeway Chamber of Commerce
Presentation to the Causeway Chamber of Commerce
 
Klöckner & Co - German Corporate Conference 2011
Klöckner & Co - German Corporate Conference 2011Klöckner & Co - German Corporate Conference 2011
Klöckner & Co - German Corporate Conference 2011
 
AT&S Half-Year Financial Report H1 2016/17
AT&S Half-Year Financial Report H1 2016/17AT&S Half-Year Financial Report H1 2016/17
AT&S Half-Year Financial Report H1 2016/17
 
The Deloitte M &A Index Q4 2015 infographic
The Deloitte M &A Index Q4 2015 infographicThe Deloitte M &A Index Q4 2015 infographic
The Deloitte M &A Index Q4 2015 infographic
 
Before the open march 6 2017
Before the open march 6 2017Before the open march 6 2017
Before the open march 6 2017
 
2014.10 ethenea-market-commentary-ethna-aktiv-e
2014.10 ethenea-market-commentary-ethna-aktiv-e2014.10 ethenea-market-commentary-ethna-aktiv-e
2014.10 ethenea-market-commentary-ethna-aktiv-e
 
Before the Open May 5 2017
Before the Open May 5 2017Before the Open May 5 2017
Before the Open May 5 2017
 
The Deloitte Consumer Tracker Q1 2017
The Deloitte Consumer Tracker Q1 2017The Deloitte Consumer Tracker Q1 2017
The Deloitte Consumer Tracker Q1 2017
 
Before the Open March 8 2017
Before the Open March 8 2017Before the Open March 8 2017
Before the Open March 8 2017
 
GT - Automotive Messenger UK - October 2012
GT - Automotive Messenger UK - October 2012GT - Automotive Messenger UK - October 2012
GT - Automotive Messenger UK - October 2012
 
COFACE Panorama Encuesta de Pagos Marruecos Sept16 EN
COFACE Panorama Encuesta de Pagos Marruecos Sept16 ENCOFACE Panorama Encuesta de Pagos Marruecos Sept16 EN
COFACE Panorama Encuesta de Pagos Marruecos Sept16 EN
 
Before the Open April 21 2017
Before the Open April 21 2017Before the Open April 21 2017
Before the Open April 21 2017
 
Before the open March 7 2017
Before the open March 7 2017Before the open March 7 2017
Before the open March 7 2017
 
AIM Italia market update 2Q 2017
AIM Italia market update 2Q 2017AIM Italia market update 2Q 2017
AIM Italia market update 2Q 2017
 
Before the Open May 3 2017
Before the Open May 3 2017Before the Open May 3 2017
Before the Open May 3 2017
 

En vedette

Etude PwC Autofacts production automobile (fév. 2014)
Etude PwC Autofacts production automobile (fév. 2014)Etude PwC Autofacts production automobile (fév. 2014)
Etude PwC Autofacts production automobile (fév. 2014)PwC France
 
Etude IPO Watch Europe T3 2012
Etude IPO Watch Europe T3 2012Etude IPO Watch Europe T3 2012
Etude IPO Watch Europe T3 2012PwC France
 
Etude PwC sur les IPO transfrontalières (2012)
Etude PwC sur les IPO transfrontalières (2012)Etude PwC sur les IPO transfrontalières (2012)
Etude PwC sur les IPO transfrontalières (2012)PwC France
 
Etude PwC sur les priorités des dirigeants de l'industrie pharmaceutique (2013)
Etude PwC sur les priorités des dirigeants de l'industrie pharmaceutique (2013)Etude PwC sur les priorités des dirigeants de l'industrie pharmaceutique (2013)
Etude PwC sur les priorités des dirigeants de l'industrie pharmaceutique (2013)PwC France
 
Etude PwC sur les fusions-acquisitions en Chine (2013)
Etude PwC sur les fusions-acquisitions en Chine (2013)Etude PwC sur les fusions-acquisitions en Chine (2013)
Etude PwC sur les fusions-acquisitions en Chine (2013)PwC France
 
Etude PwC sur l'immobilier commercial européen (2012)
Etude PwC sur l'immobilier commercial européen (2012)Etude PwC sur l'immobilier commercial européen (2012)
Etude PwC sur l'immobilier commercial européen (2012)PwC France
 
Etude IPO Watch Q4 2012
Etude IPO Watch Q4 2012Etude IPO Watch Q4 2012
Etude IPO Watch Q4 2012PwC France
 
Etude PwC sur les transactions sur les portefeuilles de créances (nov. 2014)
Etude PwC sur les transactions sur les portefeuilles de créances (nov. 2014)Etude PwC sur les transactions sur les portefeuilles de créances (nov. 2014)
Etude PwC sur les transactions sur les portefeuilles de créances (nov. 2014)PwC France
 

En vedette (8)

Etude PwC Autofacts production automobile (fév. 2014)
Etude PwC Autofacts production automobile (fév. 2014)Etude PwC Autofacts production automobile (fév. 2014)
Etude PwC Autofacts production automobile (fév. 2014)
 
Etude IPO Watch Europe T3 2012
Etude IPO Watch Europe T3 2012Etude IPO Watch Europe T3 2012
Etude IPO Watch Europe T3 2012
 
Etude PwC sur les IPO transfrontalières (2012)
Etude PwC sur les IPO transfrontalières (2012)Etude PwC sur les IPO transfrontalières (2012)
Etude PwC sur les IPO transfrontalières (2012)
 
Etude PwC sur les priorités des dirigeants de l'industrie pharmaceutique (2013)
Etude PwC sur les priorités des dirigeants de l'industrie pharmaceutique (2013)Etude PwC sur les priorités des dirigeants de l'industrie pharmaceutique (2013)
Etude PwC sur les priorités des dirigeants de l'industrie pharmaceutique (2013)
 
Etude PwC sur les fusions-acquisitions en Chine (2013)
Etude PwC sur les fusions-acquisitions en Chine (2013)Etude PwC sur les fusions-acquisitions en Chine (2013)
Etude PwC sur les fusions-acquisitions en Chine (2013)
 
Etude PwC sur l'immobilier commercial européen (2012)
Etude PwC sur l'immobilier commercial européen (2012)Etude PwC sur l'immobilier commercial européen (2012)
Etude PwC sur l'immobilier commercial européen (2012)
 
Etude IPO Watch Q4 2012
Etude IPO Watch Q4 2012Etude IPO Watch Q4 2012
Etude IPO Watch Q4 2012
 
Etude PwC sur les transactions sur les portefeuilles de créances (nov. 2014)
Etude PwC sur les transactions sur les portefeuilles de créances (nov. 2014)Etude PwC sur les transactions sur les portefeuilles de créances (nov. 2014)
Etude PwC sur les transactions sur les portefeuilles de créances (nov. 2014)
 

Similaire à Etude PwC marché automobile européen Q3 (2013)

Etude PwC marché automobile mondial (2013)
Etude PwC marché automobile mondial (2013)Etude PwC marché automobile mondial (2013)
Etude PwC marché automobile mondial (2013)PwC France
 
Economic Indicators August 2013
Economic Indicators August 2013Economic Indicators August 2013
Economic Indicators August 2013SappiHouston
 
Economic Indicators September 2013
Economic Indicators September 2013Economic Indicators September 2013
Economic Indicators September 2013SappiHouston
 
Economic Indicators October 2013
Economic Indicators October 2013Economic Indicators October 2013
Economic Indicators October 2013SappiHouston
 
Encuesta sobre acceso a la financiación de las pequeñas y medianas empresas e...
Encuesta sobre acceso a la financiación de las pequeñas y medianas empresas e...Encuesta sobre acceso a la financiación de las pequeñas y medianas empresas e...
Encuesta sobre acceso a la financiación de las pequeñas y medianas empresas e...Círculo de Empresarios
 
Economic indicators november 2013
Economic indicators november 2013Economic indicators november 2013
Economic indicators november 2013SappiHouston
 
CGA - WE car market - May update
CGA - WE car market - May updateCGA - WE car market - May update
CGA - WE car market - May updateSabine Blumel
 
Economic Indicators June 2013
Economic Indicators June 2013Economic Indicators June 2013
Economic Indicators June 2013SappiHouston
 
Economic indicators may 2013
Economic indicators may 2013Economic indicators may 2013
Economic indicators may 2013SappiHouston
 
UK-comp-tracker-August-2013-F-3
UK-comp-tracker-August-2013-F-3UK-comp-tracker-August-2013-F-3
UK-comp-tracker-August-2013-F-3Angus Rea
 
Macroeconomic Developments Report. July 2013
Macroeconomic Developments Report. July 2013Macroeconomic Developments Report. July 2013
Macroeconomic Developments Report. July 2013Latvijas Banka
 
Economic Indicators December 2013
Economic Indicators December 2013Economic Indicators December 2013
Economic Indicators December 2013SappiHouston
 
Arthur D.Little - Global Automotive Report June_2019
Arthur D.Little - Global Automotive Report June_2019Arthur D.Little - Global Automotive Report June_2019
Arthur D.Little - Global Automotive Report June_2019Fabrizio Arena
 
Financial Markets Review (October 2014)
Financial Markets Review (October 2014)Financial Markets Review (October 2014)
Financial Markets Review (October 2014)Snam
 
Etude PwC IPO Watch 2013-2014 (mars 2014)
Etude PwC IPO Watch 2013-2014 (mars 2014)Etude PwC IPO Watch 2013-2014 (mars 2014)
Etude PwC IPO Watch 2013-2014 (mars 2014)PwC France
 
Economic indicators october
Economic indicators octoberEconomic indicators october
Economic indicators octoberSappiHouston
 
CGA - WE car market - June update
CGA - WE car market - June updateCGA - WE car market - June update
CGA - WE car market - June updateSabine Blumel
 

Similaire à Etude PwC marché automobile européen Q3 (2013) (20)

Etude PwC marché automobile mondial (2013)
Etude PwC marché automobile mondial (2013)Etude PwC marché automobile mondial (2013)
Etude PwC marché automobile mondial (2013)
 
Teles 2014 Q3 Interim Report English
Teles 2014 Q3 Interim Report EnglishTeles 2014 Q3 Interim Report English
Teles 2014 Q3 Interim Report English
 
Economic Indicators August 2013
Economic Indicators August 2013Economic Indicators August 2013
Economic Indicators August 2013
 
Economic Indicators September 2013
Economic Indicators September 2013Economic Indicators September 2013
Economic Indicators September 2013
 
Economic Indicators October 2013
Economic Indicators October 2013Economic Indicators October 2013
Economic Indicators October 2013
 
Poland: dynamism at the heart of Europe (IBR 2014)
Poland: dynamism at the heart of Europe (IBR 2014)Poland: dynamism at the heart of Europe (IBR 2014)
Poland: dynamism at the heart of Europe (IBR 2014)
 
Encuesta sobre acceso a la financiación de las pequeñas y medianas empresas e...
Encuesta sobre acceso a la financiación de las pequeñas y medianas empresas e...Encuesta sobre acceso a la financiación de las pequeñas y medianas empresas e...
Encuesta sobre acceso a la financiación de las pequeñas y medianas empresas e...
 
Economic indicators november 2013
Economic indicators november 2013Economic indicators november 2013
Economic indicators november 2013
 
CGA - WE car market - May update
CGA - WE car market - May updateCGA - WE car market - May update
CGA - WE car market - May update
 
Economic Indicators June 2013
Economic Indicators June 2013Economic Indicators June 2013
Economic Indicators June 2013
 
Economic indicators may 2013
Economic indicators may 2013Economic indicators may 2013
Economic indicators may 2013
 
The future of Europe (IBR 2014)
The future of Europe (IBR 2014)The future of Europe (IBR 2014)
The future of Europe (IBR 2014)
 
UK-comp-tracker-August-2013-F-3
UK-comp-tracker-August-2013-F-3UK-comp-tracker-August-2013-F-3
UK-comp-tracker-August-2013-F-3
 
Macroeconomic Developments Report. July 2013
Macroeconomic Developments Report. July 2013Macroeconomic Developments Report. July 2013
Macroeconomic Developments Report. July 2013
 
Economic Indicators December 2013
Economic Indicators December 2013Economic Indicators December 2013
Economic Indicators December 2013
 
Arthur D.Little - Global Automotive Report June_2019
Arthur D.Little - Global Automotive Report June_2019Arthur D.Little - Global Automotive Report June_2019
Arthur D.Little - Global Automotive Report June_2019
 
Financial Markets Review (October 2014)
Financial Markets Review (October 2014)Financial Markets Review (October 2014)
Financial Markets Review (October 2014)
 
Etude PwC IPO Watch 2013-2014 (mars 2014)
Etude PwC IPO Watch 2013-2014 (mars 2014)Etude PwC IPO Watch 2013-2014 (mars 2014)
Etude PwC IPO Watch 2013-2014 (mars 2014)
 
Economic indicators october
Economic indicators octoberEconomic indicators october
Economic indicators october
 
CGA - WE car market - June update
CGA - WE car market - June updateCGA - WE car market - June update
CGA - WE car market - June update
 

Plus de PwC France

Etude PwC "20ème édition de la CEO Survey" - Janvier 2017
Etude PwC "20ème édition de la CEO Survey" - Janvier 2017Etude PwC "20ème édition de la CEO Survey" - Janvier 2017
Etude PwC "20ème édition de la CEO Survey" - Janvier 2017PwC France
 
Etude PwC "Carbon Factor" (nov. 2015)
Etude PwC "Carbon Factor" (nov. 2015)Etude PwC "Carbon Factor" (nov. 2015)
Etude PwC "Carbon Factor" (nov. 2015)PwC France
 
Etude PwC : La transition énergétique pour la croissance verte (nov 2015)
Etude PwC : La transition énergétique pour la croissance verte (nov 2015)Etude PwC : La transition énergétique pour la croissance verte (nov 2015)
Etude PwC : La transition énergétique pour la croissance verte (nov 2015)PwC France
 
Etude PwC "Total Retail 2015" Sur quoi miser aujourd’hui pour réenchanter la ...
Etude PwC "Total Retail 2015" Sur quoi miser aujourd’hui pour réenchanter la ...Etude PwC "Total Retail 2015" Sur quoi miser aujourd’hui pour réenchanter la ...
Etude PwC "Total Retail 2015" Sur quoi miser aujourd’hui pour réenchanter la ...PwC France
 
GEMO 2016 : un digital de plus en plus cannibale ?
GEMO 2016  : un digital de plus en plus cannibale ?GEMO 2016  : un digital de plus en plus cannibale ?
GEMO 2016 : un digital de plus en plus cannibale ?PwC France
 
Infographie PwC GEMO 2016 sur l'industrie Médias et Loisirs (juin 2015)
Infographie PwC GEMO 2016 sur l'industrie Médias et Loisirs (juin 2015)Infographie PwC GEMO 2016 sur l'industrie Médias et Loisirs (juin 2015)
Infographie PwC GEMO 2016 sur l'industrie Médias et Loisirs (juin 2015)PwC France
 
Etude PwC Low Carbon Economy Index (oct. 2015)
Etude PwC Low Carbon Economy Index (oct. 2015)Etude PwC Low Carbon Economy Index (oct. 2015)
Etude PwC Low Carbon Economy Index (oct. 2015)PwC France
 
Etude FCD, ESSEC et PwC sur la distribution responsable (août 2015)
Etude FCD, ESSEC et PwC sur la distribution responsable (août 2015)Etude FCD, ESSEC et PwC sur la distribution responsable (août 2015)
Etude FCD, ESSEC et PwC sur la distribution responsable (août 2015)PwC France
 
Etude PwC IPO Watch
Etude PwC IPO WatchEtude PwC IPO Watch
Etude PwC IPO WatchPwC France
 
Etude PwC CEO Survey Talent "People Strategy for the Digital Age" (juillet 2015)
Etude PwC CEO Survey Talent "People Strategy for the Digital Age" (juillet 2015)Etude PwC CEO Survey Talent "People Strategy for the Digital Age" (juillet 2015)
Etude PwC CEO Survey Talent "People Strategy for the Digital Age" (juillet 2015)PwC France
 
Etude PwC Golden Age Index (juin 2015)
Etude PwC Golden Age Index (juin 2015)Etude PwC Golden Age Index (juin 2015)
Etude PwC Golden Age Index (juin 2015)PwC France
 
Etude PwC Global Economy Watch (juin 2015)
Etude PwC Global Economy Watch (juin 2015)Etude PwC Global Economy Watch (juin 2015)
Etude PwC Global Economy Watch (juin 2015)PwC France
 
Etude PwC et Essec "Grande consommation 1985 - 2015 - 2045"
Etude PwC et Essec "Grande consommation 1985 - 2015 - 2045"Etude PwC et Essec "Grande consommation 1985 - 2015 - 2045"
Etude PwC et Essec "Grande consommation 1985 - 2015 - 2045"PwC France
 
Etude PwC sur le Top 100 des entreprises les mieux valorisées au monde en 201...
Etude PwC sur le Top 100 des entreprises les mieux valorisées au monde en 201...Etude PwC sur le Top 100 des entreprises les mieux valorisées au monde en 201...
Etude PwC sur le Top 100 des entreprises les mieux valorisées au monde en 201...PwC France
 
Etude PwC "Point of View: Enterprise Portfolio & Program Management" (mai 2015)
Etude PwC "Point of View: Enterprise Portfolio & Program Management" (mai 2015)Etude PwC "Point of View: Enterprise Portfolio & Program Management" (mai 2015)
Etude PwC "Point of View: Enterprise Portfolio & Program Management" (mai 2015)PwC France
 
Etude PwC "Bridging the gap" sur les investisseurs institutionnels (mai 2015)
Etude PwC "Bridging the gap" sur les investisseurs institutionnels (mai 2015)Etude PwC "Bridging the gap" sur les investisseurs institutionnels (mai 2015)
Etude PwC "Bridging the gap" sur les investisseurs institutionnels (mai 2015)PwC France
 
Etude PwC, AFDEL et SNJV sur "Les 100 digital"
Etude PwC, AFDEL et SNJV sur "Les 100 digital"Etude PwC, AFDEL et SNJV sur "Les 100 digital"
Etude PwC, AFDEL et SNJV sur "Les 100 digital"PwC France
 
Etude PwC Global Economy Watch (mai 2015)
Etude PwC Global Economy Watch (mai 2015)Etude PwC Global Economy Watch (mai 2015)
Etude PwC Global Economy Watch (mai 2015)PwC France
 
Etude PwC sur l'économie collaborative (mai 2015)
Etude PwC sur l'économie collaborative (mai 2015)Etude PwC sur l'économie collaborative (mai 2015)
Etude PwC sur l'économie collaborative (mai 2015)PwC France
 
Etude PwC sur l'intérêt des investisseurs pour l’Afrique (avril 2015)
Etude PwC sur l'intérêt des investisseurs pour l’Afrique (avril 2015)Etude PwC sur l'intérêt des investisseurs pour l’Afrique (avril 2015)
Etude PwC sur l'intérêt des investisseurs pour l’Afrique (avril 2015)PwC France
 

Plus de PwC France (20)

Etude PwC "20ème édition de la CEO Survey" - Janvier 2017
Etude PwC "20ème édition de la CEO Survey" - Janvier 2017Etude PwC "20ème édition de la CEO Survey" - Janvier 2017
Etude PwC "20ème édition de la CEO Survey" - Janvier 2017
 
Etude PwC "Carbon Factor" (nov. 2015)
Etude PwC "Carbon Factor" (nov. 2015)Etude PwC "Carbon Factor" (nov. 2015)
Etude PwC "Carbon Factor" (nov. 2015)
 
Etude PwC : La transition énergétique pour la croissance verte (nov 2015)
Etude PwC : La transition énergétique pour la croissance verte (nov 2015)Etude PwC : La transition énergétique pour la croissance verte (nov 2015)
Etude PwC : La transition énergétique pour la croissance verte (nov 2015)
 
Etude PwC "Total Retail 2015" Sur quoi miser aujourd’hui pour réenchanter la ...
Etude PwC "Total Retail 2015" Sur quoi miser aujourd’hui pour réenchanter la ...Etude PwC "Total Retail 2015" Sur quoi miser aujourd’hui pour réenchanter la ...
Etude PwC "Total Retail 2015" Sur quoi miser aujourd’hui pour réenchanter la ...
 
GEMO 2016 : un digital de plus en plus cannibale ?
GEMO 2016  : un digital de plus en plus cannibale ?GEMO 2016  : un digital de plus en plus cannibale ?
GEMO 2016 : un digital de plus en plus cannibale ?
 
Infographie PwC GEMO 2016 sur l'industrie Médias et Loisirs (juin 2015)
Infographie PwC GEMO 2016 sur l'industrie Médias et Loisirs (juin 2015)Infographie PwC GEMO 2016 sur l'industrie Médias et Loisirs (juin 2015)
Infographie PwC GEMO 2016 sur l'industrie Médias et Loisirs (juin 2015)
 
Etude PwC Low Carbon Economy Index (oct. 2015)
Etude PwC Low Carbon Economy Index (oct. 2015)Etude PwC Low Carbon Economy Index (oct. 2015)
Etude PwC Low Carbon Economy Index (oct. 2015)
 
Etude FCD, ESSEC et PwC sur la distribution responsable (août 2015)
Etude FCD, ESSEC et PwC sur la distribution responsable (août 2015)Etude FCD, ESSEC et PwC sur la distribution responsable (août 2015)
Etude FCD, ESSEC et PwC sur la distribution responsable (août 2015)
 
Etude PwC IPO Watch
Etude PwC IPO WatchEtude PwC IPO Watch
Etude PwC IPO Watch
 
Etude PwC CEO Survey Talent "People Strategy for the Digital Age" (juillet 2015)
Etude PwC CEO Survey Talent "People Strategy for the Digital Age" (juillet 2015)Etude PwC CEO Survey Talent "People Strategy for the Digital Age" (juillet 2015)
Etude PwC CEO Survey Talent "People Strategy for the Digital Age" (juillet 2015)
 
Etude PwC Golden Age Index (juin 2015)
Etude PwC Golden Age Index (juin 2015)Etude PwC Golden Age Index (juin 2015)
Etude PwC Golden Age Index (juin 2015)
 
Etude PwC Global Economy Watch (juin 2015)
Etude PwC Global Economy Watch (juin 2015)Etude PwC Global Economy Watch (juin 2015)
Etude PwC Global Economy Watch (juin 2015)
 
Etude PwC et Essec "Grande consommation 1985 - 2015 - 2045"
Etude PwC et Essec "Grande consommation 1985 - 2015 - 2045"Etude PwC et Essec "Grande consommation 1985 - 2015 - 2045"
Etude PwC et Essec "Grande consommation 1985 - 2015 - 2045"
 
Etude PwC sur le Top 100 des entreprises les mieux valorisées au monde en 201...
Etude PwC sur le Top 100 des entreprises les mieux valorisées au monde en 201...Etude PwC sur le Top 100 des entreprises les mieux valorisées au monde en 201...
Etude PwC sur le Top 100 des entreprises les mieux valorisées au monde en 201...
 
Etude PwC "Point of View: Enterprise Portfolio & Program Management" (mai 2015)
Etude PwC "Point of View: Enterprise Portfolio & Program Management" (mai 2015)Etude PwC "Point of View: Enterprise Portfolio & Program Management" (mai 2015)
Etude PwC "Point of View: Enterprise Portfolio & Program Management" (mai 2015)
 
Etude PwC "Bridging the gap" sur les investisseurs institutionnels (mai 2015)
Etude PwC "Bridging the gap" sur les investisseurs institutionnels (mai 2015)Etude PwC "Bridging the gap" sur les investisseurs institutionnels (mai 2015)
Etude PwC "Bridging the gap" sur les investisseurs institutionnels (mai 2015)
 
Etude PwC, AFDEL et SNJV sur "Les 100 digital"
Etude PwC, AFDEL et SNJV sur "Les 100 digital"Etude PwC, AFDEL et SNJV sur "Les 100 digital"
Etude PwC, AFDEL et SNJV sur "Les 100 digital"
 
Etude PwC Global Economy Watch (mai 2015)
Etude PwC Global Economy Watch (mai 2015)Etude PwC Global Economy Watch (mai 2015)
Etude PwC Global Economy Watch (mai 2015)
 
Etude PwC sur l'économie collaborative (mai 2015)
Etude PwC sur l'économie collaborative (mai 2015)Etude PwC sur l'économie collaborative (mai 2015)
Etude PwC sur l'économie collaborative (mai 2015)
 
Etude PwC sur l'intérêt des investisseurs pour l’Afrique (avril 2015)
Etude PwC sur l'intérêt des investisseurs pour l’Afrique (avril 2015)Etude PwC sur l'intérêt des investisseurs pour l’Afrique (avril 2015)
Etude PwC sur l'intérêt des investisseurs pour l’Afrique (avril 2015)
 

Dernier

Strategies for Unlocking Knowledge Management in Microsoft 365 in the Copilot...
Strategies for Unlocking Knowledge Management in Microsoft 365 in the Copilot...Strategies for Unlocking Knowledge Management in Microsoft 365 in the Copilot...
Strategies for Unlocking Knowledge Management in Microsoft 365 in the Copilot...Drew Madelung
 
The 7 Things I Know About Cyber Security After 25 Years | April 2024
The 7 Things I Know About Cyber Security After 25 Years | April 2024The 7 Things I Know About Cyber Security After 25 Years | April 2024
The 7 Things I Know About Cyber Security After 25 Years | April 2024Rafal Los
 
Bajaj Allianz Life Insurance Company - Insurer Innovation Award 2024
Bajaj Allianz Life Insurance Company - Insurer Innovation Award 2024Bajaj Allianz Life Insurance Company - Insurer Innovation Award 2024
Bajaj Allianz Life Insurance Company - Insurer Innovation Award 2024The Digital Insurer
 
CNv6 Instructor Chapter 6 Quality of Service
CNv6 Instructor Chapter 6 Quality of ServiceCNv6 Instructor Chapter 6 Quality of Service
CNv6 Instructor Chapter 6 Quality of Servicegiselly40
 
Boost PC performance: How more available memory can improve productivity
Boost PC performance: How more available memory can improve productivityBoost PC performance: How more available memory can improve productivity
Boost PC performance: How more available memory can improve productivityPrincipled Technologies
 
08448380779 Call Girls In Friends Colony Women Seeking Men
08448380779 Call Girls In Friends Colony Women Seeking Men08448380779 Call Girls In Friends Colony Women Seeking Men
08448380779 Call Girls In Friends Colony Women Seeking MenDelhi Call girls
 
Understanding Discord NSFW Servers A Guide for Responsible Users.pdf
Understanding Discord NSFW Servers A Guide for Responsible Users.pdfUnderstanding Discord NSFW Servers A Guide for Responsible Users.pdf
Understanding Discord NSFW Servers A Guide for Responsible Users.pdfUK Journal
 
Presentation on how to chat with PDF using ChatGPT code interpreter
Presentation on how to chat with PDF using ChatGPT code interpreterPresentation on how to chat with PDF using ChatGPT code interpreter
Presentation on how to chat with PDF using ChatGPT code interpreternaman860154
 
🐬 The future of MySQL is Postgres 🐘
🐬  The future of MySQL is Postgres   🐘🐬  The future of MySQL is Postgres   🐘
🐬 The future of MySQL is Postgres 🐘RTylerCroy
 
GenCyber Cyber Security Day Presentation
GenCyber Cyber Security Day PresentationGenCyber Cyber Security Day Presentation
GenCyber Cyber Security Day PresentationMichael W. Hawkins
 
Tata AIG General Insurance Company - Insurer Innovation Award 2024
Tata AIG General Insurance Company - Insurer Innovation Award 2024Tata AIG General Insurance Company - Insurer Innovation Award 2024
Tata AIG General Insurance Company - Insurer Innovation Award 2024The Digital Insurer
 
How to Troubleshoot Apps for the Modern Connected Worker
How to Troubleshoot Apps for the Modern Connected WorkerHow to Troubleshoot Apps for the Modern Connected Worker
How to Troubleshoot Apps for the Modern Connected WorkerThousandEyes
 
EIS-Webinar-Prompt-Knowledge-Eng-2024-04-08.pptx
EIS-Webinar-Prompt-Knowledge-Eng-2024-04-08.pptxEIS-Webinar-Prompt-Knowledge-Eng-2024-04-08.pptx
EIS-Webinar-Prompt-Knowledge-Eng-2024-04-08.pptxEarley Information Science
 
A Domino Admins Adventures (Engage 2024)
A Domino Admins Adventures (Engage 2024)A Domino Admins Adventures (Engage 2024)
A Domino Admins Adventures (Engage 2024)Gabriella Davis
 
Boost Fertility New Invention Ups Success Rates.pdf
Boost Fertility New Invention Ups Success Rates.pdfBoost Fertility New Invention Ups Success Rates.pdf
Boost Fertility New Invention Ups Success Rates.pdfsudhanshuwaghmare1
 
08448380779 Call Girls In Civil Lines Women Seeking Men
08448380779 Call Girls In Civil Lines Women Seeking Men08448380779 Call Girls In Civil Lines Women Seeking Men
08448380779 Call Girls In Civil Lines Women Seeking MenDelhi Call girls
 
Driving Behavioral Change for Information Management through Data-Driven Gree...
Driving Behavioral Change for Information Management through Data-Driven Gree...Driving Behavioral Change for Information Management through Data-Driven Gree...
Driving Behavioral Change for Information Management through Data-Driven Gree...Enterprise Knowledge
 
Data Cloud, More than a CDP by Matt Robison
Data Cloud, More than a CDP by Matt RobisonData Cloud, More than a CDP by Matt Robison
Data Cloud, More than a CDP by Matt RobisonAnna Loughnan Colquhoun
 
From Event to Action: Accelerate Your Decision Making with Real-Time Automation
From Event to Action: Accelerate Your Decision Making with Real-Time AutomationFrom Event to Action: Accelerate Your Decision Making with Real-Time Automation
From Event to Action: Accelerate Your Decision Making with Real-Time AutomationSafe Software
 
A Year of the Servo Reboot: Where Are We Now?
A Year of the Servo Reboot: Where Are We Now?A Year of the Servo Reboot: Where Are We Now?
A Year of the Servo Reboot: Where Are We Now?Igalia
 

Dernier (20)

Strategies for Unlocking Knowledge Management in Microsoft 365 in the Copilot...
Strategies for Unlocking Knowledge Management in Microsoft 365 in the Copilot...Strategies for Unlocking Knowledge Management in Microsoft 365 in the Copilot...
Strategies for Unlocking Knowledge Management in Microsoft 365 in the Copilot...
 
The 7 Things I Know About Cyber Security After 25 Years | April 2024
The 7 Things I Know About Cyber Security After 25 Years | April 2024The 7 Things I Know About Cyber Security After 25 Years | April 2024
The 7 Things I Know About Cyber Security After 25 Years | April 2024
 
Bajaj Allianz Life Insurance Company - Insurer Innovation Award 2024
Bajaj Allianz Life Insurance Company - Insurer Innovation Award 2024Bajaj Allianz Life Insurance Company - Insurer Innovation Award 2024
Bajaj Allianz Life Insurance Company - Insurer Innovation Award 2024
 
CNv6 Instructor Chapter 6 Quality of Service
CNv6 Instructor Chapter 6 Quality of ServiceCNv6 Instructor Chapter 6 Quality of Service
CNv6 Instructor Chapter 6 Quality of Service
 
Boost PC performance: How more available memory can improve productivity
Boost PC performance: How more available memory can improve productivityBoost PC performance: How more available memory can improve productivity
Boost PC performance: How more available memory can improve productivity
 
08448380779 Call Girls In Friends Colony Women Seeking Men
08448380779 Call Girls In Friends Colony Women Seeking Men08448380779 Call Girls In Friends Colony Women Seeking Men
08448380779 Call Girls In Friends Colony Women Seeking Men
 
Understanding Discord NSFW Servers A Guide for Responsible Users.pdf
Understanding Discord NSFW Servers A Guide for Responsible Users.pdfUnderstanding Discord NSFW Servers A Guide for Responsible Users.pdf
Understanding Discord NSFW Servers A Guide for Responsible Users.pdf
 
Presentation on how to chat with PDF using ChatGPT code interpreter
Presentation on how to chat with PDF using ChatGPT code interpreterPresentation on how to chat with PDF using ChatGPT code interpreter
Presentation on how to chat with PDF using ChatGPT code interpreter
 
🐬 The future of MySQL is Postgres 🐘
🐬  The future of MySQL is Postgres   🐘🐬  The future of MySQL is Postgres   🐘
🐬 The future of MySQL is Postgres 🐘
 
GenCyber Cyber Security Day Presentation
GenCyber Cyber Security Day PresentationGenCyber Cyber Security Day Presentation
GenCyber Cyber Security Day Presentation
 
Tata AIG General Insurance Company - Insurer Innovation Award 2024
Tata AIG General Insurance Company - Insurer Innovation Award 2024Tata AIG General Insurance Company - Insurer Innovation Award 2024
Tata AIG General Insurance Company - Insurer Innovation Award 2024
 
How to Troubleshoot Apps for the Modern Connected Worker
How to Troubleshoot Apps for the Modern Connected WorkerHow to Troubleshoot Apps for the Modern Connected Worker
How to Troubleshoot Apps for the Modern Connected Worker
 
EIS-Webinar-Prompt-Knowledge-Eng-2024-04-08.pptx
EIS-Webinar-Prompt-Knowledge-Eng-2024-04-08.pptxEIS-Webinar-Prompt-Knowledge-Eng-2024-04-08.pptx
EIS-Webinar-Prompt-Knowledge-Eng-2024-04-08.pptx
 
A Domino Admins Adventures (Engage 2024)
A Domino Admins Adventures (Engage 2024)A Domino Admins Adventures (Engage 2024)
A Domino Admins Adventures (Engage 2024)
 
Boost Fertility New Invention Ups Success Rates.pdf
Boost Fertility New Invention Ups Success Rates.pdfBoost Fertility New Invention Ups Success Rates.pdf
Boost Fertility New Invention Ups Success Rates.pdf
 
08448380779 Call Girls In Civil Lines Women Seeking Men
08448380779 Call Girls In Civil Lines Women Seeking Men08448380779 Call Girls In Civil Lines Women Seeking Men
08448380779 Call Girls In Civil Lines Women Seeking Men
 
Driving Behavioral Change for Information Management through Data-Driven Gree...
Driving Behavioral Change for Information Management through Data-Driven Gree...Driving Behavioral Change for Information Management through Data-Driven Gree...
Driving Behavioral Change for Information Management through Data-Driven Gree...
 
Data Cloud, More than a CDP by Matt Robison
Data Cloud, More than a CDP by Matt RobisonData Cloud, More than a CDP by Matt Robison
Data Cloud, More than a CDP by Matt Robison
 
From Event to Action: Accelerate Your Decision Making with Real-Time Automation
From Event to Action: Accelerate Your Decision Making with Real-Time AutomationFrom Event to Action: Accelerate Your Decision Making with Real-Time Automation
From Event to Action: Accelerate Your Decision Making with Real-Time Automation
 
A Year of the Servo Reboot: Where Are We Now?
A Year of the Servo Reboot: Where Are We Now?A Year of the Servo Reboot: Where Are We Now?
A Year of the Servo Reboot: Where Are We Now?
 

Etude PwC marché automobile européen Q3 (2013)

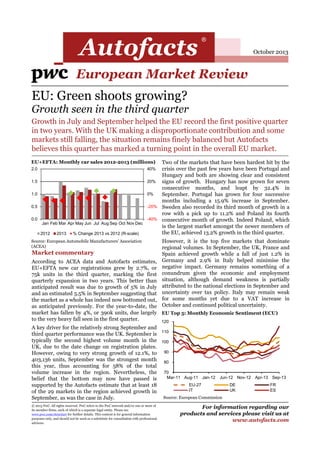
  • 1. Autofacts R For information regarding our products and services please visit us at www.autofacts.com © 2013 PwC. All rights reserved. PwC refers to the PwC network and/or one or more of its member firms, each of which is a separate legal entity. Please see www.pwc.com/structure for further details. This content is for general information purposes only, and should not be used as a substitute for consultation with professional advisors. October 2013 Growth in July and September helped the EU record the first positive quarter in two years. With the UK making a disproportionate contribution and some markets still falling, the situation remains finely balanced but Autofacts believes this quarter has marked a turning point in the overall EU market. EU: Green shoots growing? Growth seen in the third quarter European Market Review EU+EFTA: Monthly car sales 2012-2013 (millions) Source: European Automobile Manufacturers’ Association (ACEA) -40% -20% 0% 20% 40% 0.0 0.5 1.0 1.5 2.0 Jan Feb Mar Apr May Jun Jul Aug Sep Oct Nov Dec 2012 2013 % Change 2013 vs 2012 (R-scale) Market commentary According to ACEA data and Autofacts estimates, EU+EFTA new car registrations grew by 2.7%, or 75k units in the third quarter, marking the first quarterly expansion in two years. This better than anticipated result was due to growth of 5% in July and an estimated 5.5% in September suggesting that the market as a whole has indeed now bottomed out, as anticipated previously. For the year-to-date, the market has fallen by 4%, or 390k units, due largely to the very heavy fall seen in the first quarter. A key driver for the relatively strong September and third quarter performance was the UK. September is typically the second highest volume month in the UK, due to the date change on registration plates. However, owing to very strong growth of 12.1%, to 403,136 units, September was the strongest month this year, thus accounting for 58% of the total volume increase in the region. Nevertheless, the belief that the bottom may now have passed is supported by the Autofacts estimate that at least 18 of the 29 markets in the region achieved growth in September, as was the case in July. Two of the markets that have been hardest hit by the crisis over the past few years have been Portugal and Hungary and both are showing clear and consistent signs of growth. Hungary has now grown for seven consecutive months, and leapt by 32.4% in September. Portugal has grown for four successive months including a 15.9% increase in September. Sweden also recorded its third month of growth in a row with a pick up to 11.2% and Poland its fourth consecutive month of growth. Indeed Poland, which is the largest market amongst the newer members of the EU, achieved 13.2% growth in the third quarter. However, it is the top five markets that dominate regional volumes. In September, the UK, France and Spain achieved growth while a fall of just 1.2% in Germany and 2.9% in Italy helped minimise the negative impact. Germany remains something of a conundrum given the economic and employment situation, although demand weakness is partially attributed to the national elections in September and uncertainty over tax policy. Italy may remain weak for some months yet due to a VAT increase in October and continued political uncertainty. 70 80 90 100 110 120 Mar-11 Aug-11 Jan-12 Jun-12 Nov-12 Apr-13 Sep-13 EU-27 DE FR IT UK ES EU Top 5: Monthly Economic Sentiment (ECU) Source: European Commission
  • 2. Autofacts R For information regarding our products and services please visit us at www.autofacts.com © 2013 PwC. All rights reserved. PwC refers to the PwC network and/or one or more of its member firms, each of which is a separate legal entity. Please see www.pwc.com/structure for further details. This content is for general information purposes only, and should not be used as a substitute for consultation with professional advisors. Forecast First half may have marked the bottom A slightly stronger third quarter than forecast, results in a full year upward revision although the fourth quarter could still see some negative results. michael.x.gartside@de.pwc.com Tel: +49(0)711250341104 Economic commentary and demand outlook While it is too soon to see how the economy performed in the third quarter, the second quarter economic growth figures surprised most observers with many markets including Germany and the UK achieving better than expected results and also showing France moving out of recession. Clearly, the economic situation in most countries remains challenging. But after the reasonably positive second quarter, many forward looking indicators suggest the economic picture could continue to improve. If we take the Eurostat Economic Sentiment Indicator (ESI) then these have shown very strong growth within both the Eurozone and the EU in recent months. A large increase in September for the EU took the reading to 100.6, above the long term average of 100 for the first time since July 2011. Likewise, if we take the EU Consumer Sentiment Indicator then again it has improved significantly in recent months in most economies. For the EU as a whole it stood at -11.7 in September, above the long run average of -12.3. Within the smaller Eurozone, it improved to -14.9 which is just below the long run average of -13.3 and the highest level recorded since July 2011. These improving sentiment indicators are supported by Markit’s Purchasing Managers’ Index (PMI), which suggested the recovery gathered pace through the third quarter, with the index improving to a 27 month high of 52.2 in June. Markit also stated that the jobs outlook was improving with the rate of jobs losses easing to a very moderate pace. In the previous European Market Review July 2013 issue, Autofacts reported improving sentiment and PMI indicators and suggested these should start translating into a better demand situation in the third quarter and this did indeed happen. If we see a repeat, with the relatively bullish third quarter forward looking indicators translating into growing demand in the fourth quarter then the year should end on a positive note. However, Autofacts remains cautious about the fourth quarter for a number of reasons. Demand in France and the UK was relatively strong in late 2012 making year-on-year comparisons less favourable, especially given the economic and fiscal headwinds faced by France. In addition, the outlook for Italy remains challenging also, given the VAT increase and continued political uncertainty. Finally in Germany, where the market remains stubbornly weak despite the positive economic situation, it remains to be seen if there will be a post election improvement in demand. Nevertheless, with the Seasonally Adjusted Annual Rate (SAAR) standing at 12.9m units in September, the highest level since January 2012, and many of the other EU markets now clearly returning to growth, Autofacts has raised its full-year forecast for 2013 to 12.15m units, a 3% fall over 2012. Conversely, Autofacts has slightly reduced its 2014 outlook, due to a more cautious outlook for France and Italy, forecasting growth of around 3.5% to just under 12.6m units. If the employment situation improves more rapidly than currently assumed, this could provide some upside potential. Europe France / Germany / Italy / Spain / United Kingdom EU+EFTA: new car SAAR & forecast (millions) Source: PwC Autofacts Analysis -2.5% -1.5% -0.5% 0.5% 1.5% 2.5% EZ DE FR UK IT ES 2013 2014 15-19 EU Top 5: Economic outlook – GDP growth (%) Source: PwC Economics (September 2013) 10 12 14 16 18 2007 2008 2009 2010 2011 2012 2013 2014 2015 SAAR Annual Sales Sales Forecast
  • 3. Autofacts R For information regarding our products and services please visit us at www.autofacts.com © 2013 PwC. All rights reserved. PwC refers to the PwC network and/or one or more of its member firms, each of which is a separate legal entity. Please see www.pwc.com/structure for further details. This content is for general information purposes only, and should not be used as a substitute for consultation with professional advisors. Forecast 1.5 2 2.5 3 2007 2008 2009 2010 2011 2012 2013 2014 2015 SAAR Annual Sales Sales Forecast France A difficult start to 2013 mixed with a lack of visibility is holding back consumers. Source: Comité des Constructeurs Français d’Automobiles (CCFA) -40% -20% 0% 20% 40% 0 50 100 150 200 Jan Feb Mar Apr MayJun Jul AugSep Oct NovDec 2012 2013 % Change 2013 vs 2012 (R-scale) France: Monthly car sales 2012-2013 (000s) Market Commentary CCFA data showed that new car registrations dropped by 1.2% to 378,024 units in the third quarter. This moderated the fall recorded since the beginning of 2013 to -8.5%, 1,309,858 units, although this was the lowest first nine month result since 1997. With respective increase of 0.9% and 3.4% in comparison to 2012, July and September suggest the French market may be bottoming out, although year-on-year declines in the fourth quarter are likely given the strong fourth quarter of 2012. In addition, several elements must be highlighted. September was boosted by an extra selling day. The positive results are also partly explained by the high level of “tactical sales” (demonstration cars, rentals, etc.) and in September these sales amounted to more than 17% of the 142,211 units. The numerous product launches from the French carmakers in the second and third quarter also help to explain the slightly more positive situation. France: new car SAAR & forecast (millions) Source: PwC Autofacts Analysis France: Sentiment and Confidence Indicator The third quarter showed improvement of the overall French economic sentiment. The industry and consumer confidence indicators improved respectively by more than 4.5 and 7 points compared to the previous quarter. But France is the only major EU economy to experience a deterioration in economic sentiment since Autumn last year, when the low point was reached in most economies. Plus, for the second quarter in a row, its indicators are lower than the ones of Spain or Italy. However, contrary to statistical data, some polls show that individuals and companies are feeling that the French economic situation is not improving. The reforms that have been introduced, including the new tax increases and reductions of state subsidies, are not seen to meet the structural problems of the country. It doesn’t offer them clear visibility for the future, which is weighing on consumer sentiment. To add to that, the prospect of an increase in the VAT could constrain economic growth prospects. The third quarter SAAR, at 1.76m, was the highest quarterly result this year. While Autofacts forecasts a further improvement in the SAAR in the final quarter, given the relatively strong fourth quarter in 2012, this still equates to a falling market on a year- on-year comparison basis. For the year as a whole Autofacts maintains its forecast at 1.75m units, a 7.9% fall over 2012. Due to the challenging economic situation and increased tax burden, Autofacts sees little prospect for a strong recovery in France in 2014 and forecast growth of just 2.9% to 1.8m units. Europe France / Germany / Italy / Spain / United Kingdom josselin.chabert@fr.pwc.com Tel: +33(0)156577158 -40 -30 -20 -10 0 10 20 70 80 90 100 110 120 Mar-11Jul-11Nov-11Mar-12Jul-12Nov-12Mar-13Jul-13 FR Economic Sentiment Industry (R-scale) Consumer (R-scale) Source: European Commission (September 2013)
  • 4. Autofacts R For information regarding our products and services please visit us at www.autofacts.com © 2013 PwC. All rights reserved. PwC refers to the PwC network and/or one or more of its member firms, each of which is a separate legal entity. Please see www.pwc.com/structure for further details. This content is for general information purposes only, and should not be used as a substitute for consultation with professional advisors. Forecast Germany: new car SAAR & forecast (millions) Germany Despite weak demand in the first three quarters, strong economic sentiment combined with certainty over future tax policies in Q4 could turn the market Source: Kraftfahrt-Bundesamt (KBA) -40% -20% 0% 20% 40% 0 100 200 300 400 Jan Feb Mar Apr MayJun Jul AugSep Oct NovDec 2012 2013 % Change 2013 vs 2012 (R-scale) Germany: Monthly car sales 2012-2013 (000s) Market Commentary In September new car sales in Germany fell by 1.2% to 247,199 units according to KBA data. This resulted in a market contraction of 6.0% to 2.22m units for the first three quarters of 2013. While this is a weak result, the fall in new car registrations at least slowed when looking at the market evolution by quarter. The decrease in new car sales in the first quarter by 12.9% followed by a fall of 3.7% in the second quarter can be partly explained by the strong first half of the German market in 2012. Thus, the 1.4% fall from July to September could mark the end of the market’s contraction. While new car demand weakened in Germany, economic sentiment increased markedly over the last year, reaching a 17-month high in September according to the European Commission. The German market research institute GfK even forecasts that consumer confidence will hit its highest level in six years heading into October. Source: PwC Autofacts Analysis Germany: Sentiment and Confidence Indicator -20 -10 0 10 20 80 90 100 110 120 Mar-11Jul-11Nov-11Mar-12Jul-12Nov-12Mar-13Jul-13 DE Economic Sentiment Industry (R-scale) Consumer (R-scale) Although Germany’s unemployment rate rose to 6.9% in September, it remained close to its lowest level since reunification more than two decades ago. Driven by the stable labor market and historically low interest rates, German consumers, who traditionally tend to save, became more willing to spend in September than at any point since December 2006. Given the weak demand for new cars but the strong willingness to buy, the question remains why the positive consumer sentiment is not reflected in vehicle demand. One possible explanation can be found in a political rather than an economic issue. Although Angela Merkel's conservative party recently won the national elections, a coalition partner has to be found after falling just short of a parliamentary majority. While Merkel unequivocally rejected tax hikes in the election campaign, it is thought that she is likely to seek a grand coalition with the Social Democrats (SPD) who had campaigned on a platform of tax increases for Germany's highest earners. Therefore, it is possible that some consumers fear tax hikes and thus defer purchases until future tax policies become certain. Despite a low SAAR of 2.91m units in September, given the said factors, Autofacts forecast a recovery in the SAAR by fourth quarter. This results in an expected overall decline of 3.6% to 2.98m units for the German market in 2013. Further, given the current average age of the German car fleet is now at a record high of 8.7 years, pent-up demand is building, which is expected to enhance demand in the mid-term, contributing to a return to growth in 2014 with a 2.4% increase to 3.05m units. 2.5 3 3.5 4 4.5 2007 2008 2009 2010 2011 2012 2013 2014 2015 SAAR Annual Sales Sales Forecast Europe France / Germany / Italy / Spain / United Kingdom Keisuke.Kusaba@de.pwc.com Tel: +49(0)711250341457Source: European Commission (September 2013)
  • 5. Autofacts R For information regarding our products and services please visit us at www.autofacts.com © 2013 PwC. All rights reserved. PwC refers to the PwC network and/or one or more of its member firms, each of which is a separate legal entity. Please see www.pwc.com/structure for further details. This content is for general information purposes only, and should not be used as a substitute for consultation with professional advisors. Forecast Italy Despite some positive economic developments, Italy faces a number of challenges which could undermine recovery hopes over the short-term. Source: Ministero delle Infrastrutture e Trasporto (MIT), ISTAT -40% -20% 0% 20% 40% 0 50 100 150 200 Jan Feb Mar Apr MayJun Jul AugSep Oct NovDec 2012 2013 % Change 2013 vs 2012 (R-scale) Italy: Monthly car sales 2012-2013 (000s) Market Commentary A lot has been said regarding a potential market recovery, which would benefit the whole value chain, but in relation to Italy signs remain elusive. The whole local automotive value chain has been in survival mode for over three years and, as a confirmation of this downward trend, July closed with 107,848 units, a fall of 1.6 % year-on-year, August with 52,997 units, a decline of 6.6 % year- on-year, and September posted 106,363 units, a fall of 2.9 % year-on-year. For the year-to-date, registrations fell by 8.34% to 1,000,032 units. Viewed against 2007 pre-crisis volumes, the contraction is even worse at -48%. Weak market performance is partially due to heavy fiscal pressures recently introduced from the Italian government negatively impacting the purchase of new vehicles. These include duties, taxes and high maintenance costs, with the tax element on fuel now equating to 58.4% of the price. Italy: new car SAAR & forecast (millions) Source: PwC Autofacts Analysis Italy: Sentiment and Confidence Indicator -60 -40 -20 0 60 80 100 120 Mar-11Jul-11Nov-11Mar-12Jul-12Nov-12Mar-13Jul-13 IT Economic Sentiment Industry (R-scale) Consumer (R-scale) Further negative influences come in the form of the convergence of political instability and increased VAT, boosted from 21% to 22%, which may further weaken the already depressed demand for vehicles. As a consequence, the Italian automotive market is going through a transition which, on one side, alternative fuel vehicles achieved 15.2% year-to-date of penetration and, on the other side, a progressive switch toward smaller size segments is taking place (A segment went from 18.8% in 2012 to 19.1 in 2013 and MINI SUV’s from 2.6% to 4.2%). Some hope may be taken from Italian National Institute of Statistics’ (ISTAT) consumer confidence index posting an improved attitude toward the purchase of durable goods (turning from 97.4 to 98.3). In addition, the Italian dealer network displayed a positive sentiment for the coming quarter in combination with a higher flow of visitors, according to Centro Studi Promotor (CSP). Despite these potential positive developments, downside risks in the form of the current macro- economic landscape and increased tax burden, appear stronger and demand is expected to remain underperforming. As a result, Autofacts has marginally downgraded its full-year forecast for Italy to 1.28m units, an 8.8% decline on 2012. 1 1.5 2 2.5 3 2007 2008 2009 2010 2011 2012 2013 2014 2015 SAAR Annual Sales Sales Forecast Europe France / Germany / Italy / Spain / United Kingdom giorgio.elefante@it.pwc.com Tel: +390280646325Source: European Commission (September 2013)
  • 6. Autofacts R For information regarding our products and services please visit us at www.autofacts.com © 2013 PwC. All rights reserved. PwC refers to the PwC network and/or one or more of its member firms, each of which is a separate legal entity. Please see www.pwc.com/structure for further details. This content is for general information purposes only, and should not be used as a substitute for consultation with professional advisors. Forecast Spain The extension, again, of Spain’s PIVE incentive plan continues to support the market at a 700k unit level. Source: Association of Spanish Automobile Manufacturers (ANFAC) -40% -20% 0% 20% 40% 0 25 50 75 100 Jan Feb Mar Apr MayJun Jul AugSep Oct NovDec 2012 2013 % Change 2013 vs 2012 (R-scale) Spain: Monthly car sales 2012-2013 (000s) Market Commentary In September, new car registrations in Spain rose by 28.5% to 45,175 units according to ANFAC. Strong year-on-year growth was virtually inevitable given the very weak September 2012 as a result of the VAT increase at the start of that month. In addition, an extra selling day further helped as did the extension of the PIVE scrappage scheme with PIVE3. This growth helped the market record a decline of just 1.6% in the first nine months to 546,435 units. Not surprising, given the plan PIVE scrappage schemes, it is private buyers that are supporting the market at this low level, with a 69.4% leap in registration in September to 28,695 units. For the year-to-date, volumes were up by 10.5% to 283,347 units. Conversely, sales to companies remain weak, with a 10.9% fall in September to just 14,737 units while for the year-to- date they have fallen by 20.4% to 138,636 units. Spain: new car SAAR & forecast (millions) Source: PwC Autofacts Analysis Spain: Sentiment and Confidence Indicator -60 -40 -20 0 80 90 100 110 Mar-11Jul-11Nov-11Mar-12Jul-12Nov-12Mar-13Jul-13 ES Economic Sentiment Industry (R-scale) Consumer (R-scale) With the holiday season coming to an end, September is inevitably a small month for rental sales, although the 1,743 units did represent a 4.3% year-on-year increase. For the year-to-date, rental companies have bought 124,450 cars, a 0.4% increase on 2012. While Spain remains in recession, and continues to suffer from extremely high unemployment and faces significant challenges, the dramatic improvements seen in sentiment over the past year may point towards an improving situation over the next six months. Consumer sentiment has improved from -40 in December to -17.5, only slightly below the average of -14.5 since 1990. Likewise, economic sentiment has improved consistently over the past year, but gained strength in recent months. Less positive was the second monthly decline in the Markit Purchasing Managers’ Index (PMI), although it still stood well above levels seen over the previous 24 months. The Spanish SAAR has been remarkably stable this year and stood at 720k units in September. As a result, Autofacts maintains its forecast for 700k units for the full-year. For 2014, one of the biggest concerns now is the impact of a withdrawal of the government scrappage incentive. So far, each PIVE scheme has been relatively small so the improving economic fundamentals may offset any negative influence from scrappage withdrawal. Therefore, on balance, Autofacts forecast a marginal increase in Spanish demand to 710k units in 2014. 0.5 1 1.5 2 2007 2008 2009 2010 2011 2012 2013 2014 2015 SAAR Annual Sales Sales Forecast Europe France / Germany / Italy / Spain / United Kingdom Source: European Commission (September 2013) michael.x.gartside@de.pwc.com Tel: +49(0)711250341104
  • 7. Autofacts R For information regarding our products and services please visit us at www.autofacts.com © 2013 PwC. All rights reserved. PwC refers to the PwC network and/or one or more of its member firms, each of which is a separate legal entity. Please see www.pwc.com/structure for further details. This content is for general information purposes only, and should not be used as a substitute for consultation with professional advisors. Forecast United Kingdom Registrations in September were the highest since March 2008, with an improving economy increasingly supporting the growth being seen. Source: Society of Motor Manufacturers and Traders (SMMT) -40% -20% 0% 20% 40% 0 100 200 300 400 Jan Feb Mar Apr MayJun Jul AugSep Oct NovDec 2012 2013 % Change 2013 vs 2012 (R-scale) UK: Monthly car sales 2012-2013 (000s) Market Commentary According to SMMT data, the UK market experienced an extremely strong September, with registrations up by 12.1% to 403,176 units. This was the highest monthly result since March 2008 and contributed to third quarter growth of 12.2% to 631,301 units, the highest third quarter result since 2007. For the year-to-date, registrations grew by 10.8% to 1,794,924 units. Private consumers continue to drive the market with registrations up by 17.9% in September and 16.7% for the year-to- date. As a result, private share of the market in September, at 51.8%, was the highest since March 2010 and for the year-to-date, at 48.4%, the highest since 2009. Part of this boom in private demand is being driven by the widespread cash payments made in compensation for mis-sold payment protection insurance (PPI). With around £8bn paid out in 2012 and a greater amount expected this year, these windfall cash payments are providing a large cash boost to UK consumers. UK: new car SAAR & forecast (millions) Source: PwC Autofacts Analysis UK: Sentiment and Confidence Indicator -30 -20 -10 0 10 20 70 80 90 100 110 120 Mar-11Jul-11Nov-11Mar-12Jul-12Nov-12Mar-13Jul-13 UK Economic Sentiment Industry (R-scale) Consumer (R-scale) However, while this cash windfall has no doubt helped the UK market, the company car sector is also showing stronger growth as the year progresses. At the mid-year point, company car registrations were just 4.3% up, but by the nine month point they had grown by 8.5%. While strong incentives and key new models are helping the market, it appears that economic fundamentals are increasingly playing their part. Second quarter economic output was stronger than anticipated and unemployment is now starting to fall. In addition, dramatic increases have been seen in the consumer and economic sentiment indicators over the past few months which support the positive picture. Consumer sentiment leapt from -17.5 in May to -1.0 in September, well ahead of the average of -10 since 1990. Likewise, economic sentiment stood at 115.4, well above the 100 average and just below the peak level of 116.5. These suggest that demand should remain strong in the coming months. The SAAR stood at 2.38m in September, the highest level since the scrappage scheme boosted the market in late 2009. Given the extremely strong September, the dramatic improvement in sentiment and stronger economic position, Autofacts has raised its full-year forecast for the UK to 2.22m units some 8.6% higher than 2012. However, with the impact of the PPI compensation likely to diminish next year, and economic growth likely to remain below its long run average, we do not see demand continuing to grow at these exalted levels and forecast moderate growth of 2.2% to 2.27m into 2014. Europe France / Germany / Italy / Spain / United Kingdom michael.x.gartside@de.pwc.com Tel: +49(0)711250341104Source: European Commission (September 2013) 1.5 2.0 2.5 3.0 2007 2008 2009 2010 2011 2012 2013 2014 2015 SAAR Annual Sales Sales Forecast