SlideShare une entreprise Scribd logo
1  sur  18
Analyst Note>

Autofacts

R

October 2013

Quarterly Forecast Update
Industry poised to end year on a good note

Despite ongoing concerns in select regions, the stabilisation of several key
automotive markets in 2013 has positioned the global automotive industry to
forge ahead with technological innovation, further driving strategic
partnerships and increased merger and acquisition activity.
Global: Year-over-year (YoY) Assembly Change by Region
2012 vs. 2013(f)
Developing
Asia-Pacific

South
America

Eastern
Europe

North
America

European
Union

Developed
Asia-Pacific

Middle East &
Africa (ME&A)

9.61%

4.94%

5.95%

4.94%

-0.91%

-4.57%

-16.13%

Source: Autofacts 2013 Q4 Data Release

Year in review
While there is seldom an occasion where the global
industry has performed in sync, 2013 does promise
to mark a turning point for the European Union,
setting the region up for a long awaited, albeit slight,
recovery in 2014. This will bring the region in line
with the recent recoveries in North America and
Eastern Europe and the continued growth in
Developing Asia-Pacific and South America.
Areas of concern remain, however, as developed
Asia-Pacific (Japan, South Korea, Australia) is
expected to see assembly declines throughout the
forecast window. Stagnant economic conditions,
high labor costs, and localisation of products
currently tagged for export are all factors
constraining production in these markets. ME&A is
also experiencing a significant decline as sanctions
against Iran and political uncertainty within the
region remain prevalent. Despite these setbacks,
global light vehicle production is expected to reach
81.8m units in 2013, representing a 3.3% YoY gain.

1

Autofacts

Looking beyond the numbers, several key
developments began to take shape during 2013 that
promise to have a significant impact on the global
automotive outlook going forward. Announced in
July 2013, the formation of a strategic partnership
between GM and Honda to develop next-gen fuel
cell technologies represents a growing trend of
strategic collaborations and resource pooling to
drive and deliver innovation to the masses.
Although M&A activity is down in 2013, companies
continue to strengthen and/or broaden their
capabilities. The pace of acquisitions is expected to
quicken, particularly in the areas of fuel economy
and safety systems. Furthermore, OEMs and
suppliers in developing markets will seek to acquire
distressed companies with established capabilities in
these areas, setting the stage for more
geographically balanced – and competitive – core
competencies in the future.
For information regarding our
products and services please visit us at
www.autofacts.com
Analyst Note Plus

North America
Key Regional Statistics

Key Statistics
(YTD)

US light vehicle sales

+8.1%

Canada light vehicle sales

+5.0%

Assembly 2012-2019 CAGR

+2.8%

Argentina light vehicle sales

+18.7%
+6.9%

+8.9%

Regional assembly

+11.2%

+3.4%

Mexico light vehicle sales

+2.5%

Assembly 2012-2019 CAGR

% Change
(YoY)

Brazil new light vehicle registrations
Brazil light vehicle assembly

Key Statistics
(YTD)

% Change
(YoY)

Sales
All three countries in the North America continue to
grow at impressive rates, with the US leading on a
volume basis and Mexico on a percentage basis. The
US market has sold more vehicles through
September than it did all of 2010 and should easily
surpass last years 14.4m units for the full year.
Autofacts sees full-year 2013 sales reaching 15.6m
units – the region’s fourth consecutive year with
gains of over a million units. For 2014, Autofacts
expects sales to reach 16.2m units which, though not
as large as recent growth, would still represent a
healthy gain.
The question at hand for the US will now shift
towards where the natural rate of demand will be
now that the market has essentially recovered from
the lows of 2009. Autofacts anticipates that demand
for new vehicles will fluctuate between 16m to 17m
units by the end of the decade.
Canada is currently on track to have a record year for
new vehicle sales, surpassing the previous high of
1.69m units in 2007. Autofacts currently forecasts
Canadian sales to reach 1.74m units for the full year.
Assembly
Though mature and stable, the North American
topline continues to expand with increasing vehicle
sales and further investments by OEM’s in the
region. The region is now forecasted to produce
nearly 16.2m units in 2013, the highest number since
2002. Capacity in the region is forecasted to grow
from 15.4m units in 2012 to 18.4m units in 2017.
South America
Key Regional Statistics
Sales
Encouraging growth seen in Brazil during the first
2

Autofacts

half of the year has dissipated, even as the IPI tax
holiday winds down in October. Stimulus measures
including lowered interest rates have been offset by
tighter credit restrictions in lending, restraining fullyear 2013 sales forecast to ~1.3% YoY growth.
Brazil’s auto industry trade group, ANFAVEA, is
aiming to improve the sales climate by lobbying for a
change in leasing requirements that would shift the
onus of taxes and fines from lenders to vehicle
owners. Current leasing structures hold financial
institutions accountable for payment of these fees,
but a transfer of responsibility could encourage
banks to increase lease lending and in turn, boost
auto sales. While no changes have been enacted to
date, the proposed modifications are expected to
pass and could become effective before the end of
the year.
Argentina has enjoyed impressive YoY growth in
new car sales, hitting record highs in the summer
before slowing its pace in August. While the overall
economy is expected to grow at less than 3%, auto
sales have surged in 2013 with imports accounting
for the majority of the growth in sales volume. As
inflation and volatile currency exchanges continue to
dog the economy, cars are considered safer
investments, bolstering sales growth.
Assembly
In contrast to the stagnant sales market, the
assembly volumes in Brazil have seen steady growth
with full-year 2013 assembly expected to reach
~3.4m units. Several global OEMs, including GM,
Volkswagen and Daimler, have announced capacity
investments in the next few years, pushing assembly
to just under 4m units by 2015. More
announcements import tariffs continue
incentivizing OEMs to produce locally. Meanwhile,
Argentinean production has been impacted by the
sluggish Brazilian sales market, seeing an overall
decline in demand from their largest trading
partner. Though assembly has not kept pace with
sales, full year 2013 year growth of ~7.7% is still
For information regarding our
products and services please visit us at
www.autofacts.com
Analyst Note Plus

expected. As with much of region, Argentina’s
expansion hinges on multiple monetary and
economic policy variables, most of which are subject
to significant state intervention and thus remain
volatile.
European Union + EFTA
Key Regional Statistics
Key Statistics
(YTD)

% Change
(YoY)

New car sales

-4.0%

Sales forecast (full year)

-3.0%

Regional assembly

-0.9%

Regional 2012-2019 CAGR

+2.5%

Sales
As predicted previously, this past summer is likely to
have marked the bottom of the EU market following
over five years of decline. Q3 2013 saw the first
quarterly YoY growth in two years with a 2.6%
improvement. Full-year registrations are expected to
reach 12.15m – a 3% decline. Within the region,
many markets are beginning to see growth with
some of the hardest hit markets showing signs of
sustained growth. Portuguese sales have increased
over four consecutive months with a 15.7% rise in
the third quarter, and Hungary has experienced
seven consecutive months of gains with a 20%
increase in the third quarter.
Elsewhere, concerns remain regarding France, Italy
and Germany, suggesting that total YoY growth in
the fourth quarter could be lower than seen in the
third quarter. The German market is
underperforming given the low unemployment rates
and strength of consumer sentiment, but it remains
to be seen whether weakness is due, at least in part,
to consumers holding off until the full outcome of
the elections is known. Meanwhile, the UK – the
region's second largest market and also the strongest
performing market this year – has grown 10.8%
year-to-date (YTD). However, fourth quarter YoY
growth will likely be significantly lower, as demand
was particularly strong in late 2012.
For 2014, Autofacts anticipates growth of 3.5% to
just under 12.6m units, with demand being
constrained by continued high unemployment and
weak economic growth in many European countries .
As unemployment is expected to fall through 2014
and economic growth within the region starts to gain
3

Autofacts

traction towards 2015, demand for new cars should
increase.
Assembly
If assembly output is any indication, the low point
has passed within the EU markets. Indeed, light
vehicle assembly has shown surprisingly strong
growth in select markets in the third quarter, with
OEMs adding capacity and working days for the
production of key models. Autofacts has revised the
EU assembly forecast to 15.8m units for the full
2013, which is a meager 0.9% YoY decline. The 2014
outlook is expected to show signs of recovery with
3.2% growth forecasted as exports stabilise and
vehicle output within the region is more closely tied
to demand growth. Recent announcements
regarding the planned assembly localisation by
select OEMs will boost the assembly topline over the
mid term. Approximately 500k units of assembly
could be added, pushing regional output past the
17m mark by 2015 and also helping to push
utilisation above 80% by 2016.
Eastern Europe
Key Regional Statistics
Key Statistics
(YTD)

% Change
(YoY)

Russia new light vehicle registrations

-6.4%

Russia light vehicle assembly

-0.6%

Turkey light vehicle assembly

+12.6%

Regional 2012-2019 CAGR

+6.0%

Sales
New vehicle sales and registrations within the
Eastern European region continue to show diverse
results between markets. Registrations are still on
the downtrend in Russia with seven consecutive
months of decline, prompting ministry officials to
offer interest rate subsidies to stimulate sales. The
program, enacted in July and continuing into 2014,
is expected to boost sales by an estimated 250k
units. Early consumer response has been positive,
resulting in a reduction in the forecasted full-year
decline of 5.9%, down from 6.1%.
After a tough year in 2012, Turkey seemed back on
track with sustained growth in 2013. September
marked the first month of YoY decrease (-2.4%) due
For information regarding our
products and services please visit us at
www.autofacts.com
Analyst Note Plus

to a number of factors, including shrinking domestic
demand and a weakening export market.
Additionally, the Turkish lira has depreciated
against the US dollar due in part to uncertainty
regarding the Federal Reserve’s bond-buying
program. The unfavorable currency rates have
constrained the import market which is primarily
financed through bank loans. This current
contraction is expected to be short lived, with fullyear 2013 sales in Turkey forecasted to reach 840k
units for a 8.2% growth over 2012.
Moderate but sustainable growth is anticipated for
the surrounding Commonwealth of Independent
States (CIS) going into 2014 and beyond, as
countries like Kazakhstan continue to see increases
in domestic demand as well as regional exports.
Assembly
Though the sales market has seen a slowdown in
Russia, assembly remains slightly positive, with an
additional ~12k units of output in 2013 as compared
to 2012 to reach just under 2.1m units. More
definitive growth is expected for 2014 and beyond,
with investments by global OEMs looking to shift
away from importing and increase domestic
production. Turkey is already seeing a boost in
locally produced models, including significant
capacity increases for the Hyundai i10 and Toyota
Corolla. Full-year 2013 production is expected to
total ~1m units and reach nearly 1.2m units by 2014.

Sales
The Japanese light vehicle sales market continues to
post declines, though it should be noted that 2012
growth was due in large part to the eco car cash
incentives that pulled ahead sales. Even so,
Japanese brands continue to struggle within their
home market. Smaller, more efficient vehicles like
minis and hybrids remain popular, increasing their
respective market shares to 41% and 15%. Import
sales volume s, though a relatively low portion of the
total market at 172k units, are also experiencing
robust growth, gaining a full percentage of market
share from 4% to 5%. The long term outlook for the
market as a whole remains bleak as an aging,
urbanised population continues to contract with
demand falling accordingly. Perhaps a silver lining
can be found with the 2020 Tokyo Olympics, which
could stimulate the economy and spur growth in
auto sales.
Vehicle sales in Australia grew to 737k units YTD,
putting the market on pace for another year of sales
surpassing the 1m unit mark. SUVs, particularly
those with diesel engine variants, continue to gain
favor with consumers with a 30% share of the total
market. Meanwhile, once popular domestically
sourced sedans have now dipped below 10% market
share – a reflection of the quickly-shrinking
assembly base.

Other developing CIS nations are expanding
assembly as well, increasing their production
potential in hopes of attracting capacity investments.
The region is rife with opportunity, and as long as
progress continues, these emerging countries could
become future assembly bases as OEMs continue
towards the mantra of “build it where you sell it.”

Consumers in South Korea have shown a marked
shift towards imports, which have jumped 29% YoY
as domestic brands have been holding flat in terms
of sales. Free trade agreements and generous
discounts have made import prices much more
competitive, enticing consumers to shop beyond the
confines of their home market brands. However, the
South Korean population is experiencing
demographic shifts not unlike that of Japan,
suggesting a slower pace of growth in the long-term.

Developed Asia-Pacific
Australia, Japan, and South Korea

Assembly

Key Statistics
(YTD)

% Change
(YoY)

Japan light vehicle sales

-8.0%

South Korea light vehicle sales

+3.0%

Australia light vehicle sales

+4%

Regional assembly

-4.6%

Assembly 2012-2019 CAGR

Concurrent declines in domestic sales and export
volumes have resulted in decreased total assembly
volumes in Japan, which are expected to decrease
YoY by 6.8% to reach just over 8.7m for the full year.
Though the Yen exchange rates have become more
favourable to Japanese OEMs in recent months,
investment in R&D centers, powertrain plants, and
supplier parks within growing overseas markets is
expected to continue. This long-term transition will
require an industry-wide focus on addressing excess
capacity going forward.

-1.1%

4

Autofacts

For information regarding our
products and services please visit us at
www.autofacts.com
Analyst Note Plus

With recent withdrawals from the Australian
assembly base, volumes are expected to remain
relatively flat around 250k units for the remainder of
the decade. OEMs are expected to shift their product
mixes to better reflect consumer preferences for
SUVs, but such programs may not be sustainable
should parliament discontinue incentives to retain
manufacturing operations within Australian borders.
Also holding flat are South Korean assembly
volumes, growing at a scant 0.14% YoY to reach just
under 4.4m units. Increasing labor costs, disruptive
strikes, and the strengthening Won are all impacting
the overall appeal of maintaining the country as an
export base, and all will likely be factors as OEMs
reconfigure their global footprint. With these
constraints in mind, total South Korean assembly
volume is forecasted to hover around the 4.5m mark
for the remainder of the forecast window.
Developing Asia-Pacific
China and India
Key Statistics
(YTD)

% Change
(YoY)

China light vehicle sales

+13.5%

China Light vehicle assembly

+11.8%

India light vehicle sales

-8.0%

India light vehicle assembly

-5.1%

Assembly CAGR 2012 to 2019

+7.7%

China
The sales environment in the Chinese market
continued to grow throughout the first three
quarters of the year, supported by strong consumer
demand and a relatively low basis in 2012. YTD light
vehicle sales have reached12.5m units for a positive
gain when compared YoY. SUVs continue to outpace
other segments, reporting an increase of 47.1% in
YTD sales through August. Most major brands have
brought recent introductions and/or refreshed
crossover and SUV models to market to cash in on
this trend.
Sales are expected to remain strong through the
remainder of the year despite economic uncertainty.
Consumer sentiment has improved thanks to the
official implementation of stricter vehicle recall
policies, which are aimed to encourage higher
quality through stiff penalties for delayed recall
5

Autofacts

announcements. This, combined with anticipated
product launches, will help encourage consumers to
visit their local dealerships. Full-year 2013 sales are
expected to reach 18.1m units, a 14.4% increase over
2012. It should be noted that Q4 2012 numbers
were impacted by the territorial dispute over the
Senkaku – Diaoyu islets. The closing months of 2013
should show a marked improvement over 2012 given
the subsequent recovery of Japanese brands.
China light vehicle assembly has also enjoyed
continued expansion, with YTD assembly reaching
13.1m. Japanese brands are expected to increase
their production to continue recovering lost market
share. Though the year started off with slower
production, strong consumer demand has driven
higher levels of assembly, with full-year 2013
assembly expected to reach 18.5m units.
India
Until recently, India was seen as a high-potential,
upcoming market with automakers benefitting
greatly from a burst in consumer-driven growth in
overall consumption, including new light vehicles.
However, the industry is now struggling along with
the national economy. Once growing over 50%
between 2010 to 2012, sales of new vehicles are now
in their ninth consecutive month of decline.
Sagging customer demand has been compounded by
a combination of deflating conditions. The growing
current account deficit– a reflection of the widening
gap between imports and exports – has triggered
fluctuations in the dollar to Rupee exchange rate.
While the currency has rebounded since plunging to
all-time lows in August, the auto sector faces
additional industry-specific hurdles. Utility vehicles,
which reign as one of the most popular segments,
are now subject to a 3% tax, while high financing
costs and rising fuel prices are dampening hopes for
a turnaround in demand.
As monsoon season comes to an end, there is hope
that perhaps the downturn will soon be a thing of
the past, particularly for rural households whose
income has the potential to give a much needed
boost to the Indian light vehicle market. However,
the slow pace of policy reform and the widespread
infrastructure issues will continue to restrain sales
in the short term. Full-year sales is forecasted to
decline by over 5% for 2013, with hope that the new
year will help boost consumer sentiment and in
turn, sustainable growth in sales and assembly for
the remainder of the forecast window.
For information regarding our
products and services please visit us at
www.autofacts.com
Analyst Note Plus

Baseline assembly forecast data - Global
Growth analytics (2012-2017)
Region1

2012

2013

2014

2015

2016

2017

Unit diff.

% chg

CAGR

1 Asia-Pacific - developing

24,517,872

26,869,862

29,985,847

33,157,119

36,246,221

38,475,473

13,957,601

56.9%

9.4%

62.1%

1

2 European Union

15,915,153

15,770,608

16,267,392

17,494,732

18,342,376

18,756,292

2,841,139

17.9%

3.3%

12.6%

3

3 North America

15,395,983

16,159,124

16,789,907

17,492,206

17,871,117

18,406,259

3,010,276

19.6%

3.6%

13.4%

2

4 Asia-Pacific - developed

13,973,140

13,334,889

13,303,820

13,199,781

13,053,183

13,060,688

-912,452

-6.5%

-1.3%

-4.1%

7

5 South America

4,171,558

4,504,482

4,710,604

5,202,280

5,778,910

6,088,041

1,916,483

45.9%

7.9%

8.5%

4

6 Eastern Europe

3,477,104

3,683,936

3,968,579

4,298,634

4,600,708

4,901,262

1,424,158

41.0%

7.1%

6.3%

5

7 Middle East & Africa

1,798,824

1,508,615

1,561,357

1,688,720

1,862,921

2,041,409

242,585

13.5%

2.6%

1.1%

6

Global total assembly

79,249,634

81,831,516

86,587,506

92,533,472

97,755,436

101,729,424

22,479,790

28.4%

5.1%

100.0%

Global total capacity

101,908,978

106,372,936

112,878,507

120,437,439 125,163,201

125,550,516

23,641,538

23.2%

4.3%

22,659,344

24,541,420

26,291,001

27,903,967

27,407,765

23,821,092

1,161,748

5.1%

1.0%

77.8%

76.9%

76.7%

76.8%

78.1%

81.0%

Global excess capacity
Global utilisation (%)
Country

CTG % Rank2

2012

2013

2014

2015

2016

2017

Unit diff.

% chg

CAGR

1 China

16,696,064

18,483,049

20,706,735

23,080,285

25,155,718

26,584,689

9,888,625

59.2%

9.7%

44.0%

2 USA

10,097,912

10,899,425

11,668,762

12,239,215

12,568,368

12,915,180

2,817,268

27.9%

5.0%

12.5%

2

3 Japan

9,359,348

8,725,480

8,621,405

8,414,025

8,298,129

8,247,445

-1,111,903

-11.9%

-2.5%

-4.9%

52

4 Germany

5,645,037

5,553,945

5,576,088

5,748,887

5,923,726

6,187,879

542,842

9.6%

1.9%

2.4%

9

5 South Korea

4,384,596

4,390,690

4,427,454

4,521,544

4,501,071

4,550,320

165,724

3.8%

0.7%

0.7%

18

6 India

3,425,285

3,320,802

3,474,624

3,864,083

4,527,925

5,131,886

1,706,601

49.8%

8.4%

7.6%

3

7 Brazil

3,109,008

3,396,837

3,597,534

3,980,955

4,483,115

4,692,702

1,583,694

50.9%

8.6%

7.0%

4

8 Mexico

2,847,732

2,917,970

2,940,150

3,158,454

3,250,892

3,383,961

536,229

18.8%

3.5%

2.4%

10

9 Thailand

2,313,284

2,696,605

2,919,141

3,181,813

3,410,355

3,539,623

1,226,339

53.0%

8.9%

5.5%

5

10 Spain

1,944,656

2,098,781

2,244,922

2,588,567

2,763,196

2,837,222

892,566

45.9%

7.8%

4.0%

6

11 Russia

2,087,860

2,099,680

2,238,099

2,414,108

2,639,883

2,837,315

749,455

35.9%

6.3%

3.3%

7

12 Canada

2,450,339

2,341,729

2,180,995

2,094,537

2,051,857

2,107,118

-343,221

-14.0%

-3.0%

-1.5%

51

13 France

1,950,044

1,822,344

1,926,742

2,017,717

2,235,381

2,319,130

369,086

18.9%

3.5%

1.6%

13

14 United Kingdom

1,558,165

1,592,162

1,557,026

1,685,346

1,711,707

1,733,732

175,567

11.3%

2.2%

0.8%

17

945,577

1,124,017

1,442,492

1,507,317

1,574,886

1,608,903

663,326

70.2%

11.2%

3.0%

8

16 Turkey

1,005,200

1,097,103

1,166,286

1,283,226

1,342,576

1,422,390

417,190

41.5%

7.2%

1.9%

12

17 Czech Republic

15 Indonesia

CTG % Rank
1

1,088,377

1,011,659

1,111,395

1,161,287

1,165,859

1,174,817

86,440

7.9%

1.5%

0.4%

23

18 Italy

635,165

576,438

621,324

957,028

1,109,123

1,167,750

532,585

83.8%

13.0%

2.4%

11

20 Argentina

736,336

793,638

766,387

848,524

906,713

977,053

240,717

32.7%

5.8%

1.1%

15

1,063,403

698,636

677,727

732,501

850,096

976,819

-86,584

-8.1%

-1.7%

-0.4%

49

21 Slovakia

779,411

817,037

831,563

797,388

777,167

718,286

-61,125

-7.8%

-1.6%

-0.3%

48

22 Malaysia

547,478

607,186

765,274

820,421

857,499

881,465

333,987

61.0%

10.0%

1.5%

14

23 Poland

635,841

582,772

556,818

604,160

667,585

654,218

18,377

2.9%

0.6%

0.1%

37

24 South Africa

538,799

537,947

575,975

608,624

619,678

633,263

94,464

17.5%

3.3%

0.4%

22

25 Hungary

230,727

325,140

465,037

497,144

451,645

414,749

184,022

79.8%

12.4%

0.8%

16

26 Belgium

504,633

441,721

414,589

299,944

307,849

318,574

-186,059

-36.9%

-8.8%

-0.8%

50

27 Romania

338,182

411,131

372,907

354,981

348,323

347,065

8,883

2.6%

0.5%

0.0%

41

28 Taiwan

315,922

340,038

355,958

351,517

359,319

354,284

38,362

12.1%

2.3%

0.2%

32

29 Uzbekistan

243,603

265,870

253,494

261,204

267,776

277,983

34,380

14.1%

2.7%

0.2%

33

30 Australia

229,196

218,719

254,961

264,212

253,983

262,923

33,727

14.7%

2.8%

0.2%

34

31 Morocco

108,726

184,962

215,463

232,358

248,195

258,809

150,083

138.0%

18.9%

0.7%

19

32 Sweden

151,183

142,763

150,959

228,177

257,191

259,640

108,457

71.7%

11.4%

0.5%

21

33 Colombia

149,749

151,126

174,995

184,907

188,232

197,079

47,330

31.6%

5.6%

0.2%

28

34 Pakistan

151,814

153,074

163,290

176,051

176,515

181,756

29,942

19.7%

3.7%

0.1%

36

35 Slovenia

130,949

84,881

127,836

166,401

188,409

170,983

40,034

30.6%

5.5%

0.2%

30

78,399,601

80,905,357

85,544,407

91,326,908

96,439,942

100,327,011

21,927,410

28.0%

5.1%

97.5%

98.9%

98.9%

98.8%

98.7%

98.7%

98.6%

97.5%

20 Iran

Top 35 total assembly
Top 35 (% of global total)
1Developed

Asia-Pacific includes Australia, Japan, South Korea | Developing Asia-Pacific includes China, India, Indonesia, Malaysia, Pakistan, Philippines, Taiwan,
Thailand, Vietnam
2Rankings

based on contribution to total global growth (CTG%).

Source: Autofacts Global Light Vehicle Assembly Outlook 2013 Q4 Data Release (Updated October 01 2013)

6

Autofacts October 2013

For more information please visit us at www.autofacts.com
Analyst Note Plus

Baseline assembly forecast data - Global
Growth analytics (2012-2017)
Alliance group

2012

2013

2014

2015

2016

2017

Unit diff.

% chg

CAGR

10,589,068

10,665,006

10,836,569

11,022,746

11,174,085

11,411,592

822,524

7.8%

1.5%

3.7%

9

2 GM Group

9,375,145

9,803,594

10,218,378

10,766,942

11,639,801

12,161,075

2,785,930

29.7%

5.3%

12.4%

1

3 VW Group

9,184,443

9,563,663

9,900,626

10,661,606

11,527,849

11,954,017

2,769,574

30.2%

5.4%

12.3%

2

4 Renault-Nissan

8,023,485

8,048,195

8,839,747

9,689,230

10,176,969

10,536,836

2,513,351

31.3%

5.6%

11.2%

3

5 Hyundai Group

7,182,498

7,520,959

7,827,461

7,959,059

8,404,049

8,744,268

1,561,770

21.7%

4.0%

6.9%

6

6 Ford Group

5,456,831

6,067,175

6,304,561

6,794,493

7,191,385

7,393,243

1,936,412

35.5%

6.3%

8.6%

4

7 Fiat Group

4,402,225

4,309,137

4,399,083

5,049,898

5,737,443

6,152,532

1,750,307

39.8%

6.9%

7.8%

5

8 Honda Group

4,069,175

4,390,264

4,960,185

5,299,797

5,393,121

5,501,202

1,432,027

35.2%

6.2%

6.4%

7

9 PSA Group

3,079,569

3,159,426

3,372,918

3,620,519

3,778,591

3,975,185

895,616

29.1%

5.2%

4.0%

8

10 Suzuki Group

2,455,203

2,306,651

2,352,701

2,444,991

2,463,554

2,689,893

234,690

9.6%

1.8%

1.0%

19

11 BMW Group

1,917,852

2,044,141

2,077,931

2,197,657

2,313,997

2,404,673

486,821

25.4%

4.6%

2.2%

14

12 Daimler Group

1,732,727

1,864,060

1,982,371

2,144,347

2,145,872

2,293,872

561,145

32.4%

5.8%

2.5%

11

13 Mazda

1,327,881

1,423,460

1,619,898

1,724,378

1,746,766

1,827,489

499,608

37.6%

6.6%

2.2%

13

14 Mitsubishi Group

1,104,103

1,189,377

1,419,732

1,525,383

1,498,254

1,502,978

398,875

36.1%

6.4%

1.8%

15

943,756

979,823

1,110,975

1,303,174

1,385,152

1,466,287

522,531

55.4%

9.2%

2.3%

12

1,035,616
899,508

1,064,493
885,910

1,163,735
977,618

1,237,841
1,185,363

1,284,361
1,367,344

1,273,957
1,492,758

238,341
593,250

23.0%
66.0%

4.2%
10.7%

1.1%
2.6%

18
10

18 Great Wall

645,497

758,574

760,880

812,508

894,764

943,531

298,034

46.2%

7.9%

1.3%

17

19 Dong Feng

680,771

728,580

734,864

745,966

734,991

760,980

80,209

11.8%

2.3%

0.4%

28

20 Chery Auto

590,701

518,147

654,291

755,285

878,192

938,311

347,610

58.8%

9.7%

1.5%

16

Top 20 total assembly

74,696,054

77,290,635

81,514,524

86,941,183

91,736,540

95,424,679

20,728,625

27.8%

5.0%

92.2%

Top 20 total capacity

92,760,354

96,903,411

102,374,547

109,595,395 113,841,435

114,250,431

21,490,077

23.2%

4.3%

90.9%

Excess capacity

18,064,300

19,612,776

20,860,023

22,654,212

22,104,895

18,825,752

761,452

4.2%

0.8%

100.0%

80.5%

79.8%

79.6%

79.3%

80.6%

83.5%

Unit diff.

% chg

CAGR

5,729,959 4896.0%

118.6%

1 Toyota Group

15 Geely Group
16 Chang'an Group
17 Tata Group

Global utilisation (%)

Platform

CTG % Rank

2012

2013

2014

2015

2016

2017

117,033

1,052,806

2,024,485

4,227,384

5,573,664

5,846,992

25.5%

1

2 HD

2,476,850

2,864,858

2,902,775

2,878,964

3,023,216

3,242,786

765,936

30.9%

5.5%

3.4%

16

3 MC (Toyota Motor Corporation)

3,186,827

3,327,878

3,243,274

2,997,011

2,541,209

1,707,308

-1,479,519

-46.4%

-11.7%

-6.6%

385

4 C1/P1

2,081,575

2,400,903

2,237,893

2,396,493

2,364,356

2,464,502

382,927

18.4%

3.4%

1.7%

33

5 PQ35/46 (A5)

4,106,435

3,232,515

2,678,048

1,630,627

1,069,452

985,782

-3,120,653

-76.0%

-24.8%

-13.9%

386

6 X85/B

1,913,339

1,871,375

1,939,999

2,024,664

2,018,795

2,100,670

187,331

9.8%

1.9%

0.8%

54

7 GLOBAL DELTA

1,528,738

1,560,474

1,621,395

1,808,573

2,067,817

2,729,367

1,200,629

78.5%

12.3%

5.3%

7

8 NF

1,619,693

1,662,940

1,621,534

1,768,305

1,971,117

1,965,553

345,860

21.4%

3.9%

1.5%

36

9 HGSC

1,266,551

1,447,107

1,815,615

1,808,260

1,872,370

2,008,536

741,985

58.6%

9.7%

3.3%

17

866,609

1,393,223

1,530,607

1,753,717

2,123,744

2,231,576

1,364,967

157.5%

20.8%

6.1%

4

11 NBC

1,760,019

1,651,163

1,712,460

1,735,907

1,546,558

1,184,579

-575,440

-32.7%

-7.6%

-2.6%

381

12 MINICAB

1,458,294

1,496,369

1,486,542

1,502,337

1,494,700

1,568,384

110,090

7.5%

1.5%

0.5%

66

951,239

1,186,428

1,404,946

1,625,478

1,772,018

1,800,726

849,487

89.3%

13.6%

3.8%

14

14 CARRY

1,426,999

1,269,537

1,365,217

1,354,239

1,313,850

1,267,985

-159,014

-11.1%

-2.3%

-0.7%

355

15 150L

1,278,209

1,251,645

1,470,783

1,378,790

1,284,355

1,295,452

17,243

1.3%

0.3%

0.1%

134

16 X84/C

1,712,659

1,668,120

1,237,912

1,071,481

937,252

1,053,111

-659,548

-38.5%

-9.3%

-2.9%

382

17 B0 (Renault)

1,006,884

1,150,378

1,172,712

1,299,304

1,466,716

1,582,058

575,174

57.1%

9.5%

2.6%

24

18 FIAT/GM 199/4400

1,344,607

1,294,877

1,330,435

1,348,548

977,569

908,544

-436,063

-32.4%

-7.5%

-1.9%

373

19 MLB

1,001,953

1,063,384

1,130,168

1,208,039

1,247,614

1,462,622

460,669

46.0%

7.9%

2.0%

27

20 IMV

1,134,149

1,103,028

1,136,577

1,159,559

1,175,258

1,202,112

67,963

6.0%

1.2%

0.3%

87

32,238,662

33,949,008

35,063,377

36,977,680

37,841,630

38,608,645

6,369,983

19.8%

3.7%

28.3%

40.7%

41.5%

40.5%

40.0%

38.7%

38.0%

28.3%

1 MQB

10 GLOBAL GAMMA

13 B2E

Top 20 total assembly
Top 20 (% of global total)

7

Autofacts October 2013

CTG % Rank

For more information please visit us at www.autofacts.com
Analyst Note Plus

Baseline assembly forecast data - Global
Growth analytics (2012-2017)
Brand

2012

2013

2014

2015

2016

2017

Unit diff.

% chg

CAGR

1 Toyota

8,227,545

8,271,188

8,367,027

8,460,881

8,572,841

8,766,240

538,695

6.5%

1.3%

2.4%

10

2 Volkswagen

6,265,324

6,477,696

6,532,405

7,015,506

7,494,991

7,645,970

1,380,646

22.0%

4.1%

6.1%

3

3 Ford

5,371,299

5,965,254

6,169,705

6,605,414

6,898,364

7,086,488

1,715,189

31.9%

5.7%

7.6%

1

4 Chevrolet

4,850,991

5,114,329

5,475,092

5,781,409

6,141,961

6,353,937

1,502,946

31.0%

5.5%

6.7%

2

5 Nissan

4,618,921

4,637,039

5,161,325

5,378,728

5,370,883

5,476,366

857,445

18.6%

3.5%

3.8%

6

6 Hyundai

4,465,491

4,694,422

4,926,928

4,962,462

5,245,108

5,521,091

1,055,600

23.6%

4.3%

4.7%

5

7 Honda

3,823,990

4,162,206

4,722,123

4,991,291

4,970,857

5,075,245

1,251,255

32.7%

5.8%

5.6%

4

8 Kia

2,700,661

2,805,246

2,853,117

2,949,761

3,110,401

3,177,150

476,489

17.6%

3.3%

2.1%

16

9 Renault

2,124,621

2,057,784

2,098,533

2,344,529

2,653,007

2,740,043

615,422

29.0%

5.2%

2.7%

9

10 Peugeot

1,812,031

1,828,337

1,906,724

2,038,037

2,148,825

2,215,384

403,353

22.3%

4.1%

1.8%

17

11 Fiat

1,873,105

1,748,878

1,691,534

1,865,835

2,241,599

2,390,468

517,363

27.6%

5.0%

2.3%

13

12 Mercedes-Benz

1,624,676

1,772,002

1,887,606

1,994,294

1,990,951

2,148,261

523,585

32.2%

5.7%

2.3%

12

13 BMW

1,603,075

1,708,872

1,760,604

1,842,465

1,898,369

1,972,730

369,655

23.1%

4.2%

1.6%

19

14 Audi

1,469,197

1,601,384

1,703,028

1,850,000

1,894,584

2,004,078

534,881

36.4%

6.4%

2.4%

11

15 Mazda

1,327,881

1,423,460

1,619,898

1,724,378

1,746,766

1,827,489

499,608

37.6%

6.6%

2.2%

14

16 Suzuki

1,460,480

1,397,280

1,523,926

1,556,303

1,573,492

1,600,919

140,439

9.6%

1.9%

0.6%

42

17 Citroen

1,267,538

1,331,089

1,466,194

1,582,482

1,629,766

1,759,801

492,263

38.8%

6.8%

2.2%

15

18 Wuling

1,383,305

1,403,522

1,450,579

1,462,938

1,449,767

1,520,944

137,639

10.0%

1.9%

0.6%

43

19 Mitsubishi

1,030,404

1,091,331

1,307,396

1,419,515

1,399,817

1,407,209

376,805

36.6%

6.4%

1.7%

18

875,260

1,032,722

1,060,289

1,216,206

1,516,421

1,547,200

671,940

76.8%

12.1%

3.0%

8

58,175,795

60,524,041

63,684,033

67,042,434

69,948,770

72,237,013

14,061,218

24.2%

4.4%

62.6%

73.4%

74.0%

73.5%

72.5%

71.6%

71.0%

62.6%

20 Buick
Top 20 total assembly
Top 20 (% of global total)

Brand Nameplate

CTG % Rank

2012

2013

2014

2015

2016

2017

Unit diff.

% chg

CAGR

1 Toyota Corolla

1,198,249

1,170,453

1,263,224

1,229,445

1,210,340

1,262,997

64,748

5.4%

1.1%

0.3%

2 Ford Focus

1,040,077

1,129,343

995,605

932,617

1,054,209

1,127,210

87,133

8.4%

1.6%

0.4%

77

3 Ford F-Series

843,933

919,729

1,005,660

902,832

900,534

898,655

54,722

6.5%

1.3%

0.2%

164

4 Toyota Camry

858,421

869,499

859,040

885,685

909,514

905,243

46,822

5.5%

1.1%

0.2%

198

5 Hyundai Elantra/i30

764,844

848,300

809,436

786,054

833,925

951,760

186,916

24.4%

4.5%

0.8%

13

6 Ford Fiesta

715,832

738,415

744,515

800,067

884,818

911,348

195,516

27.3%

4.9%

0.9%

11

7 Volkswagen Golf

626,208

625,196

751,348

899,098

929,705

927,212

301,004

48.1%

8.2%

1.3%

3

8 Chevrolet Cruze

769,470

734,015

745,464

750,894

783,559

775,603

6,133

0.8%

0.2%

0.0%

671

9 Honda CR-V

698,421

755,687

732,287

708,466

742,042

759,634

61,213

8.8%

1.7%

0.3%

138

10 Honda Civic

717,377

717,557

702,871

704,883

688,399

711,500

-5,877

-0.8%

-0.2%

0.0% 1223

11 Volkswagen Polo

668,642

648,143

650,729

656,977

758,350

795,367

126,725

19.0%

3.5%

0.6%

12 Volkswagen Passat

604,468

589,736

586,680

646,510

710,959

720,783

116,315

19.2%

3.6%

0.5%

43

13 Toyota Hilux Vigo

622,860

610,336

618,250

627,410

630,375

648,206

25,346

4.1%

0.8%

0.1%

350

14 Honda Accord

546,470

650,989

644,158

629,568

647,501

637,089

90,619

16.6%

3.1%

0.4%

75

15 Hyundai Sonata/i40

549,618

524,553

520,309

538,938

619,641

630,478

80,860

14.7%

2.8%

0.4%

87

16 Hyundai Tucson/iX35

554,374

556,181

502,803

520,611

548,174

591,701

37,327

6.7%

1.3%

0.2%

257

17 Chevrolet Silverado

508,821

544,182

563,009

557,899

542,655

555,155

46,334

9.1%

1.8%

0.2%

201

18 Toyota Prius

497,279

564,866

530,193

539,133

533,252

538,900

41,621

8.4%

1.6%

0.2%

229

19 Wuling Sunshine

523,274

489,196

510,193

531,231

540,363

569,756

46,482

8.9%

1.7%

0.2%

200

20 Chang'an SC63/10 Series

500,466

445,529

514,137

498,217

512,854

450,694

-49,772

-9.9%

-2.1%

-0.2% 1407

13,809,104

14,131,905

14,249,911

14,346,535

14,981,169

15,369,291

1,560,187

11.3%

2.2%

6.9%

17.4%

17.3%

16.5%

15.5%

15.3%

15.1%

6.9%

Top 20 total assembly
Top 20 (% of global total)

8

Autofacts October 2013

CTG % Rank
128

37

For more information please visit us at www.autofacts.com
Analyst Note Plus

Baseline forecast data – Global powertrain
Growth analytics (2012-2017)
Engine family [designer]

2012

2013

2014

2015

2016

2017

Unit diff.

1 EA111/112 [VW]

3,414,936

3,356,226

3,266,139

3,230,542

3,405,180

3,468,237

53,301

1.6%

4.3%

3.4%

2 S [Renault-Nissan]

1,756,871

2,127,014

2,808,964

3,420,220

3,671,494

3,810,050

2,053,179

116.9%

2.2%

3.7%

3 EA827/113/888 [VW]

2,598,229

2,665,235

2,679,033

2,760,162

2,765,665

2,866,637

268,408

10.3%

3.3%

2.8%

4 ZR [Toyota]

2,148,885

2,291,669

2,500,852

2,550,732

2,560,730

2,610,486

461,601

21.5%

2.7%

2.6%

5 MZR/DURATEC HE [Mazda]

1,805,436

2,336,083

2,442,014

2,659,292

2,736,796

2,674,534

869,098

48.1%

2.3%

2.6%

6 EA086/153/188 [VW]

2,282,942

2,169,089

2,276,353

2,453,432

2,530,271

2,560,066

277,124

12.1%

2.9%

2.5%

7 THETA II [Hyundai]

1,890,154

2,200,145

2,258,047

2,421,793

2,696,162

2,706,911

816,757

43.2%

2.4%

2.7%

8 K [Renault]

1,943,259

1,897,181

1,828,708

1,857,900

2,069,408

2,258,459

315,200

16.2%

2.5%

2.2%

9 GAMMA [Hyundai]

1,772,230

1,842,755

1,965,435

1,932,504

2,055,027

2,196,655

424,425

23.9%

2.2%

2.2%

10 BDOHC [GM Korea]

2,215,959

2,165,925

2,251,687

1,864,963

1,574,707

1,592,304

-623,655

-28.1%

2.8%

1.6%

21,828,901

23,051,322

24,277,232

25,151,540

26,065,440

26,744,339

4,915,438

22.5%

27.5%

26.3%

27.5%

28.2%

28.0%

27.2%

26.7%

26.3%

21.9%

2017

Unit diff.

Top 10 total consumption
Top 10 (% of total consumption)

Engine size

% chg 2012 share 2017 share

2012

2013

2014

2015

2016

1 1001-1600 cc

30,149,695

30,770,538

33,006,549

35,560,069

38,688,008

40,751,424 10,601,729

35.2%

38.0%

40.1%

2 1601-2000 cc

17,015,238

18,412,102

19,371,580

20,646,661

21,148,932

21,947,148

4,931,910

29.0%

21.5%

21.6%

3 2001-3000 cc

14,705,773

14,888,044

15,682,133

16,695,787

17,378,671

17,726,767

3,020,994

20.5%

18.6%

17.4%

4 0000-1000 cc

7,574,307

7,885,250

8,647,673

9,764,231

10,611,788

11,175,270

3,600,963

47.5%

9.6%

11.0%

5 3001-4000 cc

6,414,192

6,316,974

6,169,579

6,087,014

5,997,114

5,998,222

-415,970

-6.5%

8.1%

5.9%

6 4001-9999 cc

3,263,626

3,335,510

3,192,739

3,028,066

3,008,237

3,101,208

-162,418

-5.0%

4.1%

3.0%

126,803

223,098

517,253

751,644

922,686

1,029,385

902,582

711.8%

0.2%

1.0%

79,249,634

81,831,516

86,587,506

92,533,472

97,755,436

101,729,424 22,479,790

28.4%

100.0%

100.0%

7 Electric
Total consumption

Fuel type

2012

2013

2014

2015

2016

1 Combustion Gasoline

61,779,916

63,855,123

67,292,024

71,558,019

75,191,834

78,018,013 16,238,097

26.3%

78.0%

76.7%

2 Combustion Diesel

15,292,829

15,217,745

15,752,418

16,724,752

17,626,980

18,283,540

2,990,711

19.6%

19.3%

18.0%

3 Hybrid (Mild+Full)

1,999,550

2,416,983

2,809,404

3,025,169

3,331,384

3,532,537

1,532,987

76.7%

2.5%

3.5%

177,339

341,665

733,660

1,225,532

1,605,238

1,895,334

1,717,995

968.8%

0.2%

1.9%

79,249,634

81,831,516

86,587,506

92,533,472

97,755,436

101,729,424 22,479,790

28.4%

100.0%

100.0%

4 PEV+PHEV (Electric)
Total consumption

Transmission outlook

2017

Unit diff.

% chg 2012 share 2017 share

% chg 2012 share 2017 share

2012

2013

2014

2015

2016

2017

Unit diff.

1 Manual

39,152,396

39,052,823

40,698,632

42,988,328

45,251,460

46,982,459

7,830,063

20.0%

49.4%

46.2%

2 Automatic

28,487,636

29,106,005

29,857,143

30,888,524

31,662,127

32,155,958

3,668,322

12.9%

35.9%

31.6%

3 Continuously Variable

7,981,726

9,022,516

10,141,040

10,588,283

10,852,375

11,748,211

3,766,485

47.2%

10.1%

11.5%

4 Automated Manual Double Clutch

2,713,382

3,598,498

4,429,636

6,240,362

7,938,564

8,620,185

5,906,803

217.7%

3.4%

8.5%

5 Automated Manual

747,186

751,928

821,454

921,636

948,034

966,354

219,168

29.3%

0.9%

0.9%

6 Electric

159,725

285,797

612,280

870,393

1,066,327

1,216,508

1,056,783

661.6%

0.2%

1.2%

7,583

13,949

27,321

35,946

36,549

39,749

32,166

424.2%

0.0%

0.0%

79,249,634

81,831,516

86,587,506

92,533,472

97,755,436

101,729,424 22,479,790

28.4%

100.0%

100.0%

7 Automatic Hybrid
Total consumption

Gear outlook

% chg 2012 share 2017 share

2012

2013

2014

2015

2016

2017

Unit diff.

1 5

33,271,625

31,894,051

31,766,442

32,503,283

33,443,665

33,942,182

670,557

2.0%

42.0%

33.4%

2 6

25,798,685

28,421,387

30,242,886

31,361,705

32,862,715

33,375,583

7,576,898

29.4%

32.6%

32.8%

3 Continuously Variable

7,981,726

9,022,516

10,141,040

10,588,283

10,852,375

11,748,211

3,766,485

47.2%

10.1%

11.5%

4 4

8,165,088

6,828,777

6,548,392

6,520,060

6,330,262

6,508,562 -1,656,526

-20.3%

10.3%

6.4%

5 8 or more

1,641,332

2,676,620

3,895,200

5,794,600

7,008,090

8,245,573

6,604,241

402.4%

2.1%

8.1%

6 7

2,129,034

2,601,317

3,189,081

4,700,574

5,999,997

6,500,319

4,371,285

205.3%

2.7%

6.4%

262,144

386,848

804,465

1,064,967

1,258,332

1,408,994

1,146,850

437.5%

0.3%

1.4%

79,249,634

81,831,516

86,587,506

92,533,472

97,755,436

101,729,424 22,479,790

28.4%

100.0%

100.0%

7 3 or less
Total consumption

9

Autofacts October 2013

% chg 2012 share 2017 share

For more information please visit us at www.autofacts.com
Analyst Note Plus

Baseline assembly forecast data – North America

1
2
3
4
5
6
7
8
9
10

1
2
3
4
5
6
7
8
9
10

1
2
3
4
5
6
7
8
9
10

1
2
3
4
5
6
7
8
9
10

10

Alliance group
GM Group
Ford Group
Fiat Group
Toyota Group
Honda Group
Renault-Nissan
Hyundai Group
VW Group
BMW Group
Daimler Group
Top 10 total assembly
Top 10 total capacity
Excess capacity
Utilisation (%)

Growth analytics
Unit diff.
% chg
528,073
16.3%
307,322
11.0%
358,513
15.2%
346,619
17.7%
160,764
9.5%
378,615
29.1%
345,616
48.0%
279,988
37.1%
9,456
3.1%
91,089
47.7%
2,806,055
18.3%
3,936,516
24.6%
1,130,461 157.1%

(2012-2017)
CAGR CTG % Rank
3.1%
17.5%
1
2.1%
10.2%
6
2.9%
11.9%
3
3.3%
11.5%
4
1.8%
5.3%
8
5.2%
12.6%
2
8.2%
11.5%
5
6.5%
9.3%
7
0.6%
0.3%
13
8.1%
3.0%
10
3.4%
93.2%
4.5%
94.9%
20.8% 100.0%

2017
651,173
1,086,592
879,899
724,166
781,156
576,577
735,037
939,354
199,989
516,001
7,089,944
38.5%

Unit diff.
-436,058
1,086,592
357,509
65,419
200,606
99,505
629,029
571,941
-547,025
94,412
2,121,930
70.5%

% chg
-40.1%
0.0%
68.4%
9.9%
34.6%
20.9%
593.4%
155.7%
-73.2%
22.4%
42.7%

CAGR
-9.7%
0.0%
11.0%
1.9%
6.1%
3.9%
47.3%
20.7%
-23.2%
4.1%
7.4%

CTG % Rank
-14.5%
83
36.1%
1
11.9%
8
2.2%
28
6.7%
14
3.3%
23
20.9%
5
19.0%
6
-18.2%
84
3.1%
25
70.5%

2016
2,861,965
2,488,787
1,810,730
1,623,551
1,633,605
963,225
907,862
433,539
564,859
666,248
13,954,371
78.1%

2017
2,898,000
2,532,967
1,880,902
1,632,965
1,626,302
1,049,423
885,207
426,868
604,034
728,780
14,265,448
77.5%

Unit diff.
178,599
263,235
194,605
117,997
359,440
334,775
129,531
-283,126
65,025
269,341
1,629,422
54.1%

% chg
6.6%
11.6%
11.5%
7.8%
28.4%
46.8%
17.1%
-39.9%
12.1%
58.6%
12.9%

CAGR
1.3%
2.2%
2.2%
1.5%
5.1%
8.0%
3.2%
-9.7%
2.3%
9.7%
2.5%

CTG % Rank
5.9%
8
8.7%
4
6.5%
6
3.9%
12
11.9%
1
11.1%
2
4.3%
10
-9.4%
33
2.2%
19
8.9%
3
54.1%

2016
889,487
539,262
460,093
450,767
401,818
376,833
356,081
339,266
342,816
331,216
4,487,639
25.1%

2017
887,480
551,422
516,001
474,471
383,819
392,167
371,404
361,934
340,284
337,143
4,616,125
25.1%

Unit diff.
52,814
46,039
94,412
21,508
-16,324
-3,720
6,067
30,633
5,574
-18,721
218,282
7.3%

% chg
6.3%
9.1%
22.4%
4.7%
-4.1%
-0.9%
1.7%
9.2%
1.7%
-5.3%
5.0%

CAGR
1.2%
1.8%
4.1%
0.9%
-0.8%
-0.2%
0.3%
1.8%
0.3%
-1.1%
1.0%

CTG % Rank
1.8%
28
1.5%
33
3.1%
16
0.7%
65
-0.5% 179
-0.1% 160
0.2% 107
1.0%
55
0.2% 113
-0.6% 182
7.3%

2012
3,233,624
2,804,933
2,362,712
1,957,777
1,690,235
1,299,613
719,547
755,676
301,522
191,138
15,316,777
16,036,254
719,477
95.5%

2013
3,353,386
3,097,854
2,378,365
2,033,206
1,746,421
1,506,247
772,250
692,254
294,978
200,360
16,075,321
17,496,197
1,420,876
91.9%

2014
3,555,004
3,095,074
2,454,763
2,094,721
1,808,869
1,665,693
785,329
623,854
329,398
231,797
16,644,502
18,431,696
1,787,194
90.3%

2015
3,639,624
3,049,890
2,527,266
2,198,890
1,831,129
1,724,857
812,361
842,641
333,285
291,505
17,251,448
19,240,881
1,989,433
89.7%

2016
3,643,931
3,072,439
2,568,452
2,182,037
1,845,262
1,685,712
1,016,748
1,005,165
320,031
269,067
17,608,844
19,867,052
2,258,208
88.6%

2017
3,761,697
3,112,255
2,721,225
2,304,396
1,850,999
1,678,228
1,065,163
1,035,664
310,978
282,227
18,122,832
19,972,770
1,849,938
90.7%

2012
1,087,231
0
522,390
658,747
580,550
477,072
106,008
367,413
747,014
421,589
4,968,014
32.3%

2013
1,202,887
392,098
741,455
712,974
574,080
593,395
400,516
375,492
690,759
445,699
6,129,355
37.9%

2014
1,232,624
1,002,933
730,432
799,792
620,366
558,823
551,842
387,485
623,854
502,190
7,010,341
41.8%

2015
1,313,876
1,083,075
724,019
716,284
658,052
599,773
743,843
445,827
398,051
481,511
7,164,311
41.0%

2016
1,036,343
1,039,999
863,983
707,519
805,394
587,085
728,133
484,469
199,237
460,093
6,912,255
38.7%

Brand
Ford
Chevrolet
Toyota
Honda
Nissan
Jeep
Volkswagen
Dodge
GMC
Hyundai
Top 10 total assembly
Top 10 (% of regional total)

2012
2,719,401
2,269,732
1,686,297
1,514,968
1,266,862
714,648
755,676
709,994
539,009
459,439
12,636,026
82.1%

2013
2,995,933
2,321,941
1,780,370
1,590,046
1,457,980
726,755
692,254
752,710
579,508
504,933
13,402,430
82.9%

2014
2,960,218
2,460,237
1,816,785
1,629,393
1,623,200
891,250
623,854
592,601
587,274
520,438
13,705,250
81.6%

2015
2,893,452
2,480,018
1,860,702
1,652,297
1,686,448
932,263
842,641
567,238
590,743
516,613
14,022,415
80.2%

Brand nameplate
Ford F-Series
Chevrolet Silverado
Ram Pickup
Toyota Camry
Honda Accord
Honda Civic
Toyota Corolla
Ford Escape
Nissan Altima
Honda CR-V
Top 10 total assembly
Top 10 (% of regional total)

2012
834,666
505,383
421,589
452,963
400,143
395,887
365,337
331,301
334,710
355,864
4,397,843
28.6%

2013
911,755
541,875
445,699
458,683
452,927
436,668
333,685
377,724
388,225
393,999
4,741,240
29.3%

2014
995,721
559,482
502,190
446,077
411,626
401,553
386,216
360,271
360,048
352,140
4,775,324
28.4%

2015
893,225
554,133
481,511
474,106
392,213
391,886
372,556
355,503
349,121
334,172
4,598,426
26.3%

Platform
MC (Toyota Motor Corporation)
K2XX
C1/P1
T1 (Ford Motor Company)
NF
D (Renault-Nissan)
CD4
GLOBAL DELTA
PQ35/46 (A5)
DS
Top 10 total assembly
Top 10 (% of regional total)

Autofacts October 2013

For more information please visit us at www.autofacts.com
Analyst Note Plus

Baseline assembly forecast data – South America

1
2
3
4
5
6
7
8
9
10

1
2
3
4
5
6
7
8
9
10

1
2
3
4
5
6
7
8
9
10

1
2
3
4
5
6
7
8
9
10

11

Growth analytics
Unit diff.
% chg
267,606
28.3%
294,777
34.3%
148,191
18.8%
94,295
19.3%
162,044
44.0%
145,089
61.9%
170,987 205.4%
68,602
40.5%
157,301 160.1%
125,016 796.6%
1,633,908
40.3%
2,236,888
41.6%
602,980
45.5%

(2012-2017)
CAGR CTG % Rank
5.1%
14.0%
2
6.1%
15.4%
1
3.5%
7.7%
6
3.6%
4.9%
10
7.6%
8.5%
4
10.1%
7.6%
7
25.0%
8.9%
3
7.0%
3.6%
12
21.1%
8.2%
5
55.1%
6.5%
8
7.0%
85.3%
7.2%
81.5%
7.8% 100.0%

Alliance group
VW Group
Fiat Group
GM Group
Renault-Nissan
Ford Group
PSA Group
Hyundai Group
Toyota Group
Honda Group
Chery Auto
Top 10 total assembly
Top 10 total capacity
Excess capacity
Utilisation (%)

2012
945,427
858,874
787,834
488,987
368,215
234,408
83,229
169,369
98,237
15,694
4,050,274
5,376,277
1,326,003
75.3%

2013
963,893
805,401
913,483
408,550
395,117
303,274
188,094
177,308
175,580
46,588
4,377,288
6,107,207
1,729,919
71.7%

2014
962,273
780,153
918,870
466,714
480,723
289,886
214,813
190,842
173,393
74,303
4,551,970
6,531,345
1,979,375
69.7%

2015
1,054,626
841,067
916,643
527,510
505,577
361,694
251,019
203,303
176,672
82,436
4,920,547
7,110,641
2,190,094
69.2%

2016
1,170,058
1,055,056
923,681
548,698
518,043
367,311
254,380
216,431
235,893
129,554
5,419,105
7,525,440
2,106,335
72.0%

2017
1,213,033
1,153,651
936,025
583,282
530,259
379,497
254,216
237,971
255,538
140,710
5,684,182
7,613,165
1,928,983
74.7%

Platform
PQ24 (AO4)
FIAT/GM 199/4400
GLOBAL GAMMA
B2E
GM4200
B0 (Renault)
PQ25 (AO5)
HGSC
PF1
X85/B
Top 10 total assembly
Top 10 (% of regional total)

2012
759,551
500,063
97,798
41,209
420,106
297,760
69,306
33,010
57,750
92,450
2,369,003
56.8%

2013
775,680
507,615
365,608
138,127
280,030
159,656
70,515
150,439
119,481
120,507
2,687,658
59.7%

2014
738,414
583,148
420,730
319,918
242,089
167,782
130,790
175,944
117,122
107,536
3,003,473
63.8%

2015
572,389
632,438
462,171
369,831
207,421
186,324
286,503
181,674
157,166
124,226
3,180,143
61.1%

2016
578,646
663,040
458,936
375,402
216,914
186,893
293,735
177,201
158,858
132,810
3,242,435
56.1%

2017
597,302
680,860
512,863
375,406
220,362
196,439
301,448
171,854
118,939
140,887
3,316,360
54.5%

Unit diff.
-162,249
180,797
415,065
334,197
-199,744
-101,321
232,142
138,844
61,189
48,437
947,357
49.4%

% chg
-21.4%
36.2%
424.4%
811.0%
-47.5%
-34.0%
335.0%
420.6%
106.0%
52.4%
40.0%

CAGR
-4.7%
6.4%
39.3%
55.6%
-12.1%
-8.0%
34.2%
39.1%
15.5%
8.8%
7.0%

CTG % Rank
-8.5%
93
9.4%
5
21.7%
1
17.4%
2
-10.4%
95
-5.3%
91
12.1%
4
7.2%
7
3.2%
13
2.5%
17
49.4%

Brand
Volkswagen
Chevrolet
Fiat
Ford
Renault
Peugeot
Toyota
Hyundai
Honda
Citroen
Top 10 total assembly
Top 10 (% of regional total)

2012
945,427
787,834
843,561
368,215
422,171
148,033
169,369
71,554
98,237
86,375
3,940,776
94.5%

2013
963,893
913,483
784,090
395,117
378,824
180,201
177,308
176,726
175,580
123,073
4,268,295
94.8%

2014
962,273
918,870
744,820
480,723
375,148
172,264
190,842
202,976
173,393
117,622
4,338,931
92.1%

2015
1,019,863
916,643
801,762
505,577
414,107
228,343
203,303
239,274
176,672
133,351
4,638,895
89.2%

2016
1,114,418
923,681
928,025
518,043
433,502
233,048
216,431
242,347
235,893
134,263
4,979,651
86.2%

2017
1,154,030
936,025
1,020,378
530,259
460,280
238,975
237,971
242,080
255,538
140,522
5,216,058
85.7%

Unit diff.
208,603
148,191
176,817
162,044
38,109
90,942
68,602
170,526
157,301
54,147
1,275,282
66.5%

% chg
22.1%
18.8%
21.0%
44.0%
9.0%
61.4%
40.5%
238.3%
160.1%
62.7%
32.4%

CAGR
4.1%
3.5%
3.9%
7.6%
1.7%
10.1%
7.0%
27.6%
21.1%
10.2%
5.8%

CTG % Rank
10.9%
1
7.7%
6
9.2%
2
8.5%
4
2.0%
17
4.7%
8
3.6%
12
8.9%
3
8.2%
5
2.8%
15
66.5%

Brand nameplate
Volkswagen Gol
Fiat Uno
Fiat Palio
Chevrolet Onix
Volkswagen Fox
Ford Fiesta
Hyundai HB20
Fiat Siena
Fiat Strada
Ford Ka
Top 10 total assembly
Top 10 (% of regional total)

2012
402,001
262,653
193,324
13,333
197,932
109,950
33,010
100,821
130,087
91,025
1,534,136
36.8%

2013
405,152
192,933
203,717
205,547
206,494
155,676
150,439
106,450
110,785
40,416
1,777,609
39.5%

2014
430,619
179,145
203,923
231,363
200,567
183,147
142,981
97,875
103,238
104,330
1,877,188
39.9%

2015
423,545
223,120
203,485
255,071
192,382
139,474
144,428
108,965
93,814
131,787
1,916,071
36.8%

2016
431,840
281,365
196,509
253,599
194,710
136,056
138,457
111,200
94,572
122,371
1,960,679
33.9%

2017
443,059
289,874
210,272
245,604
204,752
143,346
134,946
119,880
103,383
119,428
2,014,544
33.1%

Unit diff.
% chg
41,058
10.2%
27,221
10.4%
16,948
8.8%
232,271 1742.1%
6,820
3.4%
33,396
30.4%
101,936 308.8%
19,059
18.9%
-26,704
-20.5%
28,403
31.2%
480,408
31.3%
25.1%

CAGR
2.0%
2.0%
1.7%
79.1%
0.7%
5.4%
32.5%
3.5%
-4.5%
5.6%
5.6%

CTG % Rank
2.1%
15
1.4%
36
0.9%
54
12.1%
1
0.4%
78
1.7%
26
5.3%
2
1.0%
53
-1.4% 164
1.5%
33
25.1%

Autofacts October 2013

For more information please visit us at www.autofacts.com
Analyst Note Plus

Baseline forecast data – North and South America
North America: fuel type and delivery by % share
2012 - 2017

North America: weighted engine displacement
2012 - 2017 (cubic centimeters)

70%

3,200

50%

80%

3,300

60%

100%

3,100

60%

40%

40%

30%
20%

20%

3,000
2,900

10%
0%

0%
2012

2013

Gasoline

2014

Diesel

2015

Hybrid

2016

PEV+PHEV

2,800
2,700
2012

2017

2013

2014

2015

2016

2017

DI
Growth analytics (2012-2017)

Transmission outlook

2012

2013

2014

2015

2016

2017

Unit diff.

12,182,823

12,402,325

12,432,275

12,657,407

12,640,350

12,438,793

255,970

2.1%

79.1%

67.6%

2 Continuously Variable

1,268,622

1,827,971

2,279,463

2,413,187

2,492,063

3,029,426

1,760,804

138.8%

8.2%

16.5%

3 Manual

1,264,125

1,149,347

1,156,915

1,072,466

1,018,436

998,991

-265,134

-21.0%

8.2%

5.4%

639,985

675,519

775,139

1,172,113

1,503,160

1,648,421

1,008,436

157.6%

4.2%

9.0%

40,428

98,723

134,362

164,525

189,104

243,714

203,286

502.8%

0.3%

1.3%

6 Automated Manual

0

5,239

11,753

12,508

28,004

46,914

46,914

0.0%

0.0%

0.3%

Total consumption

15,395,983

16,159,124

16,789,907

17,492,206

17,871,117

18,406,259

3,010,276

19.6%

100.0%

100.0%

1 Automatic

4 Automated Manual Double Clutch
5 Electric

South America: fuel type and delivery by % share
2012 - 2017

% chg 2012 share

2017 share

South America: weighted engine displacement
2012 - 2017 (cubic centimeters)

100%

30%

80%

1,550

25%
20%

60%

1,500

15%
40%

10%

20%

1,450

5%

0%

0%
2012

2013

Gasoline

2014

Diesel

2015

Hybrid

2016

PEV+PHEV

1,400
2012

2017

2013

2014

2015

2016

2017

DI

Growth analytics (2012-2017)
Transmission outlook
1 Manual

2012

2013

2014

2015

2016

2017

Unit diff.

3,843,719

4,087,869

4,177,704

4,479,726

4,865,045

5,011,904

1,168,185

30.4%

92.1%

82.3%

301,427

339,758

372,368

415,732

438,781

446,635

145,208

48.2%

7.2%

7.3%

7,017

20,274

49,083

116,637

186,190

308,282

301,265

4293.4%

0.2%

5.1%

15,884

23,573

46,787

112,692

153,461

163,725

147,841

930.8%

0.4%

2.7%

3,511

33,008

64,662

77,493

135,433

157,495

153,984

4385.8%

0.1%

2.6%

4,171,558

4,504,482

4,710,604

5,202,280

5,778,910

6,088,041

1,916,483

45.9%

100.0%

100.0%

2 Automatic
3 Automated Manual Double Clutch
4 Automated Manual
5 Continuously Variable
Total consumption

12

Autofacts October 2013

% chg 2012 share

2017 share

For more information please visit us at www.autofacts.com
Analyst Note Plus

Baseline assembly forecast data – European Union

1
2
3
4
5
6
7
8
9
10

1
2
3
4
5
6
7
8
9
10

1
2
3
4
5
6
7
8
9
10

1
2
3
4
5
6
7
8
9
10

13

Alliance group
VW Group
PSA Group
Renault-Nissan
Daimler Group
BMW Group
Ford Group
Fiat Group
GM Group
Hyundai Group
Toyota Group
Top 10 total assembly
Top 10 total capacity
Excess capacity
Utilisation (%)

2012
4,425,041
1,976,462
1,908,864
1,347,801
1,358,509
1,064,178
872,044
941,952
533,105
364,796
14,792,752
19,950,013
5,157,261
74.1%

2013
4,414,119
1,971,636
1,810,585
1,452,506
1,407,606
1,055,358
751,624
869,306
539,708
436,446
14,708,894
19,515,468
4,806,574
75.4%

2014
4,612,643
2,089,303
1,830,357
1,521,981
1,366,649
1,069,224
795,147
869,257
549,798
474,414
15,178,773
20,023,210
4,844,437
75.8%

2015
4,934,571
2,118,632
1,998,831
1,543,514
1,464,323
1,112,521
1,162,571
934,070
516,781
474,312
16,260,126
20,270,634
4,010,508
80.2%

2016
4,968,437
2,196,052
2,172,446
1,527,397
1,583,237
1,100,364
1,369,197
1,173,376
508,048
448,098
17,046,652
20,571,064
3,524,412
82.9%

2017
4,990,353
2,277,239
2,164,847
1,620,438
1,665,638
1,066,591
1,397,491
1,271,016
537,342
443,467
17,434,422
20,448,139
3,013,717
85.3%

Platform
MQB
PQ35/46 (A5)
PF1
MLB
C1/P1
L7
PF2
X85/B
HD
MFA
Top 10 total assembly
Top 10 (% of regional total)

2012
117,033
2,116,969
695,211
665,667
559,289
446,566
807,002
544,391
457,033
210,068
6,619,229
41.6%

2013
996,184
1,169,800
831,259
691,200
576,974
572,557
669,678
554,143
476,500
388,466
6,926,761
43.9%

2014
1,615,095
866,045
841,040
750,875
601,467
588,794
498,974
491,441
488,955
487,603
7,230,289
44.4%

2015
2,761,174
342,605
829,629
812,969
570,501
539,577
492,126
461,530
458,099
515,924
7,784,134
44.5%

2016
3,090,747
258,538
792,622
744,699
538,328
545,857
381,069
443,535
436,384
465,708
7,697,487
42.0%

2017
3,234,148
156,338
660,000
877,261
515,080
518,327
293,962
464,781
452,264
454,925
7,627,086
40.7%

Brand
Volkswagen
Mercedes-Benz
Audi
Peugeot
BMW
Ford
Renault
Opel-Vauxhall
Citroen
Fiat
Top 10 total assembly
Top 10 (% of regional total)

2012
2,207,927
1,248,900
1,132,784
1,099,757
1,043,732
1,064,178
996,573
941,952
876,705
649,723
11,262,231
70.8%

2013
2,141,211
1,361,993
1,177,393
1,117,942
1,072,924
1,055,358
880,307
869,306
853,694
550,208
11,080,336
70.3%

2014
2,219,125
1,428,703
1,192,421
1,163,889
1,051,263
1,069,224
899,193
869,257
925,414
547,064
11,365,553
69.9%

2015
2,371,488
1,394,937
1,263,588
1,156,580
1,111,305
1,112,521
1,008,205
915,102
962,052
699,322
11,995,100
68.6%

2016
2,465,026
1,373,749
1,165,334
1,208,529
1,172,508
1,100,364
1,150,120
1,092,827
987,523
819,576
12,535,556
68.3%

Brand nameplate
Volkswagen Golf
Ford Fiesta
Opel-Vauxhall Corsa
BMW 3 Series
Peugeot 208
Volkswagen Polo
Opel-Vauxhall Astra
Nissan Qashqai
Volkswagen Passat
Ford Focus
Top 10 total assembly
Top 10 (% of regional total)

2012
475,804
350,332
294,441
339,920
241,672
287,289
299,757
310,837
236,687
289,079
3,125,818
19.6%

2013
495,763
338,969
278,923
360,568
294,887
262,756
223,797
288,364
227,254
259,671
3,030,952
19.2%

2014
598,546
308,310
269,955
289,174
293,541
257,263
205,529
239,825
212,678
240,757
2,915,578
17.9%

2015
589,599
336,401
247,174
249,354
288,910
252,525
235,963
247,669
274,282
230,918
2,952,795
16.9%

2016
582,680
389,522
304,500
229,653
290,525
284,291
320,568
241,147
294,393
216,465
3,153,744
17.2%

Autofacts October 2013

Growth analytics (2012-2017)
Unit diff.
% chg
CAGR CTG % Rank
565,312
12.8%
2.4%
19.9%
1
300,777
15.2%
2.9%
10.6%
5
255,983
13.4%
2.5%
9.0%
7
272,637
20.2%
3.8%
9.6%
6
307,129
22.6%
4.2%
10.8%
4
2,413
0.2%
0.0%
0.1%
17
525,447
60.3%
9.9%
18.5%
2
329,064
34.9%
6.2%
11.6%
3
4,237
0.8%
0.2%
0.1%
15
78,671
21.6%
4.0%
2.8%
9
2,641,670
17.9%
3.3%
93.0%
498,126
2.5%
0.5%
77.7%
-2,143,544
-41.6% -10.2% 100.0%

Unit diff.
% chg
3,117,115 2663.4%
-1,960,631
-92.6%
-35,211
-5.1%
211,594
31.8%
-44,209
-7.9%
71,761
16.1%
-513,040
-63.6%
-79,610
-14.6%
-4,769
-1.0%
244,857 116.6%
1,007,857
15.2%
35.5%

CAGR
94.2%
-40.6%
-1.0%
5.7%
-1.6%
3.0%
-18.3%
-3.1%
-0.2%
16.7%
2.9%

CTG % Rank
109.7%
1
-69.0% 144
-1.2% 112
7.4%
13
-1.6% 114
2.5%
27
-18.1% 142
-2.8% 122
-0.2%
90
8.6%
12
35.5%

2017
2,459,732
1,476,192
1,177,880
1,201,616
1,240,010
1,066,591
1,118,515
1,193,104
1,075,623
817,235
12,826,498
68.4%

Unit diff.
251,805
227,292
45,096
101,859
196,278
2,413
121,942
251,152
198,918
167,512
1,564,267
55.1%

% chg
11.4%
18.2%
4.0%
9.3%
18.8%
0.2%
12.2%
26.7%
22.7%
25.8%
13.9%

CAGR
2.2%
3.4%
0.8%
1.8%
3.5%
0.0%
2.3%
4.8%
4.2%
4.7%
2.6%

CTG % Rank
8.9%
1
8.0%
3
1.6%
21
3.6%
13
6.9%
6
0.1%
33
4.3%
8
8.8%
2
7.0%
4
5.9%
7
55.1%

2017
573,301
387,980
330,745
254,170
277,085
291,763
336,555
236,910
291,869
209,523
3,189,901
17.0%

Unit diff.
97,497
37,648
36,304
-85,750
35,413
4,474
36,798
-73,927
55,182
-79,556
64,083
2.3%

% chg
20.5%
10.7%
12.3%
-25.2%
14.7%
1.6%
12.3%
-23.8%
23.3%
-27.5%
2.1%

CAGR
3.8%
2.1%
2.4%
-5.6%
2.8%
0.3%
2.3%
-5.3%
4.3%
-6.2%
0.4%

CTG % Rank
3.4%
7
1.3%
52
1.3%
56
-3.0% 361
1.2%
59
0.2% 148
1.3%
54
-2.6% 355
1.9%
30
-2.8% 358
2.3%

For more information please visit us at www.autofacts.com
Analyst Note Plus

Baseline assembly forecast data – Eastern Europe

1
2
3
4
5
6
7
8
9
10

1
2
3
4
5
6
7
8
9
10

1
2
3
4
5
6
7
8
9
10

1
2
3
4
5
6
7
8
9
10

14

Alliance group
Renault-Nissan
GM Group
Hyundai Group
Ford Group
Fiat Group
VW Group
Toyota Group
PSA Group
GAZ Group
Daewoo Group
Top 10 total assembly
Top 10 total capacity
Excess capacity
Utilisation (%)

2012
1,104,458
541,182
437,840
385,063
216,270
211,468
112,547
100,824
58,414
39,264
3,207,330
4,938,384
1,731,054
64.9%

2013
1,134,338
509,931
489,657
389,458
278,000
221,903
143,505
116,479
54,406
24,766
3,362,443
5,159,947
1,797,504
65.2%

2014
1,162,982
501,773
546,713
422,438
251,005
268,061
189,867
131,388
58,500
46,395
3,579,122
5,502,609
1,923,487
65.0%

2015
1,258,147
510,946
567,797
531,977
257,606
277,178
186,980
151,817
61,174
51,792
3,855,414
5,693,789
1,838,375
67.7%

2016
1,428,836
537,799
557,479
545,343
327,684
288,456
240,585
99,223
61,227
53,133
4,139,765
6,313,002
2,173,237
65.6%

2017
1,553,733
566,087
558,843
567,724
396,808
307,140
248,140
104,371
63,216
56,385
4,422,447
6,499,489
2,077,042
68.0%

Platform
B0 (Renault)
HGSC
X85/B
2190
V184/5
GLOBAL GAMMA
FIAT/GM 199/4400
X84/C
B-EVO
2121
Top 10 total assembly
Top 10 (% of regional total)

2012
177,124
224,598
158,312
145,307
168,232
105,714
243,265
117,952
29,666
128,402
1,498,572
43.1%

2013
338,643
225,032
245,247
229,072
205,361
170,466
215,699
100,464
112,298
111,710
1,953,992
53.0%

2014
335,455
296,659
268,202
280,186
250,261
212,403
188,825
99,544
122,611
97,153
2,151,299
54.2%

2015
379,858
294,237
275,015
290,603
267,736
228,445
191,660
114,592
135,739
96,582
2,274,467
52.9%

2016
466,543
281,031
287,997
276,384
279,412
230,015
127,164
190,684
180,122
97,295
2,416,647
52.5%

2017
523,793
281,718
293,312
257,772
292,949
240,603
129,276
266,024
223,803
117,528
2,626,778
53.6%

Brand
Lada
Renault
Ford
Chevrolet
Hyundai
Fiat
Kia
Toyota
Volkswagen
Skoda
Top 10 total assembly
Top 10 (% of regional total)

2012
600,713
458,589
385,063
337,417
236,563
215,717
201,277
112,547
113,297
98,171
2,759,354
79.4%

2013
495,850
575,842
389,458
323,655
263,699
277,444
225,958
143,505
128,283
86,053
2,909,747
79.0%

2014
457,973
569,276
422,438
351,844
312,342
250,439
234,371
189,867
136,452
120,438
3,045,440
76.7%

2015
521,121
559,652
531,977
358,294
336,304
239,101
231,493
186,980
140,088
119,507
3,224,517
75.0%

2016
642,358
605,991
545,343
382,543
340,218
295,696
217,261
226,466
143,421
127,341
3,526,638
76.7%

2017
735,319
623,976
567,724
406,683
345,234
331,928
213,609
233,236
150,980
137,205
3,745,894
76.4%

Brand nameplate
Renault Clio
Ford Transit
Lada Granta
Hyundai Solaris
Lada Kalina
Fiat 500L
Kia Rio
Hyundai Getz/i20
Chevrolet Spark
Renault Symbol / Thalia
Top 10 total assembly
Top 10 (% of regional total)

2012
158,312
150,974
149,548
124,325
119,522
29,666
100,273
82,713
88,466
42,053
1,045,852
30.1%

2013
230,465
163,178
185,047
125,856
72,058
112,298
97,616
86,911
69,391
74,918
1,217,738
33.1%

2014
232,812
172,976
173,536
115,771
99,169
122,611
92,124
82,622
77,308
82,791
1,251,720
31.5%

2015
221,811
180,924
177,412
110,423
109,271
111,723
89,732
87,417
74,215
82,363
1,245,291
29.0%

2016
227,063
189,911
170,156
101,476
102,716
95,255
82,748
89,366
80,546
91,251
1,230,488
26.7%

2017
226,556
201,355
155,600
98,890
98,519
89,101
80,382
89,445
95,422
100,510
1,235,780
25.2%

Autofacts October 2013

Growth analytics
Unit diff.
% chg
449,275
40.7%
24,905
4.6%
121,003
27.6%
182,661
47.4%
180,538
83.5%
95,672
45.2%
135,593 120.5%
3,547
3.5%
4,802
8.2%
17,121
43.6%
1,215,117
37.9%
1,561,105
31.6%
345,988
20.0%

(2012-2017)
CAGR CTG % Rank
7.1%
31.5%
1
0.9%
1.7%
10
5.0%
8.5%
5
8.1%
12.8%
2
12.9%
12.7%
3
7.8%
6.7%
6
17.1%
9.5%
4
0.7%
0.2%
19
1.6%
0.3%
18
7.5%
1.2%
13
6.6%
85.3%
5.7%
82.7%
3.7% 100.0%

Unit diff.
346,669
57,120
135,000
112,465
124,717
134,889
-113,989
148,072
194,137
-10,874
1,128,206
79.2%

CAGR
24.2%
4.6%
13.1%
12.1%
11.7%
17.9%
-11.9%
17.7%
49.8%
-1.8%
11.9%

CTG % Rank
24.3%
1
4.0%
11
9.5%
6
7.9%
9
8.8%
8
9.5%
7
-8.0% 117
10.4%
5
13.6%
3
-0.8% 101
79.2%

Unit diff. % chg
134,606 22.4%
165,387 36.1%
182,661 47.4%
69,266 20.5%
108,671 45.9%
116,211 53.9%
12,332
6.1%
120,689 107.2%
37,683 33.3%
39,034 39.8%
986,540 35.8%
69.3%

CAGR
4.1%
6.4%
8.1%
3.8%
7.9%
9.0%
1.2%
15.7%
5.9%
6.9%
6.3%

CTG % Rank
9.5%
3
11.6%
2
12.8%
1
4.9%
8
7.6%
6
8.2%
5
0.9%
25
8.5%
4
2.6%
13
2.7%
12
69.3%

Unit diff.
68,244
50,381
6,052
-25,435
-21,003
59,435
-19,891
6,732
6,956
58,457
189,928
13.3%

CAGR
7.4%
5.9%
0.8%
-4.5%
-3.8%
24.6%
-4.3%
1.6%
1.5%
19.0%
3.4%

CTG % Rank
4.8%
7
3.5%
15
0.4%
73
-1.8% 221
-1.5% 219
4.2%
9
-1.4% 218
0.5%
68
0.5%
67
4.1%
10
13.3%

% chg
195.7%
25.4%
85.3%
77.4%
74.1%
127.6%
-46.9%
125.5%
654.4%
-8.5%
75.3%

% chg
43.1%
33.4%
4.0%
-20.5%
-17.6%
200.3%
-19.8%
8.1%
7.9%
139.0%
18.2%

For more information please visit us at www.autofacts.com
Analyst Note Plus

Baseline forecast data – Europe
European Union: fuel type and delivery by % share
2012 - 2017

European Union: weighted engine displacement
2012 - 2017 (cubic centimeters)

100%

100%

2,000

80%

80%

1,900

60%

60%

1,800

40%

40%

1,700

20%

20%

1,600

0%

1,500
2012

0%
2012

2013

Gasoline

2014

Diesel

2015

Hybrid

2016

2017

PEV+PHEV

2013

2014

2015

2016

2017

DI
Growth analytics (2012-2017)

Transmission outlook

2012

2013

2014

2015

2016

2017

Unit diff.

11,243,812

10,861,151

10,949,986

11,558,954

11,961,774

12,061,484

817,672

7.3%

70.6%

64.3%

2 Automatic

2,622,359

2,645,764

2,648,834

2,736,647

2,872,596

3,104,661

482,302

18.4%

16.5%

16.6%

3 Automated Manual Double Clutch

1,210,439

1,405,882

1,584,613

2,065,087

2,375,604

2,472,600

1,262,161

104.3%

7.6%

13.2%

544,792

495,096

521,788

518,242

453,713

410,632

-134,160

-24.6%

3.4%

2.2%

17,139

54,745

291,665

366,826

434,095

478,084

460,945

2689.5%

0.1%

2.5%

276,612

307,970

270,506

248,976

244,594

228,831

-47,781

-17.3%

1.7%

1.2%

15,915,153

15,770,608

16,267,392

17,494,732

18,342,376

18,756,292

2,841,139

17.9%

100.0%

100.0%

1 Manual

4 Automated Manual
5 Electric
6 Continuously Variable
Total consumption

Eastern Europe: fuel type and delivery by % share
2012 - 2017

% chg 2012 share

2017 share

Eastern Europe: weighted engine displacement
2012 - 2017 (cubic centimeters)

100%

50%

1,700

80%

45%

1,650

60%

40%

40%

35%

20%

30%

1,600

0%

25%
2012

2013

Gasoline

2014

Diesel

2015

Hybrid

2016

PEV+PHEV

2017

1,550
1,500
2012

2013

2014

2015

2016

2017

DI
Growth analytics (2012-2017)

Transmission outlook

2012

2013

2014

2015

2016

2017

Unit diff.

2,986,502

3,019,640

3,194,089

3,451,649

3,674,736

3,941,873

955,371

32.0%

85.9%

80.4%

351,688

488,544

549,825

531,671

538,254

555,191

203,503

57.9%

10.1%

11.3%

3 Automated Manual Double Clutch

51,906

76,126

114,989

200,852

252,342

263,863

211,957

408.3%

1.5%

5.4%

4 Automated Manual

37,604

37,403

45,103

47,923

56,729

57,304

19,700

52.4%

1.1%

1.2%

5 Continuously Variable

29,626

35,657

43,369

45,016

52,714

52,601

22,975

77.6%

0.9%

1.1%

6 Electric

19,778

26,566

21,204

21,523

25,933

30,430

10,652

53.9%

0.6%

0.6%

3,477,104

3,683,936

3,968,579

4,298,634

4,600,708

4,901,262

1,424,158

41.0%

100.0%

100.0%

1 Manual
2 Automatic

Total consumption

15

Autofacts October 2013

% chg 2012 share

2017 share

For more information please visit us at www.autofacts.com
Analyst Note Plus

Baseline assembly forecast data – Developed Asia Pacific
Growth analytics
Unit diff.
% chg
-824,725
-16.8%
59,324
1.8%
-106,334
-7.5%
-26,635
-2.6%
130,434
14.6%
12,271
1.4%
-155,821
-17.8%
12,639
2.8%
21,963
18.4%
-12,712
-27.8%
-889,596
-6.4%
-1,574,186
-9.7%
-684,590
-29.1%

(2012-2017)
CAGR CTG % Rank
-3.6% -90.4%
13
0.4%
6.5%
2
-1.6% -11.7%
11
-0.5%
-2.9%
9
2.8%
14.3%
1
0.3%
1.3%
5
-3.9% -17.1%
12
0.6%
1.4%
4
3.4%
2.4%
3
-6.3%
-1.4%
8
-1.3% -97.5%
-2.0% -93.7%
-6.6% 100.0%

2017
1,273,262
494,863

Unit diff.
109,028
-1,001,744

% chg
9.4%
-66.9%

CAGR CTG % Rank
1.8%
11.9%
10
-19.9% -109.8% 108

793,534
928,100
689,343
498,428
446,384
490,570
419,620
493,627
6,708,230
51.4%

774,374
948,403
702,048
490,429
106,987
471,939
422,384
473,533
6,158,222
47.2%

-60,437
703,848
140,775
-62,383
-722,812
-145,016
-162,648
81,929
-1,119,460
122.7%

-7.2%
287.8%
25.1%
-11.3%
-87.1%
-23.5%
-27.8%
20.9%
-15.4%

-1.5%
31.1%
4.6%
-2.4%
-33.6%
-5.2%
-6.3%
3.9%
-3.3%

2015
2,447,201
1,725,753
1,582,252
1,052,418
1,018,145
926,121
726,638
540,856
609,153
586,303
11,214,840
85.0%

2016
2,475,131
1,768,950
1,572,219
983,088
983,485
919,642
727,954
549,931
575,238
506,355
11,061,993
84.7%

2017
2,438,408
1,786,606
1,592,894
994,903
1,021,149
912,055
717,661
530,819
606,830
474,996
11,076,321
84.8%

Unit diff.
-742,029
-48,069
107,393
-2,967
130,434
-246,493
-155,821
-166,131
59,559
-88,429
-1,152,553
126.3%

% chg
-23.3%
-2.6%
7.2%
-0.3%
14.6%
-21.3%
-17.8%
-23.8%
10.9%
-15.7%
-9.4%

CAGR CTG % Rank
-5.2% -81.3%
28
-0.5%
-5.3%
22
1.4%
11.8%
3
-0.1%
-0.3%
16
2.8%
14.3%
2
-4.7% -27.0%
27
-3.9% -17.1%
25
-5.3% -18.2%
26
2.1%
6.5%
5
-3.4%
-9.7%
23
-2.0% -126.3%

2015
524,346
306,004
250,801
227,170
207,007
218,562
224,745
204,742
201,121
201,584
2,566,082
19.4%

2016
518,237
277,463
246,180
216,704
239,856
223,930
196,305
192,550
199,679
212,232
2,523,136
19.3%

2017
522,513
272,397
280,073
244,223
232,702
220,913
197,178
219,908
193,394
225,643
2,608,944
20.0%

Unit diff.
41,043
-32,710
-54,177
39,297
-15,365
-28,040
-16,433
-1,937
-35,964
5,702
-98,584
10.8%

% chg
8.5%
-10.7%
-16.2%
19.2%
-6.2%
-11.3%
-7.7%
-0.9%
-15.7%
2.6%
-3.6%

CAGR
1.6%
-2.2%
-3.5%
3.6%
-1.3%
-2.4%
-1.6%
-0.2%
-3.4%
0.5%
-0.7%

2012
4,916,519
3,320,176
1,411,760
1,029,855
890,715
880,962
873,482
451,889
119,142
45,751
13,940,251
16,295,678
2,355,427
85.5%

2013
4,631,813
3,337,863
1,161,124
955,046
989,525
903,113
780,157
386,998
134,831
32,216
13,312,686
15,099,251
1,786,565
88.2%

2014
4,318,317
3,335,442
1,280,458
1,060,095
1,022,019
910,477
746,628
442,963
130,012
36,637
13,283,048
14,823,998
1,540,950
89.6%

2015
4,146,151
3,308,005
1,365,067
1,061,185
1,018,145
871,749
726,638
501,111
134,938
34,591
13,167,580
14,872,180
1,704,600
88.5%

2016
4,144,758
3,341,169
1,335,713
991,524
983,485
851,699
727,954
482,368
138,530
32,808
13,030,008
14,800,757
1,770,749
88.0%

2017
4,091,794
3,379,500
1,305,426
1,003,220
1,021,149
893,233
717,661
464,528
141,105
33,039
13,050,655
14,721,492
1,670,837
88.7%

Platform
1 HD
2 MC (Toyota Motor
Corporation)
3 NF
4 SKYACTIV
5 HGSC
6 SI
7 NBC
8 L4 (Daihatsu Motor Company)
9 YP/YN
10 GLOBAL GAMMA
Top 10 total assembly
Top 10 (% of regional total)

2012
1,164,234
1,496,607

2013
1,207,567
1,471,313

2014
1,262,622
1,311,279

2015
1,226,276
881,306

2016
1,231,001
717,623

834,811
244,555
561,273
552,812
829,799
616,955
585,032
391,604
7,277,682
52.1%

834,297
577,159
577,308
591,494
699,054
546,279
551,389
463,653
7,519,513
56.4%

748,854
856,488
694,793
591,104
603,153
528,352
493,009
445,253
7,534,907
56.6%

797,042
881,817
674,006
585,594
585,738
480,469
462,577
452,742
7,027,567
53.2%

Brand
Toyota
Hyundai
Kia
Honda
Mazda
Nissan
Suzuki
Daihatsu
Chevrolet
Subaru
Top 10 total assembly
Top 10 (% of regional total)

2012
3,180,437
1,834,675
1,485,501
997,870
890,715
1,158,548
873,482
696,950
547,271
563,425
12,228,874
87.5%

2013
2,877,642
1,802,346
1,535,517
929,901
989,525
891,462
780,157
620,754
542,595
588,897
11,558,796
86.7%

2014
2,572,483
1,751,471
1,583,971
1,051,351
1,022,019
937,484
746,628
588,342
592,172
587,268
11,433,189
85.9%

Brand nameplate
Toyota Prius
Mazda Axela
Toyota Prius C/Aqua
Mazda CX-5
Hyundai Accent
Hyundai Elantra/i30
Kia Forte
Kia Rio
Toyota Land Cruiser
Hyundai Tucson/iX35
Top 10 total assembly
Top 10 (% of regional total)

2012
481,470
305,107
334,250
204,926
248,067
248,953
213,611
221,845
229,358
219,941
2,707,528
19.4%

2013
550,956
274,550
304,416
281,242
237,039
240,661
209,219
226,084
229,203
200,330
2,753,700
20.7%

2014
516,184
324,041
258,395
235,925
237,487
228,937
245,165
197,012
205,623
187,479
2,636,248
19.8%

1
2
3
4
5
6
7
8
9
10

1
2
3
4
5
6
7
8
9
10

1
2
3
4
5
6
7
8
9
10

16

Alliance group
Toyota Group
Hyundai Group
Renault-Nissan
Honda Group
Mazda
GM Group
Suzuki Group
Mitsubishi Group
Mahindra
PSA Group
Top 10 total assembly
Top 10 total capacity
Excess capacity
Utilisation (%)

Autofacts October 2013

-6.6%
77.1%
15.4%
-6.8%
-79.2%
-15.9%
-17.8%
9.0%
-122.7%

91
2
7
92
107
101
103
13

CTG % Rank
4.5%
16
-3.6% 318
-5.9% 334
4.3%
18
-1.7% 280
-3.1% 306
-1.8% 284
-0.2% 196
-3.9% 321
0.6%
97
-10.8%

For more information please visit us at www.autofacts.com
Analyst Note Plus

Baseline assembly forecast data – Developing Asia Pacific

1
2
3
4
5
6
7
8
9
10

1
2
3
4
5
6
7
8
9
10

1
2
3
4
5
6
7
8
9
10

1
2
3
4
5
6
7
8
9
10

17

Alliance group
GM Group
VW Group
Toyota Group
Hyundai Group
Renault-Nissan
Honda Group
Suzuki Group
Ford Group
Chang'an Group
Geely Group
Top 10 total assembly
Top 10 total capacity
Excess capacity
Utilisation (%)

Growth analytics
Unit diff.
% chg
1,727,930
58.6%
1,569,227
57.4%
1,005,706
34.5%
862,838
41.6%
1,239,584
83.6%
1,156,890 109.2%
364,083
25.4%
1,285,198 171.1%
238,813
23.1%
444,894
87.7%
9,895,163
58.4%
10,506,578
50.5%
611,415
15.9%

(2012-2017)
CAGR CTG % Rank
9.7%
12.4%
1
9.5%
11.2%
2
6.1%
7.2%
6
7.2%
6.2%
7
12.9%
8.9%
4
15.9%
8.3%
5
4.6%
2.6%
12
22.1%
9.2%
3
4.2%
1.7%
14
13.4%
3.2%
10
9.6%
70.9%
8.5%
67.6%
3.0% 100.0%

2012
2,951,057
2,734,317
2,916,433
2,075,413
1,482,861
1,059,895
1,434,328
751,172
1,035,144
507,317
16,947,937
20,792,273
3,844,336
81.5%

2013
3,212,770
3,161,801
3,109,152
2,184,869
1,701,556
1,372,114
1,386,887
1,047,681
1,064,493
569,450
18,810,773
23,220,907
4,410,134
81.0%

2014
3,420,757
3,331,516
3,418,264
2,386,820
2,063,950
1,771,440
1,430,699
1,144,019
1,163,735
715,368
20,846,568
25,568,628
4,722,060
81.5%

2015
3,852,279
3,451,666
3,652,522
2,493,351
2,377,642
2,048,386
1,526,155
1,495,170
1,237,841
849,288
22,984,300
29,308,039
6,323,739
78.4%

2016
4,461,719
3,992,241
3,777,727
2,714,805
2,522,462
2,139,545
1,562,019
1,866,287
1,284,361
888,595
25,209,761
31,128,890
5,919,129
81.0%

2017
4,678,987
4,303,544
3,922,139
2,938,251
2,722,445
2,216,785
1,798,411
2,036,370
1,273,957
952,211
26,843,100
31,298,851
4,455,751
85.8%

Platform
MINICAB
CARRY
PQ34 (A4)
PQ35/46 (A5)
IMV
HD
C1/P1
MQB
GLOBAL DELTA
NBC
Top 10 total assembly
Top 10 (% of regional total)

2012
1,400,893
1,384,065
785,158
1,143,374
917,202
640,886
476,402
0
499,169
525,972
7,773,121
31.7%

2013
1,438,834
1,224,514
942,763
1,285,696
910,107
861,368
745,755
37,425
530,882
562,621
8,539,965
31.8%

2014
1,484,876
1,321,290
961,497
1,113,161
926,404
859,264
682,022
362,291
589,991
642,501
8,943,297
29.8%

2015
1,502,337
1,311,465
1,002,681
841,500
933,705
915,882
865,048
839,795
681,253
668,193
9,561,859
28.8%

2016
1,494,700
1,271,375
1,008,649
589,719
936,507
1,023,119
796,712
1,387,138
793,086
696,487
9,997,492
27.6%

2017
1,568,384
1,224,849
1,031,696
605,710
953,861
1,108,332
899,083
1,517,682
908,285
757,457
10,575,339
27.5%

Unit diff.
167,491
-159,216
246,538
-537,664
36,659
467,446
422,681
1,517,682
409,116
231,485
2,802,218
20.1%

% chg
12.0%
-11.5%
31.4%
-47.0%
4.0%
72.9%
88.7%
0.0%
82.0%
44.0%
36.1%

CAGR
2.3%
-2.4%
5.6%
-11.9%
0.8%
11.6%
13.5%
0.0%
12.7%
7.6%
6.4%

CTG % Rank
1.2%
32
-1.1% 233
1.8%
19
-3.9% 236
0.3%
82
3.3%
6
3.0%
8
10.9%
1
2.9%
9
1.7%
24
20.1%

Brand
Toyota
Volkswagen
Hyundai
Nissan
Honda
Wuling
Ford
Chevrolet
Chang'an
Buick
Top 10 total assembly
Top 10 (% of regional total)

2012
2,562,472
2,130,483
1,551,317
1,403,325
1,021,962
1,383,305
751,172
883,920
825,494
677,286
13,190,736
53.8%

2013
2,722,341
2,442,362
1,637,016
1,518,141
1,325,576
1,403,522
1,047,681
982,246
898,176
809,806
14,786,867
55.0%

2014
2,972,492
2,488,422
1,845,546
1,678,554
1,721,598
1,450,579
1,144,019
1,120,684
997,637
828,520
16,248,051
54.2%

2015
3,127,795
2,540,502
1,860,603
1,764,657
1,927,479
1,462,938
1,462,529
1,367,166
1,047,494
918,846
17,480,009
52.7%

2016
3,231,536
2,760,772
1,947,097
1,769,781
1,947,428
1,449,767
1,783,740
1,659,899
1,084,005
1,193,476
18,827,501
51.9%

2017
3,368,571
2,891,738
2,127,526
1,859,168
2,017,179
1,520,944
1,943,870
1,761,558
1,052,887
1,231,582
19,775,023
51.4%

Unit diff.
806,099
761,255
576,209
455,843
995,217
137,639
1,192,698
877,638
227,393
554,296
6,584,287
47.2%

% chg
31.5%
35.7%
37.1%
32.5%
97.4%
10.0%
158.8%
99.3%
27.5%
81.8%
49.9%

CAGR
5.6%
6.3%
6.5%
5.8%
14.6%
1.9%
20.9%
14.8%
5.0%
12.7%
8.4%

CTG % Rank
5.8%
4
5.5%
5
4.1%
6
3.3%
8
7.1%
2
1.0%
28
8.5%
1
6.3%
3
1.6%
19
4.0%
7
47.2%

Brand nameplate
Toyota Corolla
Toyota Hilux Vigo
Wuling Sunshine
Chang'an SC63/10 Series
Dongfeng Xiaokang
Hyundai Elantra/i30
Volkswagen Lavida
Wuling Hong Guang
Wuling Rong Guang
Ford Focus
Top 10 total assembly
Top 10 (% of regional total)

2012
543,516
539,392
523,274
500,466
447,028
374,583
250,304
339,509
378,268
325,736
4,222,076
17.2%

2013
548,634
531,887
489,196
445,529
455,277
409,469
415,942
394,966
346,259
441,089
4,478,248
16.7%

2014
563,152
535,442
510,193
514,137
446,067
415,536
425,264
402,719
371,260
338,381
4,522,151
15.1%

2015
561,366
537,248
531,231
498,217
413,505
413,183
446,253
390,845
377,676
273,467
4,442,991
13.4%

2016
565,146
535,914
540,363
512,854
352,411
398,641
435,658
390,188
363,288
292,624
4,387,087
12.1%

2017
586,778
548,191
569,756
450,694
357,363
446,840
434,601
412,621
378,040
367,529
4,552,413
11.8%

Unit diff.
43,262
8,799
46,482
-49,772
-89,665
72,257
184,297
73,112
-228
41,793
330,337
2.4%

% chg
8.0%
1.6%
8.9%
-9.9%
-20.1%
19.3%
73.6%
21.5%
-0.1%
12.8%
7.8%

CAGR
1.5%
0.3%
1.7%
-2.1%
-4.4%
3.6%
11.7%
4.0%
0.0%
2.4%
1.5%

CTG % Rank
0.3% 109
0.1% 372
0.3%
98
-0.4% 681
-0.6% 686
0.5%
50
1.3%
4
0.5%
48
0.0% 586
0.3% 115
2.4%

Autofacts October 2013

For more information please visit us at www.autofacts.com
Analyst Note Plus

Baseline forecast data – Asia Pacific
Developed AP: fuel type and delivery by % share
2012 - 2017

Developed AP: weighted engine displacement
2012 - 2017 (cubic centimeters)

100%

50%

1,900

80%

40%

1,800

60%

30%

40%

20%

20%

10%

1,600

0%

1,500
2012

1,700

0%
2012

2013

Gasoline

Diesel

2014

2015

Hybrid

2016

2017

PEV+PHEV

2013

2014

2015

2016

2017

DI
Growth analytics (2012-2017)

Transmission outlook

2012

2013

2014

2015

2016

2017

Unit diff.

% chg 2012 share

1 Continuously Variable

5,096,728

5,084,377

5,090,955

4,965,870

4,925,709

4,943,473

-153,255

-3.0%

36.5%

37.9%

2 Automatic

5,205,446

4,796,831

4,711,264

4,597,845

4,541,933

4,547,537

-657,909

-12.6%

37.3%

34.8%

3 Manual

3,518,321

3,284,051

3,094,142

3,042,457

2,870,971

2,802,207

-716,114

-20.4%

25.2%

21.5%

4 Automated Manual Double Clutch

93,559

95,627

272,089

351,355

393,994

400,698

307,139

328.3%

0.7%

3.1%

5 Electric

48,782

57,796

106,184

204,988

279,077

322,271

273,489

560.6%

0.3%

2.5%

6 Automatic Hybrid

7,583

13,949

27,321

35,946

36,549

39,749

32,166

424.2%

0.1%

0.3%

7 Automated Manual

2,721

2,258

1,865

1,320

4,950

4,753

2,032

74.7%

0.0%

0.0%

Total consumption

13,973,140

13,334,889

13,303,820

13,199,781

13,053,183

13,060,688

-912,452

-6.5%

100.0%

100.0%

Developing AP: fuel type and delivery by % share
2012 - 2017

100%

Developing AP: weighted engine displacement
2012 - 2017 (cubic centimeters)

40%

80%

2017 share

1,800

30%
1,700

60%
20%
40%
10%

20%
0%

0%
2012

2013

Gasoline

2014

Diesel

2015

Hybrid

2016

PEV+PHEV

2017

1,600

1,500
2012

2013

2014

2015

2016

2017

DI

Growth analytics (2012-2017)
Transmission outlook

2012

2013

2014

2015

2016

2017

Unit diff.

14,637,574

15,294,638

16,738,742

17,897,994

19,220,596

20,365,912

5,728,338

39.1%

59.7%

52.9%

2 Automatic

7,693,012

8,291,453

8,981,659

9,761,604

10,428,830

10,844,193

3,151,181

41.0%

31.4%

28.2%

3 Continuously Variable

1,305,132

1,732,249

2,390,758

2,836,335

3,000,243

3,334,586

2,029,454

155.5%

5.3%

8.7%

4 Automated Manual Double Clutch

704,433

1,318,756

1,627,307

2,325,925

3,213,559

3,511,782

2,807,349

398.5%

2.9%

9.1%

5 Automated Manual

144,123

184,799

188,516

222,730

244,875

276,991

132,868

92.2%

0.6%

0.7%

33,598

47,967

58,865

112,531

138,118

142,009

108,411

322.7%

0.1%

0.4%

24,517,872

26,869,862

29,985,847

33,157,119

36,246,221

38,475,473 13,957,601

56.9%

100.0%

100.0%

1 Manual

6 Electric
Total consumption

18

Autofacts October 2013

% chg 2012 share

2017 share

For more information please visit us at www.autofacts.com

Contenu connexe

Tendances

Auto Presentation
Auto PresentationAuto Presentation
Auto Presentationguestabde0d
 
GT - Automotive Messenger UK - October 2012
GT - Automotive Messenger UK - October 2012GT - Automotive Messenger UK - October 2012
GT - Automotive Messenger UK - October 2012Grant Thornton
 
Mc Kinsey & Company - The road to 2020 and beyond
Mc Kinsey & Company - The road to 2020 and beyondMc Kinsey & Company - The road to 2020 and beyond
Mc Kinsey & Company - The road to 2020 and beyondLionel Martins
 
Cox Automotive Market Insight Overview April 2019
Cox Automotive Market Insight Overview   April 2019 Cox Automotive Market Insight Overview   April 2019
Cox Automotive Market Insight Overview April 2019 Philip Nothard
 
North american auto aftermarket frost 0211
North american auto aftermarket frost 0211 North american auto aftermarket frost 0211
North american auto aftermarket frost 0211 soaringvjr
 
Arthur D. Little Automotive Report April 2021
Arthur D. Little Automotive Report April 2021Arthur D. Little Automotive Report April 2021
Arthur D. Little Automotive Report April 2021Fabrizio Arena
 
Manufacturing Analysis and Trends for North america - June 28, 2016
Manufacturing Analysis and Trends for North america - June 28, 2016Manufacturing Analysis and Trends for North america - June 28, 2016
Manufacturing Analysis and Trends for North america - June 28, 2016paul young cpa, cga
 
Asean automotive market final
Asean automotive market finalAsean automotive market final
Asean automotive market finalrollerballrohit8
 
ARTIFICIAL INTELLIGENCE (AI) ENABLED TRANSPORTATION - DISRUPTING AND OPTIMIZI...
ARTIFICIAL INTELLIGENCE (AI) ENABLED TRANSPORTATION - DISRUPTING AND OPTIMIZI...ARTIFICIAL INTELLIGENCE (AI) ENABLED TRANSPORTATION - DISRUPTING AND OPTIMIZI...
ARTIFICIAL INTELLIGENCE (AI) ENABLED TRANSPORTATION - DISRUPTING AND OPTIMIZI...ANNATHOMAS89
 
AUTOMOTIVE TYRE INDUSTRY: RESTRATEGIZING DURING PANDEMIC
AUTOMOTIVE TYRE INDUSTRY: RESTRATEGIZING DURING PANDEMICAUTOMOTIVE TYRE INDUSTRY: RESTRATEGIZING DURING PANDEMIC
AUTOMOTIVE TYRE INDUSTRY: RESTRATEGIZING DURING PANDEMICShellyBhede
 
Cox Automotive Market Insight Overview June & H1 2019
Cox Automotive Market Insight Overview   June & H1 2019Cox Automotive Market Insight Overview   June & H1 2019
Cox Automotive Market Insight Overview June & H1 2019Philip Nothard
 
Automotive industry - Covid19 : How to face the crisis and build the new normal
Automotive industry - Covid19 : How to face the crisis and build the new normalAutomotive industry - Covid19 : How to face the crisis and build the new normal
Automotive industry - Covid19 : How to face the crisis and build the new normalFabrizio Arena
 
"Trump Trade Policy- Potential Vehicle Assembly Exposure and Risk in North Am...
"Trump Trade Policy- Potential Vehicle Assembly Exposure and Risk in North Am..."Trump Trade Policy- Potential Vehicle Assembly Exposure and Risk in North Am...
"Trump Trade Policy- Potential Vehicle Assembly Exposure and Risk in North Am...Alejandro Pulido Moran
 
Strategic sourcing outlook 2015
Strategic sourcing outlook 2015Strategic sourcing outlook 2015
Strategic sourcing outlook 2015Philippe Pelland
 
Arthur D. Little : Covid 19 impact on automotive industry update July 2020
Arthur D. Little : Covid 19 impact on automotive industry update July 2020Arthur D. Little : Covid 19 impact on automotive industry update July 2020
Arthur D. Little : Covid 19 impact on automotive industry update July 2020Fabrizio Arena
 
Explore APAC Two Wheeler Industry - Goldstein Market Intelligence
Explore APAC Two Wheeler Industry - Goldstein Market IntelligenceExplore APAC Two Wheeler Industry - Goldstein Market Intelligence
Explore APAC Two Wheeler Industry - Goldstein Market IntelligenceGoldstein Market Intelligence
 
Final CFA Challenge Trinity University Team Submission
Final CFA Challenge Trinity University Team SubmissionFinal CFA Challenge Trinity University Team Submission
Final CFA Challenge Trinity University Team SubmissionEmilio Vernaza
 
Auto Parts Manufacturing Industry Report - HF_L. Tamakloe
Auto Parts Manufacturing Industry Report - HF_L. TamakloeAuto Parts Manufacturing Industry Report - HF_L. Tamakloe
Auto Parts Manufacturing Industry Report - HF_L. TamakloeLiana Tamakloe
 

Tendances (20)

Auto Presentation
Auto PresentationAuto Presentation
Auto Presentation
 
GT - Automotive Messenger UK - October 2012
GT - Automotive Messenger UK - October 2012GT - Automotive Messenger UK - October 2012
GT - Automotive Messenger UK - October 2012
 
Mc Kinsey & Company - The road to 2020 and beyond
Mc Kinsey & Company - The road to 2020 and beyondMc Kinsey & Company - The road to 2020 and beyond
Mc Kinsey & Company - The road to 2020 and beyond
 
Cox Automotive Market Insight Overview April 2019
Cox Automotive Market Insight Overview   April 2019 Cox Automotive Market Insight Overview   April 2019
Cox Automotive Market Insight Overview April 2019
 
North american auto aftermarket frost 0211
North american auto aftermarket frost 0211 North american auto aftermarket frost 0211
North american auto aftermarket frost 0211
 
Arthur D. Little Automotive Report April 2021
Arthur D. Little Automotive Report April 2021Arthur D. Little Automotive Report April 2021
Arthur D. Little Automotive Report April 2021
 
Manufacturing Analysis and Trends for North america - June 28, 2016
Manufacturing Analysis and Trends for North america - June 28, 2016Manufacturing Analysis and Trends for North america - June 28, 2016
Manufacturing Analysis and Trends for North america - June 28, 2016
 
Asean automotive market final
Asean automotive market finalAsean automotive market final
Asean automotive market final
 
ARTIFICIAL INTELLIGENCE (AI) ENABLED TRANSPORTATION - DISRUPTING AND OPTIMIZI...
ARTIFICIAL INTELLIGENCE (AI) ENABLED TRANSPORTATION - DISRUPTING AND OPTIMIZI...ARTIFICIAL INTELLIGENCE (AI) ENABLED TRANSPORTATION - DISRUPTING AND OPTIMIZI...
ARTIFICIAL INTELLIGENCE (AI) ENABLED TRANSPORTATION - DISRUPTING AND OPTIMIZI...
 
AUTOMOTIVE TYRE INDUSTRY: RESTRATEGIZING DURING PANDEMIC
AUTOMOTIVE TYRE INDUSTRY: RESTRATEGIZING DURING PANDEMICAUTOMOTIVE TYRE INDUSTRY: RESTRATEGIZING DURING PANDEMIC
AUTOMOTIVE TYRE INDUSTRY: RESTRATEGIZING DURING PANDEMIC
 
Cox Automotive Market Insight Overview June & H1 2019
Cox Automotive Market Insight Overview   June & H1 2019Cox Automotive Market Insight Overview   June & H1 2019
Cox Automotive Market Insight Overview June & H1 2019
 
Automotive industry - Covid19 : How to face the crisis and build the new normal
Automotive industry - Covid19 : How to face the crisis and build the new normalAutomotive industry - Covid19 : How to face the crisis and build the new normal
Automotive industry - Covid19 : How to face the crisis and build the new normal
 
India Auto Sales Data July 2019
India Auto Sales Data July 2019India Auto Sales Data July 2019
India Auto Sales Data July 2019
 
"Trump Trade Policy- Potential Vehicle Assembly Exposure and Risk in North Am...
"Trump Trade Policy- Potential Vehicle Assembly Exposure and Risk in North Am..."Trump Trade Policy- Potential Vehicle Assembly Exposure and Risk in North Am...
"Trump Trade Policy- Potential Vehicle Assembly Exposure and Risk in North Am...
 
Strategic sourcing outlook 2015
Strategic sourcing outlook 2015Strategic sourcing outlook 2015
Strategic sourcing outlook 2015
 
Arthur D. Little : Covid 19 impact on automotive industry update July 2020
Arthur D. Little : Covid 19 impact on automotive industry update July 2020Arthur D. Little : Covid 19 impact on automotive industry update July 2020
Arthur D. Little : Covid 19 impact on automotive industry update July 2020
 
Explore APAC Two Wheeler Industry - Goldstein Market Intelligence
Explore APAC Two Wheeler Industry - Goldstein Market IntelligenceExplore APAC Two Wheeler Industry - Goldstein Market Intelligence
Explore APAC Two Wheeler Industry - Goldstein Market Intelligence
 
Italia - Presentación AFAC Autopartes
Italia - Presentación AFAC AutopartesItalia - Presentación AFAC Autopartes
Italia - Presentación AFAC Autopartes
 
Final CFA Challenge Trinity University Team Submission
Final CFA Challenge Trinity University Team SubmissionFinal CFA Challenge Trinity University Team Submission
Final CFA Challenge Trinity University Team Submission
 
Auto Parts Manufacturing Industry Report - HF_L. Tamakloe
Auto Parts Manufacturing Industry Report - HF_L. TamakloeAuto Parts Manufacturing Industry Report - HF_L. Tamakloe
Auto Parts Manufacturing Industry Report - HF_L. Tamakloe
 

Similaire à Etude PwC marché automobile mondial (2013)

Cox Automotive Market Insight Overview December & FY 2019
Cox Automotive Market Insight Overview   December & FY 2019  Cox Automotive Market Insight Overview   December & FY 2019
Cox Automotive Market Insight Overview December & FY 2019 Philip Nothard
 
1. mercado de autopartes en brasil, roberto pagano
1. mercado de autopartes en brasil, roberto pagano1. mercado de autopartes en brasil, roberto pagano
1. mercado de autopartes en brasil, roberto paganoProColombia
 
The road to 2020 and beyond: Automotive
The road to 2020 and beyond: AutomotiveThe road to 2020 and beyond: Automotive
The road to 2020 and beyond: Automotivebobbyj87
 
US AUTOMOTIVE AFTERMARKET
US AUTOMOTIVE AFTERMARKETUS AUTOMOTIVE AFTERMARKET
US AUTOMOTIVE AFTERMARKETAlbi Dhimitri
 
Cox Automotive Market Insight Overview September 2019
Cox Automotive Market Insight Overview   September 2019  Cox Automotive Market Insight Overview   September 2019
Cox Automotive Market Insight Overview September 2019 Philip Nothard
 
Etude PwC marché automobile européen Q3 (2013)
Etude PwC marché automobile européen Q3 (2013)Etude PwC marché automobile européen Q3 (2013)
Etude PwC marché automobile européen Q3 (2013)PwC France
 
MAWW Automotive Report - Nov 2016
MAWW Automotive Report - Nov 2016MAWW Automotive Report - Nov 2016
MAWW Automotive Report - Nov 2016Sang Kang
 
The Blue Sky Report® - A Kerrigan Quarterly – First Quarter 2019 Preview
The Blue Sky Report® - A Kerrigan Quarterly – First Quarter 2019 PreviewThe Blue Sky Report® - A Kerrigan Quarterly – First Quarter 2019 Preview
The Blue Sky Report® - A Kerrigan Quarterly – First Quarter 2019 PreviewErin Kerrigan
 
Cox Automotive Market Insight Overview March 2019
Cox Automotive Market Insight Overview   March 2019Cox Automotive Market Insight Overview   March 2019
Cox Automotive Market Insight Overview March 2019Philip Nothard
 
Cox Automotive Market Insight Overview January 2020
Cox Automotive Market Insight Overview   January 2020  Cox Automotive Market Insight Overview   January 2020
Cox Automotive Market Insight Overview January 2020 Philip Nothard
 
CGA - WE car market - June update
CGA - WE car market - June updateCGA - WE car market - June update
CGA - WE car market - June updateSabine Blumel
 
Opportunities And Challenges in China’s Automotive Industry
Opportunities And Challenges in China’s Automotive IndustryOpportunities And Challenges in China’s Automotive Industry
Opportunities And Challenges in China’s Automotive IndustryIpsos Business Consulting
 
BWA Report_April 2015_L.Tamakloe
BWA Report_April 2015_L.TamakloeBWA Report_April 2015_L.Tamakloe
BWA Report_April 2015_L.TamakloeLiana Tamakloe
 
Cox Automotive Market Insight Overview August 2019
Cox Automotive Market Insight Overview   August 2019 Cox Automotive Market Insight Overview   August 2019
Cox Automotive Market Insight Overview August 2019 Philip Nothard
 
Nomura Case Study Competition
Nomura Case Study CompetitionNomura Case Study Competition
Nomura Case Study CompetitionRajib Layek
 
Arthur D. Little - Covid19 impact on automotive industry_update June 2020
Arthur D. Little - Covid19 impact on automotive industry_update June 2020Arthur D. Little - Covid19 impact on automotive industry_update June 2020
Arthur D. Little - Covid19 impact on automotive industry_update June 2020Fabrizio Arena
 
CGA - WE car market - May update
CGA - WE car market - May updateCGA - WE car market - May update
CGA - WE car market - May updateSabine Blumel
 
Automobile industry analysis
Automobile industry analysisAutomobile industry analysis
Automobile industry analysisUdayan Sikdar
 
Arthur D. Little - Global Automotive Market Report December 2019 (FY)
Arthur D. Little - Global Automotive Market Report December 2019 (FY)Arthur D. Little - Global Automotive Market Report December 2019 (FY)
Arthur D. Little - Global Automotive Market Report December 2019 (FY)Fabrizio Arena
 

Similaire à Etude PwC marché automobile mondial (2013) (20)

Cox Automotive Market Insight Overview December & FY 2019
Cox Automotive Market Insight Overview   December & FY 2019  Cox Automotive Market Insight Overview   December & FY 2019
Cox Automotive Market Insight Overview December & FY 2019
 
1. mercado de autopartes en brasil, roberto pagano
1. mercado de autopartes en brasil, roberto pagano1. mercado de autopartes en brasil, roberto pagano
1. mercado de autopartes en brasil, roberto pagano
 
The road to 2020 and beyond: Automotive
The road to 2020 and beyond: AutomotiveThe road to 2020 and beyond: Automotive
The road to 2020 and beyond: Automotive
 
US AUTOMOTIVE AFTERMARKET
US AUTOMOTIVE AFTERMARKETUS AUTOMOTIVE AFTERMARKET
US AUTOMOTIVE AFTERMARKET
 
Cox Automotive Market Insight Overview September 2019
Cox Automotive Market Insight Overview   September 2019  Cox Automotive Market Insight Overview   September 2019
Cox Automotive Market Insight Overview September 2019
 
Etude PwC marché automobile européen Q3 (2013)
Etude PwC marché automobile européen Q3 (2013)Etude PwC marché automobile européen Q3 (2013)
Etude PwC marché automobile européen Q3 (2013)
 
MAWW Automotive Report - Nov 2016
MAWW Automotive Report - Nov 2016MAWW Automotive Report - Nov 2016
MAWW Automotive Report - Nov 2016
 
The Blue Sky Report® - A Kerrigan Quarterly – First Quarter 2019 Preview
The Blue Sky Report® - A Kerrigan Quarterly – First Quarter 2019 PreviewThe Blue Sky Report® - A Kerrigan Quarterly – First Quarter 2019 Preview
The Blue Sky Report® - A Kerrigan Quarterly – First Quarter 2019 Preview
 
Cox Automotive Market Insight Overview March 2019
Cox Automotive Market Insight Overview   March 2019Cox Automotive Market Insight Overview   March 2019
Cox Automotive Market Insight Overview March 2019
 
Cox Automotive Market Insight Overview January 2020
Cox Automotive Market Insight Overview   January 2020  Cox Automotive Market Insight Overview   January 2020
Cox Automotive Market Insight Overview January 2020
 
CGA - WE car market - June update
CGA - WE car market - June updateCGA - WE car market - June update
CGA - WE car market - June update
 
Opportunities And Challenges in China’s Automotive Industry
Opportunities And Challenges in China’s Automotive IndustryOpportunities And Challenges in China’s Automotive Industry
Opportunities And Challenges in China’s Automotive Industry
 
BWA Report_April 2015_L.Tamakloe
BWA Report_April 2015_L.TamakloeBWA Report_April 2015_L.Tamakloe
BWA Report_April 2015_L.Tamakloe
 
Cox Automotive Market Insight Overview August 2019
Cox Automotive Market Insight Overview   August 2019 Cox Automotive Market Insight Overview   August 2019
Cox Automotive Market Insight Overview August 2019
 
Nomura Case Study Competition
Nomura Case Study CompetitionNomura Case Study Competition
Nomura Case Study Competition
 
HCUK-mid-year-review
HCUK-mid-year-reviewHCUK-mid-year-review
HCUK-mid-year-review
 
Arthur D. Little - Covid19 impact on automotive industry_update June 2020
Arthur D. Little - Covid19 impact on automotive industry_update June 2020Arthur D. Little - Covid19 impact on automotive industry_update June 2020
Arthur D. Little - Covid19 impact on automotive industry_update June 2020
 
CGA - WE car market - May update
CGA - WE car market - May updateCGA - WE car market - May update
CGA - WE car market - May update
 
Automobile industry analysis
Automobile industry analysisAutomobile industry analysis
Automobile industry analysis
 
Arthur D. Little - Global Automotive Market Report December 2019 (FY)
Arthur D. Little - Global Automotive Market Report December 2019 (FY)Arthur D. Little - Global Automotive Market Report December 2019 (FY)
Arthur D. Little - Global Automotive Market Report December 2019 (FY)
 

Plus de PwC France

Etude PwC "20ème édition de la CEO Survey" - Janvier 2017
Etude PwC "20ème édition de la CEO Survey" - Janvier 2017Etude PwC "20ème édition de la CEO Survey" - Janvier 2017
Etude PwC "20ème édition de la CEO Survey" - Janvier 2017PwC France
 
Etude PwC "Carbon Factor" (nov. 2015)
Etude PwC "Carbon Factor" (nov. 2015)Etude PwC "Carbon Factor" (nov. 2015)
Etude PwC "Carbon Factor" (nov. 2015)PwC France
 
Etude PwC : La transition énergétique pour la croissance verte (nov 2015)
Etude PwC : La transition énergétique pour la croissance verte (nov 2015)Etude PwC : La transition énergétique pour la croissance verte (nov 2015)
Etude PwC : La transition énergétique pour la croissance verte (nov 2015)PwC France
 
Etude PwC "Total Retail 2015" Sur quoi miser aujourd’hui pour réenchanter la ...
Etude PwC "Total Retail 2015" Sur quoi miser aujourd’hui pour réenchanter la ...Etude PwC "Total Retail 2015" Sur quoi miser aujourd’hui pour réenchanter la ...
Etude PwC "Total Retail 2015" Sur quoi miser aujourd’hui pour réenchanter la ...PwC France
 
GEMO 2016 : un digital de plus en plus cannibale ?
GEMO 2016  : un digital de plus en plus cannibale ?GEMO 2016  : un digital de plus en plus cannibale ?
GEMO 2016 : un digital de plus en plus cannibale ?PwC France
 
Infographie PwC GEMO 2016 sur l'industrie Médias et Loisirs (juin 2015)
Infographie PwC GEMO 2016 sur l'industrie Médias et Loisirs (juin 2015)Infographie PwC GEMO 2016 sur l'industrie Médias et Loisirs (juin 2015)
Infographie PwC GEMO 2016 sur l'industrie Médias et Loisirs (juin 2015)PwC France
 
Etude PwC Low Carbon Economy Index (oct. 2015)
Etude PwC Low Carbon Economy Index (oct. 2015)Etude PwC Low Carbon Economy Index (oct. 2015)
Etude PwC Low Carbon Economy Index (oct. 2015)PwC France
 
Etude FCD, ESSEC et PwC sur la distribution responsable (août 2015)
Etude FCD, ESSEC et PwC sur la distribution responsable (août 2015)Etude FCD, ESSEC et PwC sur la distribution responsable (août 2015)
Etude FCD, ESSEC et PwC sur la distribution responsable (août 2015)PwC France
 
Etude PwC IPO Watch
Etude PwC IPO WatchEtude PwC IPO Watch
Etude PwC IPO WatchPwC France
 
Etude PwC CEO Survey Talent "People Strategy for the Digital Age" (juillet 2015)
Etude PwC CEO Survey Talent "People Strategy for the Digital Age" (juillet 2015)Etude PwC CEO Survey Talent "People Strategy for the Digital Age" (juillet 2015)
Etude PwC CEO Survey Talent "People Strategy for the Digital Age" (juillet 2015)PwC France
 
Etude PwC Golden Age Index (juin 2015)
Etude PwC Golden Age Index (juin 2015)Etude PwC Golden Age Index (juin 2015)
Etude PwC Golden Age Index (juin 2015)PwC France
 
Etude PwC Global Economy Watch (juin 2015)
Etude PwC Global Economy Watch (juin 2015)Etude PwC Global Economy Watch (juin 2015)
Etude PwC Global Economy Watch (juin 2015)PwC France
 
Etude PwC et Essec "Grande consommation 1985 - 2015 - 2045"
Etude PwC et Essec "Grande consommation 1985 - 2015 - 2045"Etude PwC et Essec "Grande consommation 1985 - 2015 - 2045"
Etude PwC et Essec "Grande consommation 1985 - 2015 - 2045"PwC France
 
Etude PwC sur le Top 100 des entreprises les mieux valorisées au monde en 201...
Etude PwC sur le Top 100 des entreprises les mieux valorisées au monde en 201...Etude PwC sur le Top 100 des entreprises les mieux valorisées au monde en 201...
Etude PwC sur le Top 100 des entreprises les mieux valorisées au monde en 201...PwC France
 
Etude PwC "Point of View: Enterprise Portfolio & Program Management" (mai 2015)
Etude PwC "Point of View: Enterprise Portfolio & Program Management" (mai 2015)Etude PwC "Point of View: Enterprise Portfolio & Program Management" (mai 2015)
Etude PwC "Point of View: Enterprise Portfolio & Program Management" (mai 2015)PwC France
 
Etude PwC "Bridging the gap" sur les investisseurs institutionnels (mai 2015)
Etude PwC "Bridging the gap" sur les investisseurs institutionnels (mai 2015)Etude PwC "Bridging the gap" sur les investisseurs institutionnels (mai 2015)
Etude PwC "Bridging the gap" sur les investisseurs institutionnels (mai 2015)PwC France
 
Etude PwC, AFDEL et SNJV sur "Les 100 digital"
Etude PwC, AFDEL et SNJV sur "Les 100 digital"Etude PwC, AFDEL et SNJV sur "Les 100 digital"
Etude PwC, AFDEL et SNJV sur "Les 100 digital"PwC France
 
Etude PwC Global Economy Watch (mai 2015)
Etude PwC Global Economy Watch (mai 2015)Etude PwC Global Economy Watch (mai 2015)
Etude PwC Global Economy Watch (mai 2015)PwC France
 
Etude PwC sur l'économie collaborative (mai 2015)
Etude PwC sur l'économie collaborative (mai 2015)Etude PwC sur l'économie collaborative (mai 2015)
Etude PwC sur l'économie collaborative (mai 2015)PwC France
 
Etude PwC sur l'intérêt des investisseurs pour l’Afrique (avril 2015)
Etude PwC sur l'intérêt des investisseurs pour l’Afrique (avril 2015)Etude PwC sur l'intérêt des investisseurs pour l’Afrique (avril 2015)
Etude PwC sur l'intérêt des investisseurs pour l’Afrique (avril 2015)PwC France
 

Plus de PwC France (20)

Etude PwC "20ème édition de la CEO Survey" - Janvier 2017
Etude PwC "20ème édition de la CEO Survey" - Janvier 2017Etude PwC "20ème édition de la CEO Survey" - Janvier 2017
Etude PwC "20ème édition de la CEO Survey" - Janvier 2017
 
Etude PwC "Carbon Factor" (nov. 2015)
Etude PwC "Carbon Factor" (nov. 2015)Etude PwC "Carbon Factor" (nov. 2015)
Etude PwC "Carbon Factor" (nov. 2015)
 
Etude PwC : La transition énergétique pour la croissance verte (nov 2015)
Etude PwC : La transition énergétique pour la croissance verte (nov 2015)Etude PwC : La transition énergétique pour la croissance verte (nov 2015)
Etude PwC : La transition énergétique pour la croissance verte (nov 2015)
 
Etude PwC "Total Retail 2015" Sur quoi miser aujourd’hui pour réenchanter la ...
Etude PwC "Total Retail 2015" Sur quoi miser aujourd’hui pour réenchanter la ...Etude PwC "Total Retail 2015" Sur quoi miser aujourd’hui pour réenchanter la ...
Etude PwC "Total Retail 2015" Sur quoi miser aujourd’hui pour réenchanter la ...
 
GEMO 2016 : un digital de plus en plus cannibale ?
GEMO 2016  : un digital de plus en plus cannibale ?GEMO 2016  : un digital de plus en plus cannibale ?
GEMO 2016 : un digital de plus en plus cannibale ?
 
Infographie PwC GEMO 2016 sur l'industrie Médias et Loisirs (juin 2015)
Infographie PwC GEMO 2016 sur l'industrie Médias et Loisirs (juin 2015)Infographie PwC GEMO 2016 sur l'industrie Médias et Loisirs (juin 2015)
Infographie PwC GEMO 2016 sur l'industrie Médias et Loisirs (juin 2015)
 
Etude PwC Low Carbon Economy Index (oct. 2015)
Etude PwC Low Carbon Economy Index (oct. 2015)Etude PwC Low Carbon Economy Index (oct. 2015)
Etude PwC Low Carbon Economy Index (oct. 2015)
 
Etude FCD, ESSEC et PwC sur la distribution responsable (août 2015)
Etude FCD, ESSEC et PwC sur la distribution responsable (août 2015)Etude FCD, ESSEC et PwC sur la distribution responsable (août 2015)
Etude FCD, ESSEC et PwC sur la distribution responsable (août 2015)
 
Etude PwC IPO Watch
Etude PwC IPO WatchEtude PwC IPO Watch
Etude PwC IPO Watch
 
Etude PwC CEO Survey Talent "People Strategy for the Digital Age" (juillet 2015)
Etude PwC CEO Survey Talent "People Strategy for the Digital Age" (juillet 2015)Etude PwC CEO Survey Talent "People Strategy for the Digital Age" (juillet 2015)
Etude PwC CEO Survey Talent "People Strategy for the Digital Age" (juillet 2015)
 
Etude PwC Golden Age Index (juin 2015)
Etude PwC Golden Age Index (juin 2015)Etude PwC Golden Age Index (juin 2015)
Etude PwC Golden Age Index (juin 2015)
 
Etude PwC Global Economy Watch (juin 2015)
Etude PwC Global Economy Watch (juin 2015)Etude PwC Global Economy Watch (juin 2015)
Etude PwC Global Economy Watch (juin 2015)
 
Etude PwC et Essec "Grande consommation 1985 - 2015 - 2045"
Etude PwC et Essec "Grande consommation 1985 - 2015 - 2045"Etude PwC et Essec "Grande consommation 1985 - 2015 - 2045"
Etude PwC et Essec "Grande consommation 1985 - 2015 - 2045"
 
Etude PwC sur le Top 100 des entreprises les mieux valorisées au monde en 201...
Etude PwC sur le Top 100 des entreprises les mieux valorisées au monde en 201...Etude PwC sur le Top 100 des entreprises les mieux valorisées au monde en 201...
Etude PwC sur le Top 100 des entreprises les mieux valorisées au monde en 201...
 
Etude PwC "Point of View: Enterprise Portfolio & Program Management" (mai 2015)
Etude PwC "Point of View: Enterprise Portfolio & Program Management" (mai 2015)Etude PwC "Point of View: Enterprise Portfolio & Program Management" (mai 2015)
Etude PwC "Point of View: Enterprise Portfolio & Program Management" (mai 2015)
 
Etude PwC "Bridging the gap" sur les investisseurs institutionnels (mai 2015)
Etude PwC "Bridging the gap" sur les investisseurs institutionnels (mai 2015)Etude PwC "Bridging the gap" sur les investisseurs institutionnels (mai 2015)
Etude PwC "Bridging the gap" sur les investisseurs institutionnels (mai 2015)
 
Etude PwC, AFDEL et SNJV sur "Les 100 digital"
Etude PwC, AFDEL et SNJV sur "Les 100 digital"Etude PwC, AFDEL et SNJV sur "Les 100 digital"
Etude PwC, AFDEL et SNJV sur "Les 100 digital"
 
Etude PwC Global Economy Watch (mai 2015)
Etude PwC Global Economy Watch (mai 2015)Etude PwC Global Economy Watch (mai 2015)
Etude PwC Global Economy Watch (mai 2015)
 
Etude PwC sur l'économie collaborative (mai 2015)
Etude PwC sur l'économie collaborative (mai 2015)Etude PwC sur l'économie collaborative (mai 2015)
Etude PwC sur l'économie collaborative (mai 2015)
 
Etude PwC sur l'intérêt des investisseurs pour l’Afrique (avril 2015)
Etude PwC sur l'intérêt des investisseurs pour l’Afrique (avril 2015)Etude PwC sur l'intérêt des investisseurs pour l’Afrique (avril 2015)
Etude PwC sur l'intérêt des investisseurs pour l’Afrique (avril 2015)
 

Dernier

Organizational Structure Running A Successful Business
Organizational Structure Running A Successful BusinessOrganizational Structure Running A Successful Business
Organizational Structure Running A Successful BusinessSeta Wicaksana
 
Call Girls Miyapur 7001305949 all area service COD available Any Time
Call Girls Miyapur 7001305949 all area service COD available Any TimeCall Girls Miyapur 7001305949 all area service COD available Any Time
Call Girls Miyapur 7001305949 all area service COD available Any Timedelhimodelshub1
 
RE Capital's Visionary Leadership under Newman Leech
RE Capital's Visionary Leadership under Newman LeechRE Capital's Visionary Leadership under Newman Leech
RE Capital's Visionary Leadership under Newman LeechNewman George Leech
 
FULL ENJOY Call girls in Paharganj Delhi | 8377087607
FULL ENJOY Call girls in Paharganj Delhi | 8377087607FULL ENJOY Call girls in Paharganj Delhi | 8377087607
FULL ENJOY Call girls in Paharganj Delhi | 8377087607dollysharma2066
 
(8264348440) 🔝 Call Girls In Mahipalpur 🔝 Delhi NCR
(8264348440) 🔝 Call Girls In Mahipalpur 🔝 Delhi NCR(8264348440) 🔝 Call Girls In Mahipalpur 🔝 Delhi NCR
(8264348440) 🔝 Call Girls In Mahipalpur 🔝 Delhi NCRsoniya singh
 
Intro to BCG's Carbon Emissions Benchmark_vF.pdf
Intro to BCG's Carbon Emissions Benchmark_vF.pdfIntro to BCG's Carbon Emissions Benchmark_vF.pdf
Intro to BCG's Carbon Emissions Benchmark_vF.pdfpollardmorgan
 
2024 Numerator Consumer Study of Cannabis Usage
2024 Numerator Consumer Study of Cannabis Usage2024 Numerator Consumer Study of Cannabis Usage
2024 Numerator Consumer Study of Cannabis UsageNeil Kimberley
 
8447779800, Low rate Call girls in Rohini Delhi NCR
8447779800, Low rate Call girls in Rohini Delhi NCR8447779800, Low rate Call girls in Rohini Delhi NCR
8447779800, Low rate Call girls in Rohini Delhi NCRashishs7044
 
Kenya’s Coconut Value Chain by Gatsby Africa
Kenya’s Coconut Value Chain by Gatsby AfricaKenya’s Coconut Value Chain by Gatsby Africa
Kenya’s Coconut Value Chain by Gatsby Africaictsugar
 
Lowrate Call Girls In Sector 18 Noida ❤️8860477959 Escorts 100% Genuine Servi...
Lowrate Call Girls In Sector 18 Noida ❤️8860477959 Escorts 100% Genuine Servi...Lowrate Call Girls In Sector 18 Noida ❤️8860477959 Escorts 100% Genuine Servi...
Lowrate Call Girls In Sector 18 Noida ❤️8860477959 Escorts 100% Genuine Servi...lizamodels9
 
Market Sizes Sample Report - 2024 Edition
Market Sizes Sample Report - 2024 EditionMarket Sizes Sample Report - 2024 Edition
Market Sizes Sample Report - 2024 EditionMintel Group
 
Call Girls In Radisson Blu Hotel New Delhi Paschim Vihar ❤️8860477959 Escorts...
Call Girls In Radisson Blu Hotel New Delhi Paschim Vihar ❤️8860477959 Escorts...Call Girls In Radisson Blu Hotel New Delhi Paschim Vihar ❤️8860477959 Escorts...
Call Girls In Radisson Blu Hotel New Delhi Paschim Vihar ❤️8860477959 Escorts...lizamodels9
 
Call Girls In Sikandarpur Gurgaon ❤️8860477959_Russian 100% Genuine Escorts I...
Call Girls In Sikandarpur Gurgaon ❤️8860477959_Russian 100% Genuine Escorts I...Call Girls In Sikandarpur Gurgaon ❤️8860477959_Russian 100% Genuine Escorts I...
Call Girls In Sikandarpur Gurgaon ❤️8860477959_Russian 100% Genuine Escorts I...lizamodels9
 
/:Call Girls In Indirapuram Ghaziabad ➥9990211544 Independent Best Escorts In...
/:Call Girls In Indirapuram Ghaziabad ➥9990211544 Independent Best Escorts In.../:Call Girls In Indirapuram Ghaziabad ➥9990211544 Independent Best Escorts In...
/:Call Girls In Indirapuram Ghaziabad ➥9990211544 Independent Best Escorts In...lizamodels9
 
Pitch Deck Teardown: NOQX's $200k Pre-seed deck
Pitch Deck Teardown: NOQX's $200k Pre-seed deckPitch Deck Teardown: NOQX's $200k Pre-seed deck
Pitch Deck Teardown: NOQX's $200k Pre-seed deckHajeJanKamps
 
8447779800, Low rate Call girls in Shivaji Enclave Delhi NCR
8447779800, Low rate Call girls in Shivaji Enclave Delhi NCR8447779800, Low rate Call girls in Shivaji Enclave Delhi NCR
8447779800, Low rate Call girls in Shivaji Enclave Delhi NCRashishs7044
 
Sales & Marketing Alignment: How to Synergize for Success
Sales & Marketing Alignment: How to Synergize for SuccessSales & Marketing Alignment: How to Synergize for Success
Sales & Marketing Alignment: How to Synergize for SuccessAggregage
 
Call Us 📲8800102216📞 Call Girls In DLF City Gurgaon
Call Us 📲8800102216📞 Call Girls In DLF City GurgaonCall Us 📲8800102216📞 Call Girls In DLF City Gurgaon
Call Us 📲8800102216📞 Call Girls In DLF City Gurgaoncallgirls2057
 
8447779800, Low rate Call girls in Kotla Mubarakpur Delhi NCR
8447779800, Low rate Call girls in Kotla Mubarakpur Delhi NCR8447779800, Low rate Call girls in Kotla Mubarakpur Delhi NCR
8447779800, Low rate Call girls in Kotla Mubarakpur Delhi NCRashishs7044
 
India Consumer 2024 Redacted Sample Report
India Consumer 2024 Redacted Sample ReportIndia Consumer 2024 Redacted Sample Report
India Consumer 2024 Redacted Sample ReportMintel Group
 

Dernier (20)

Organizational Structure Running A Successful Business
Organizational Structure Running A Successful BusinessOrganizational Structure Running A Successful Business
Organizational Structure Running A Successful Business
 
Call Girls Miyapur 7001305949 all area service COD available Any Time
Call Girls Miyapur 7001305949 all area service COD available Any TimeCall Girls Miyapur 7001305949 all area service COD available Any Time
Call Girls Miyapur 7001305949 all area service COD available Any Time
 
RE Capital's Visionary Leadership under Newman Leech
RE Capital's Visionary Leadership under Newman LeechRE Capital's Visionary Leadership under Newman Leech
RE Capital's Visionary Leadership under Newman Leech
 
FULL ENJOY Call girls in Paharganj Delhi | 8377087607
FULL ENJOY Call girls in Paharganj Delhi | 8377087607FULL ENJOY Call girls in Paharganj Delhi | 8377087607
FULL ENJOY Call girls in Paharganj Delhi | 8377087607
 
(8264348440) 🔝 Call Girls In Mahipalpur 🔝 Delhi NCR
(8264348440) 🔝 Call Girls In Mahipalpur 🔝 Delhi NCR(8264348440) 🔝 Call Girls In Mahipalpur 🔝 Delhi NCR
(8264348440) 🔝 Call Girls In Mahipalpur 🔝 Delhi NCR
 
Intro to BCG's Carbon Emissions Benchmark_vF.pdf
Intro to BCG's Carbon Emissions Benchmark_vF.pdfIntro to BCG's Carbon Emissions Benchmark_vF.pdf
Intro to BCG's Carbon Emissions Benchmark_vF.pdf
 
2024 Numerator Consumer Study of Cannabis Usage
2024 Numerator Consumer Study of Cannabis Usage2024 Numerator Consumer Study of Cannabis Usage
2024 Numerator Consumer Study of Cannabis Usage
 
8447779800, Low rate Call girls in Rohini Delhi NCR
8447779800, Low rate Call girls in Rohini Delhi NCR8447779800, Low rate Call girls in Rohini Delhi NCR
8447779800, Low rate Call girls in Rohini Delhi NCR
 
Kenya’s Coconut Value Chain by Gatsby Africa
Kenya’s Coconut Value Chain by Gatsby AfricaKenya’s Coconut Value Chain by Gatsby Africa
Kenya’s Coconut Value Chain by Gatsby Africa
 
Lowrate Call Girls In Sector 18 Noida ❤️8860477959 Escorts 100% Genuine Servi...
Lowrate Call Girls In Sector 18 Noida ❤️8860477959 Escorts 100% Genuine Servi...Lowrate Call Girls In Sector 18 Noida ❤️8860477959 Escorts 100% Genuine Servi...
Lowrate Call Girls In Sector 18 Noida ❤️8860477959 Escorts 100% Genuine Servi...
 
Market Sizes Sample Report - 2024 Edition
Market Sizes Sample Report - 2024 EditionMarket Sizes Sample Report - 2024 Edition
Market Sizes Sample Report - 2024 Edition
 
Call Girls In Radisson Blu Hotel New Delhi Paschim Vihar ❤️8860477959 Escorts...
Call Girls In Radisson Blu Hotel New Delhi Paschim Vihar ❤️8860477959 Escorts...Call Girls In Radisson Blu Hotel New Delhi Paschim Vihar ❤️8860477959 Escorts...
Call Girls In Radisson Blu Hotel New Delhi Paschim Vihar ❤️8860477959 Escorts...
 
Call Girls In Sikandarpur Gurgaon ❤️8860477959_Russian 100% Genuine Escorts I...
Call Girls In Sikandarpur Gurgaon ❤️8860477959_Russian 100% Genuine Escorts I...Call Girls In Sikandarpur Gurgaon ❤️8860477959_Russian 100% Genuine Escorts I...
Call Girls In Sikandarpur Gurgaon ❤️8860477959_Russian 100% Genuine Escorts I...
 
/:Call Girls In Indirapuram Ghaziabad ➥9990211544 Independent Best Escorts In...
/:Call Girls In Indirapuram Ghaziabad ➥9990211544 Independent Best Escorts In.../:Call Girls In Indirapuram Ghaziabad ➥9990211544 Independent Best Escorts In...
/:Call Girls In Indirapuram Ghaziabad ➥9990211544 Independent Best Escorts In...
 
Pitch Deck Teardown: NOQX's $200k Pre-seed deck
Pitch Deck Teardown: NOQX's $200k Pre-seed deckPitch Deck Teardown: NOQX's $200k Pre-seed deck
Pitch Deck Teardown: NOQX's $200k Pre-seed deck
 
8447779800, Low rate Call girls in Shivaji Enclave Delhi NCR
8447779800, Low rate Call girls in Shivaji Enclave Delhi NCR8447779800, Low rate Call girls in Shivaji Enclave Delhi NCR
8447779800, Low rate Call girls in Shivaji Enclave Delhi NCR
 
Sales & Marketing Alignment: How to Synergize for Success
Sales & Marketing Alignment: How to Synergize for SuccessSales & Marketing Alignment: How to Synergize for Success
Sales & Marketing Alignment: How to Synergize for Success
 
Call Us 📲8800102216📞 Call Girls In DLF City Gurgaon
Call Us 📲8800102216📞 Call Girls In DLF City GurgaonCall Us 📲8800102216📞 Call Girls In DLF City Gurgaon
Call Us 📲8800102216📞 Call Girls In DLF City Gurgaon
 
8447779800, Low rate Call girls in Kotla Mubarakpur Delhi NCR
8447779800, Low rate Call girls in Kotla Mubarakpur Delhi NCR8447779800, Low rate Call girls in Kotla Mubarakpur Delhi NCR
8447779800, Low rate Call girls in Kotla Mubarakpur Delhi NCR
 
India Consumer 2024 Redacted Sample Report
India Consumer 2024 Redacted Sample ReportIndia Consumer 2024 Redacted Sample Report
India Consumer 2024 Redacted Sample Report
 

Etude PwC marché automobile mondial (2013)

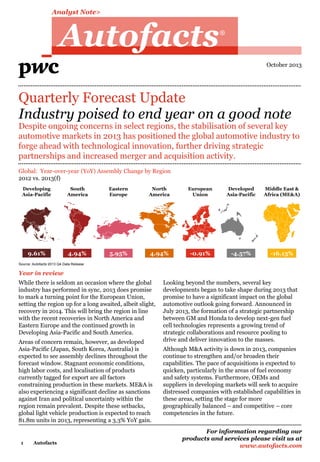
  • 1. Analyst Note> Autofacts R October 2013 Quarterly Forecast Update Industry poised to end year on a good note Despite ongoing concerns in select regions, the stabilisation of several key automotive markets in 2013 has positioned the global automotive industry to forge ahead with technological innovation, further driving strategic partnerships and increased merger and acquisition activity. Global: Year-over-year (YoY) Assembly Change by Region 2012 vs. 2013(f) Developing Asia-Pacific South America Eastern Europe North America European Union Developed Asia-Pacific Middle East & Africa (ME&A) 9.61% 4.94% 5.95% 4.94% -0.91% -4.57% -16.13% Source: Autofacts 2013 Q4 Data Release Year in review While there is seldom an occasion where the global industry has performed in sync, 2013 does promise to mark a turning point for the European Union, setting the region up for a long awaited, albeit slight, recovery in 2014. This will bring the region in line with the recent recoveries in North America and Eastern Europe and the continued growth in Developing Asia-Pacific and South America. Areas of concern remain, however, as developed Asia-Pacific (Japan, South Korea, Australia) is expected to see assembly declines throughout the forecast window. Stagnant economic conditions, high labor costs, and localisation of products currently tagged for export are all factors constraining production in these markets. ME&A is also experiencing a significant decline as sanctions against Iran and political uncertainty within the region remain prevalent. Despite these setbacks, global light vehicle production is expected to reach 81.8m units in 2013, representing a 3.3% YoY gain. 1 Autofacts Looking beyond the numbers, several key developments began to take shape during 2013 that promise to have a significant impact on the global automotive outlook going forward. Announced in July 2013, the formation of a strategic partnership between GM and Honda to develop next-gen fuel cell technologies represents a growing trend of strategic collaborations and resource pooling to drive and deliver innovation to the masses. Although M&A activity is down in 2013, companies continue to strengthen and/or broaden their capabilities. The pace of acquisitions is expected to quicken, particularly in the areas of fuel economy and safety systems. Furthermore, OEMs and suppliers in developing markets will seek to acquire distressed companies with established capabilities in these areas, setting the stage for more geographically balanced – and competitive – core competencies in the future. For information regarding our products and services please visit us at www.autofacts.com
  • 2. Analyst Note Plus North America Key Regional Statistics Key Statistics (YTD) US light vehicle sales +8.1% Canada light vehicle sales +5.0% Assembly 2012-2019 CAGR +2.8% Argentina light vehicle sales +18.7% +6.9% +8.9% Regional assembly +11.2% +3.4% Mexico light vehicle sales +2.5% Assembly 2012-2019 CAGR % Change (YoY) Brazil new light vehicle registrations Brazil light vehicle assembly Key Statistics (YTD) % Change (YoY) Sales All three countries in the North America continue to grow at impressive rates, with the US leading on a volume basis and Mexico on a percentage basis. The US market has sold more vehicles through September than it did all of 2010 and should easily surpass last years 14.4m units for the full year. Autofacts sees full-year 2013 sales reaching 15.6m units – the region’s fourth consecutive year with gains of over a million units. For 2014, Autofacts expects sales to reach 16.2m units which, though not as large as recent growth, would still represent a healthy gain. The question at hand for the US will now shift towards where the natural rate of demand will be now that the market has essentially recovered from the lows of 2009. Autofacts anticipates that demand for new vehicles will fluctuate between 16m to 17m units by the end of the decade. Canada is currently on track to have a record year for new vehicle sales, surpassing the previous high of 1.69m units in 2007. Autofacts currently forecasts Canadian sales to reach 1.74m units for the full year. Assembly Though mature and stable, the North American topline continues to expand with increasing vehicle sales and further investments by OEM’s in the region. The region is now forecasted to produce nearly 16.2m units in 2013, the highest number since 2002. Capacity in the region is forecasted to grow from 15.4m units in 2012 to 18.4m units in 2017. South America Key Regional Statistics Sales Encouraging growth seen in Brazil during the first 2 Autofacts half of the year has dissipated, even as the IPI tax holiday winds down in October. Stimulus measures including lowered interest rates have been offset by tighter credit restrictions in lending, restraining fullyear 2013 sales forecast to ~1.3% YoY growth. Brazil’s auto industry trade group, ANFAVEA, is aiming to improve the sales climate by lobbying for a change in leasing requirements that would shift the onus of taxes and fines from lenders to vehicle owners. Current leasing structures hold financial institutions accountable for payment of these fees, but a transfer of responsibility could encourage banks to increase lease lending and in turn, boost auto sales. While no changes have been enacted to date, the proposed modifications are expected to pass and could become effective before the end of the year. Argentina has enjoyed impressive YoY growth in new car sales, hitting record highs in the summer before slowing its pace in August. While the overall economy is expected to grow at less than 3%, auto sales have surged in 2013 with imports accounting for the majority of the growth in sales volume. As inflation and volatile currency exchanges continue to dog the economy, cars are considered safer investments, bolstering sales growth. Assembly In contrast to the stagnant sales market, the assembly volumes in Brazil have seen steady growth with full-year 2013 assembly expected to reach ~3.4m units. Several global OEMs, including GM, Volkswagen and Daimler, have announced capacity investments in the next few years, pushing assembly to just under 4m units by 2015. More announcements import tariffs continue incentivizing OEMs to produce locally. Meanwhile, Argentinean production has been impacted by the sluggish Brazilian sales market, seeing an overall decline in demand from their largest trading partner. Though assembly has not kept pace with sales, full year 2013 year growth of ~7.7% is still For information regarding our products and services please visit us at www.autofacts.com
  • 3. Analyst Note Plus expected. As with much of region, Argentina’s expansion hinges on multiple monetary and economic policy variables, most of which are subject to significant state intervention and thus remain volatile. European Union + EFTA Key Regional Statistics Key Statistics (YTD) % Change (YoY) New car sales -4.0% Sales forecast (full year) -3.0% Regional assembly -0.9% Regional 2012-2019 CAGR +2.5% Sales As predicted previously, this past summer is likely to have marked the bottom of the EU market following over five years of decline. Q3 2013 saw the first quarterly YoY growth in two years with a 2.6% improvement. Full-year registrations are expected to reach 12.15m – a 3% decline. Within the region, many markets are beginning to see growth with some of the hardest hit markets showing signs of sustained growth. Portuguese sales have increased over four consecutive months with a 15.7% rise in the third quarter, and Hungary has experienced seven consecutive months of gains with a 20% increase in the third quarter. Elsewhere, concerns remain regarding France, Italy and Germany, suggesting that total YoY growth in the fourth quarter could be lower than seen in the third quarter. The German market is underperforming given the low unemployment rates and strength of consumer sentiment, but it remains to be seen whether weakness is due, at least in part, to consumers holding off until the full outcome of the elections is known. Meanwhile, the UK – the region's second largest market and also the strongest performing market this year – has grown 10.8% year-to-date (YTD). However, fourth quarter YoY growth will likely be significantly lower, as demand was particularly strong in late 2012. For 2014, Autofacts anticipates growth of 3.5% to just under 12.6m units, with demand being constrained by continued high unemployment and weak economic growth in many European countries . As unemployment is expected to fall through 2014 and economic growth within the region starts to gain 3 Autofacts traction towards 2015, demand for new cars should increase. Assembly If assembly output is any indication, the low point has passed within the EU markets. Indeed, light vehicle assembly has shown surprisingly strong growth in select markets in the third quarter, with OEMs adding capacity and working days for the production of key models. Autofacts has revised the EU assembly forecast to 15.8m units for the full 2013, which is a meager 0.9% YoY decline. The 2014 outlook is expected to show signs of recovery with 3.2% growth forecasted as exports stabilise and vehicle output within the region is more closely tied to demand growth. Recent announcements regarding the planned assembly localisation by select OEMs will boost the assembly topline over the mid term. Approximately 500k units of assembly could be added, pushing regional output past the 17m mark by 2015 and also helping to push utilisation above 80% by 2016. Eastern Europe Key Regional Statistics Key Statistics (YTD) % Change (YoY) Russia new light vehicle registrations -6.4% Russia light vehicle assembly -0.6% Turkey light vehicle assembly +12.6% Regional 2012-2019 CAGR +6.0% Sales New vehicle sales and registrations within the Eastern European region continue to show diverse results between markets. Registrations are still on the downtrend in Russia with seven consecutive months of decline, prompting ministry officials to offer interest rate subsidies to stimulate sales. The program, enacted in July and continuing into 2014, is expected to boost sales by an estimated 250k units. Early consumer response has been positive, resulting in a reduction in the forecasted full-year decline of 5.9%, down from 6.1%. After a tough year in 2012, Turkey seemed back on track with sustained growth in 2013. September marked the first month of YoY decrease (-2.4%) due For information regarding our products and services please visit us at www.autofacts.com
  • 4. Analyst Note Plus to a number of factors, including shrinking domestic demand and a weakening export market. Additionally, the Turkish lira has depreciated against the US dollar due in part to uncertainty regarding the Federal Reserve’s bond-buying program. The unfavorable currency rates have constrained the import market which is primarily financed through bank loans. This current contraction is expected to be short lived, with fullyear 2013 sales in Turkey forecasted to reach 840k units for a 8.2% growth over 2012. Moderate but sustainable growth is anticipated for the surrounding Commonwealth of Independent States (CIS) going into 2014 and beyond, as countries like Kazakhstan continue to see increases in domestic demand as well as regional exports. Assembly Though the sales market has seen a slowdown in Russia, assembly remains slightly positive, with an additional ~12k units of output in 2013 as compared to 2012 to reach just under 2.1m units. More definitive growth is expected for 2014 and beyond, with investments by global OEMs looking to shift away from importing and increase domestic production. Turkey is already seeing a boost in locally produced models, including significant capacity increases for the Hyundai i10 and Toyota Corolla. Full-year 2013 production is expected to total ~1m units and reach nearly 1.2m units by 2014. Sales The Japanese light vehicle sales market continues to post declines, though it should be noted that 2012 growth was due in large part to the eco car cash incentives that pulled ahead sales. Even so, Japanese brands continue to struggle within their home market. Smaller, more efficient vehicles like minis and hybrids remain popular, increasing their respective market shares to 41% and 15%. Import sales volume s, though a relatively low portion of the total market at 172k units, are also experiencing robust growth, gaining a full percentage of market share from 4% to 5%. The long term outlook for the market as a whole remains bleak as an aging, urbanised population continues to contract with demand falling accordingly. Perhaps a silver lining can be found with the 2020 Tokyo Olympics, which could stimulate the economy and spur growth in auto sales. Vehicle sales in Australia grew to 737k units YTD, putting the market on pace for another year of sales surpassing the 1m unit mark. SUVs, particularly those with diesel engine variants, continue to gain favor with consumers with a 30% share of the total market. Meanwhile, once popular domestically sourced sedans have now dipped below 10% market share – a reflection of the quickly-shrinking assembly base. Other developing CIS nations are expanding assembly as well, increasing their production potential in hopes of attracting capacity investments. The region is rife with opportunity, and as long as progress continues, these emerging countries could become future assembly bases as OEMs continue towards the mantra of “build it where you sell it.” Consumers in South Korea have shown a marked shift towards imports, which have jumped 29% YoY as domestic brands have been holding flat in terms of sales. Free trade agreements and generous discounts have made import prices much more competitive, enticing consumers to shop beyond the confines of their home market brands. However, the South Korean population is experiencing demographic shifts not unlike that of Japan, suggesting a slower pace of growth in the long-term. Developed Asia-Pacific Australia, Japan, and South Korea Assembly Key Statistics (YTD) % Change (YoY) Japan light vehicle sales -8.0% South Korea light vehicle sales +3.0% Australia light vehicle sales +4% Regional assembly -4.6% Assembly 2012-2019 CAGR Concurrent declines in domestic sales and export volumes have resulted in decreased total assembly volumes in Japan, which are expected to decrease YoY by 6.8% to reach just over 8.7m for the full year. Though the Yen exchange rates have become more favourable to Japanese OEMs in recent months, investment in R&D centers, powertrain plants, and supplier parks within growing overseas markets is expected to continue. This long-term transition will require an industry-wide focus on addressing excess capacity going forward. -1.1% 4 Autofacts For information regarding our products and services please visit us at www.autofacts.com
  • 5. Analyst Note Plus With recent withdrawals from the Australian assembly base, volumes are expected to remain relatively flat around 250k units for the remainder of the decade. OEMs are expected to shift their product mixes to better reflect consumer preferences for SUVs, but such programs may not be sustainable should parliament discontinue incentives to retain manufacturing operations within Australian borders. Also holding flat are South Korean assembly volumes, growing at a scant 0.14% YoY to reach just under 4.4m units. Increasing labor costs, disruptive strikes, and the strengthening Won are all impacting the overall appeal of maintaining the country as an export base, and all will likely be factors as OEMs reconfigure their global footprint. With these constraints in mind, total South Korean assembly volume is forecasted to hover around the 4.5m mark for the remainder of the forecast window. Developing Asia-Pacific China and India Key Statistics (YTD) % Change (YoY) China light vehicle sales +13.5% China Light vehicle assembly +11.8% India light vehicle sales -8.0% India light vehicle assembly -5.1% Assembly CAGR 2012 to 2019 +7.7% China The sales environment in the Chinese market continued to grow throughout the first three quarters of the year, supported by strong consumer demand and a relatively low basis in 2012. YTD light vehicle sales have reached12.5m units for a positive gain when compared YoY. SUVs continue to outpace other segments, reporting an increase of 47.1% in YTD sales through August. Most major brands have brought recent introductions and/or refreshed crossover and SUV models to market to cash in on this trend. Sales are expected to remain strong through the remainder of the year despite economic uncertainty. Consumer sentiment has improved thanks to the official implementation of stricter vehicle recall policies, which are aimed to encourage higher quality through stiff penalties for delayed recall 5 Autofacts announcements. This, combined with anticipated product launches, will help encourage consumers to visit their local dealerships. Full-year 2013 sales are expected to reach 18.1m units, a 14.4% increase over 2012. It should be noted that Q4 2012 numbers were impacted by the territorial dispute over the Senkaku – Diaoyu islets. The closing months of 2013 should show a marked improvement over 2012 given the subsequent recovery of Japanese brands. China light vehicle assembly has also enjoyed continued expansion, with YTD assembly reaching 13.1m. Japanese brands are expected to increase their production to continue recovering lost market share. Though the year started off with slower production, strong consumer demand has driven higher levels of assembly, with full-year 2013 assembly expected to reach 18.5m units. India Until recently, India was seen as a high-potential, upcoming market with automakers benefitting greatly from a burst in consumer-driven growth in overall consumption, including new light vehicles. However, the industry is now struggling along with the national economy. Once growing over 50% between 2010 to 2012, sales of new vehicles are now in their ninth consecutive month of decline. Sagging customer demand has been compounded by a combination of deflating conditions. The growing current account deficit– a reflection of the widening gap between imports and exports – has triggered fluctuations in the dollar to Rupee exchange rate. While the currency has rebounded since plunging to all-time lows in August, the auto sector faces additional industry-specific hurdles. Utility vehicles, which reign as one of the most popular segments, are now subject to a 3% tax, while high financing costs and rising fuel prices are dampening hopes for a turnaround in demand. As monsoon season comes to an end, there is hope that perhaps the downturn will soon be a thing of the past, particularly for rural households whose income has the potential to give a much needed boost to the Indian light vehicle market. However, the slow pace of policy reform and the widespread infrastructure issues will continue to restrain sales in the short term. Full-year sales is forecasted to decline by over 5% for 2013, with hope that the new year will help boost consumer sentiment and in turn, sustainable growth in sales and assembly for the remainder of the forecast window. For information regarding our products and services please visit us at www.autofacts.com
  • 6. Analyst Note Plus Baseline assembly forecast data - Global Growth analytics (2012-2017) Region1 2012 2013 2014 2015 2016 2017 Unit diff. % chg CAGR 1 Asia-Pacific - developing 24,517,872 26,869,862 29,985,847 33,157,119 36,246,221 38,475,473 13,957,601 56.9% 9.4% 62.1% 1 2 European Union 15,915,153 15,770,608 16,267,392 17,494,732 18,342,376 18,756,292 2,841,139 17.9% 3.3% 12.6% 3 3 North America 15,395,983 16,159,124 16,789,907 17,492,206 17,871,117 18,406,259 3,010,276 19.6% 3.6% 13.4% 2 4 Asia-Pacific - developed 13,973,140 13,334,889 13,303,820 13,199,781 13,053,183 13,060,688 -912,452 -6.5% -1.3% -4.1% 7 5 South America 4,171,558 4,504,482 4,710,604 5,202,280 5,778,910 6,088,041 1,916,483 45.9% 7.9% 8.5% 4 6 Eastern Europe 3,477,104 3,683,936 3,968,579 4,298,634 4,600,708 4,901,262 1,424,158 41.0% 7.1% 6.3% 5 7 Middle East & Africa 1,798,824 1,508,615 1,561,357 1,688,720 1,862,921 2,041,409 242,585 13.5% 2.6% 1.1% 6 Global total assembly 79,249,634 81,831,516 86,587,506 92,533,472 97,755,436 101,729,424 22,479,790 28.4% 5.1% 100.0% Global total capacity 101,908,978 106,372,936 112,878,507 120,437,439 125,163,201 125,550,516 23,641,538 23.2% 4.3% 22,659,344 24,541,420 26,291,001 27,903,967 27,407,765 23,821,092 1,161,748 5.1% 1.0% 77.8% 76.9% 76.7% 76.8% 78.1% 81.0% Global excess capacity Global utilisation (%) Country CTG % Rank2 2012 2013 2014 2015 2016 2017 Unit diff. % chg CAGR 1 China 16,696,064 18,483,049 20,706,735 23,080,285 25,155,718 26,584,689 9,888,625 59.2% 9.7% 44.0% 2 USA 10,097,912 10,899,425 11,668,762 12,239,215 12,568,368 12,915,180 2,817,268 27.9% 5.0% 12.5% 2 3 Japan 9,359,348 8,725,480 8,621,405 8,414,025 8,298,129 8,247,445 -1,111,903 -11.9% -2.5% -4.9% 52 4 Germany 5,645,037 5,553,945 5,576,088 5,748,887 5,923,726 6,187,879 542,842 9.6% 1.9% 2.4% 9 5 South Korea 4,384,596 4,390,690 4,427,454 4,521,544 4,501,071 4,550,320 165,724 3.8% 0.7% 0.7% 18 6 India 3,425,285 3,320,802 3,474,624 3,864,083 4,527,925 5,131,886 1,706,601 49.8% 8.4% 7.6% 3 7 Brazil 3,109,008 3,396,837 3,597,534 3,980,955 4,483,115 4,692,702 1,583,694 50.9% 8.6% 7.0% 4 8 Mexico 2,847,732 2,917,970 2,940,150 3,158,454 3,250,892 3,383,961 536,229 18.8% 3.5% 2.4% 10 9 Thailand 2,313,284 2,696,605 2,919,141 3,181,813 3,410,355 3,539,623 1,226,339 53.0% 8.9% 5.5% 5 10 Spain 1,944,656 2,098,781 2,244,922 2,588,567 2,763,196 2,837,222 892,566 45.9% 7.8% 4.0% 6 11 Russia 2,087,860 2,099,680 2,238,099 2,414,108 2,639,883 2,837,315 749,455 35.9% 6.3% 3.3% 7 12 Canada 2,450,339 2,341,729 2,180,995 2,094,537 2,051,857 2,107,118 -343,221 -14.0% -3.0% -1.5% 51 13 France 1,950,044 1,822,344 1,926,742 2,017,717 2,235,381 2,319,130 369,086 18.9% 3.5% 1.6% 13 14 United Kingdom 1,558,165 1,592,162 1,557,026 1,685,346 1,711,707 1,733,732 175,567 11.3% 2.2% 0.8% 17 945,577 1,124,017 1,442,492 1,507,317 1,574,886 1,608,903 663,326 70.2% 11.2% 3.0% 8 16 Turkey 1,005,200 1,097,103 1,166,286 1,283,226 1,342,576 1,422,390 417,190 41.5% 7.2% 1.9% 12 17 Czech Republic 15 Indonesia CTG % Rank 1 1,088,377 1,011,659 1,111,395 1,161,287 1,165,859 1,174,817 86,440 7.9% 1.5% 0.4% 23 18 Italy 635,165 576,438 621,324 957,028 1,109,123 1,167,750 532,585 83.8% 13.0% 2.4% 11 20 Argentina 736,336 793,638 766,387 848,524 906,713 977,053 240,717 32.7% 5.8% 1.1% 15 1,063,403 698,636 677,727 732,501 850,096 976,819 -86,584 -8.1% -1.7% -0.4% 49 21 Slovakia 779,411 817,037 831,563 797,388 777,167 718,286 -61,125 -7.8% -1.6% -0.3% 48 22 Malaysia 547,478 607,186 765,274 820,421 857,499 881,465 333,987 61.0% 10.0% 1.5% 14 23 Poland 635,841 582,772 556,818 604,160 667,585 654,218 18,377 2.9% 0.6% 0.1% 37 24 South Africa 538,799 537,947 575,975 608,624 619,678 633,263 94,464 17.5% 3.3% 0.4% 22 25 Hungary 230,727 325,140 465,037 497,144 451,645 414,749 184,022 79.8% 12.4% 0.8% 16 26 Belgium 504,633 441,721 414,589 299,944 307,849 318,574 -186,059 -36.9% -8.8% -0.8% 50 27 Romania 338,182 411,131 372,907 354,981 348,323 347,065 8,883 2.6% 0.5% 0.0% 41 28 Taiwan 315,922 340,038 355,958 351,517 359,319 354,284 38,362 12.1% 2.3% 0.2% 32 29 Uzbekistan 243,603 265,870 253,494 261,204 267,776 277,983 34,380 14.1% 2.7% 0.2% 33 30 Australia 229,196 218,719 254,961 264,212 253,983 262,923 33,727 14.7% 2.8% 0.2% 34 31 Morocco 108,726 184,962 215,463 232,358 248,195 258,809 150,083 138.0% 18.9% 0.7% 19 32 Sweden 151,183 142,763 150,959 228,177 257,191 259,640 108,457 71.7% 11.4% 0.5% 21 33 Colombia 149,749 151,126 174,995 184,907 188,232 197,079 47,330 31.6% 5.6% 0.2% 28 34 Pakistan 151,814 153,074 163,290 176,051 176,515 181,756 29,942 19.7% 3.7% 0.1% 36 35 Slovenia 130,949 84,881 127,836 166,401 188,409 170,983 40,034 30.6% 5.5% 0.2% 30 78,399,601 80,905,357 85,544,407 91,326,908 96,439,942 100,327,011 21,927,410 28.0% 5.1% 97.5% 98.9% 98.9% 98.8% 98.7% 98.7% 98.6% 97.5% 20 Iran Top 35 total assembly Top 35 (% of global total) 1Developed Asia-Pacific includes Australia, Japan, South Korea | Developing Asia-Pacific includes China, India, Indonesia, Malaysia, Pakistan, Philippines, Taiwan, Thailand, Vietnam 2Rankings based on contribution to total global growth (CTG%). Source: Autofacts Global Light Vehicle Assembly Outlook 2013 Q4 Data Release (Updated October 01 2013) 6 Autofacts October 2013 For more information please visit us at www.autofacts.com
  • 7. Analyst Note Plus Baseline assembly forecast data - Global Growth analytics (2012-2017) Alliance group 2012 2013 2014 2015 2016 2017 Unit diff. % chg CAGR 10,589,068 10,665,006 10,836,569 11,022,746 11,174,085 11,411,592 822,524 7.8% 1.5% 3.7% 9 2 GM Group 9,375,145 9,803,594 10,218,378 10,766,942 11,639,801 12,161,075 2,785,930 29.7% 5.3% 12.4% 1 3 VW Group 9,184,443 9,563,663 9,900,626 10,661,606 11,527,849 11,954,017 2,769,574 30.2% 5.4% 12.3% 2 4 Renault-Nissan 8,023,485 8,048,195 8,839,747 9,689,230 10,176,969 10,536,836 2,513,351 31.3% 5.6% 11.2% 3 5 Hyundai Group 7,182,498 7,520,959 7,827,461 7,959,059 8,404,049 8,744,268 1,561,770 21.7% 4.0% 6.9% 6 6 Ford Group 5,456,831 6,067,175 6,304,561 6,794,493 7,191,385 7,393,243 1,936,412 35.5% 6.3% 8.6% 4 7 Fiat Group 4,402,225 4,309,137 4,399,083 5,049,898 5,737,443 6,152,532 1,750,307 39.8% 6.9% 7.8% 5 8 Honda Group 4,069,175 4,390,264 4,960,185 5,299,797 5,393,121 5,501,202 1,432,027 35.2% 6.2% 6.4% 7 9 PSA Group 3,079,569 3,159,426 3,372,918 3,620,519 3,778,591 3,975,185 895,616 29.1% 5.2% 4.0% 8 10 Suzuki Group 2,455,203 2,306,651 2,352,701 2,444,991 2,463,554 2,689,893 234,690 9.6% 1.8% 1.0% 19 11 BMW Group 1,917,852 2,044,141 2,077,931 2,197,657 2,313,997 2,404,673 486,821 25.4% 4.6% 2.2% 14 12 Daimler Group 1,732,727 1,864,060 1,982,371 2,144,347 2,145,872 2,293,872 561,145 32.4% 5.8% 2.5% 11 13 Mazda 1,327,881 1,423,460 1,619,898 1,724,378 1,746,766 1,827,489 499,608 37.6% 6.6% 2.2% 13 14 Mitsubishi Group 1,104,103 1,189,377 1,419,732 1,525,383 1,498,254 1,502,978 398,875 36.1% 6.4% 1.8% 15 943,756 979,823 1,110,975 1,303,174 1,385,152 1,466,287 522,531 55.4% 9.2% 2.3% 12 1,035,616 899,508 1,064,493 885,910 1,163,735 977,618 1,237,841 1,185,363 1,284,361 1,367,344 1,273,957 1,492,758 238,341 593,250 23.0% 66.0% 4.2% 10.7% 1.1% 2.6% 18 10 18 Great Wall 645,497 758,574 760,880 812,508 894,764 943,531 298,034 46.2% 7.9% 1.3% 17 19 Dong Feng 680,771 728,580 734,864 745,966 734,991 760,980 80,209 11.8% 2.3% 0.4% 28 20 Chery Auto 590,701 518,147 654,291 755,285 878,192 938,311 347,610 58.8% 9.7% 1.5% 16 Top 20 total assembly 74,696,054 77,290,635 81,514,524 86,941,183 91,736,540 95,424,679 20,728,625 27.8% 5.0% 92.2% Top 20 total capacity 92,760,354 96,903,411 102,374,547 109,595,395 113,841,435 114,250,431 21,490,077 23.2% 4.3% 90.9% Excess capacity 18,064,300 19,612,776 20,860,023 22,654,212 22,104,895 18,825,752 761,452 4.2% 0.8% 100.0% 80.5% 79.8% 79.6% 79.3% 80.6% 83.5% Unit diff. % chg CAGR 5,729,959 4896.0% 118.6% 1 Toyota Group 15 Geely Group 16 Chang'an Group 17 Tata Group Global utilisation (%) Platform CTG % Rank 2012 2013 2014 2015 2016 2017 117,033 1,052,806 2,024,485 4,227,384 5,573,664 5,846,992 25.5% 1 2 HD 2,476,850 2,864,858 2,902,775 2,878,964 3,023,216 3,242,786 765,936 30.9% 5.5% 3.4% 16 3 MC (Toyota Motor Corporation) 3,186,827 3,327,878 3,243,274 2,997,011 2,541,209 1,707,308 -1,479,519 -46.4% -11.7% -6.6% 385 4 C1/P1 2,081,575 2,400,903 2,237,893 2,396,493 2,364,356 2,464,502 382,927 18.4% 3.4% 1.7% 33 5 PQ35/46 (A5) 4,106,435 3,232,515 2,678,048 1,630,627 1,069,452 985,782 -3,120,653 -76.0% -24.8% -13.9% 386 6 X85/B 1,913,339 1,871,375 1,939,999 2,024,664 2,018,795 2,100,670 187,331 9.8% 1.9% 0.8% 54 7 GLOBAL DELTA 1,528,738 1,560,474 1,621,395 1,808,573 2,067,817 2,729,367 1,200,629 78.5% 12.3% 5.3% 7 8 NF 1,619,693 1,662,940 1,621,534 1,768,305 1,971,117 1,965,553 345,860 21.4% 3.9% 1.5% 36 9 HGSC 1,266,551 1,447,107 1,815,615 1,808,260 1,872,370 2,008,536 741,985 58.6% 9.7% 3.3% 17 866,609 1,393,223 1,530,607 1,753,717 2,123,744 2,231,576 1,364,967 157.5% 20.8% 6.1% 4 11 NBC 1,760,019 1,651,163 1,712,460 1,735,907 1,546,558 1,184,579 -575,440 -32.7% -7.6% -2.6% 381 12 MINICAB 1,458,294 1,496,369 1,486,542 1,502,337 1,494,700 1,568,384 110,090 7.5% 1.5% 0.5% 66 951,239 1,186,428 1,404,946 1,625,478 1,772,018 1,800,726 849,487 89.3% 13.6% 3.8% 14 14 CARRY 1,426,999 1,269,537 1,365,217 1,354,239 1,313,850 1,267,985 -159,014 -11.1% -2.3% -0.7% 355 15 150L 1,278,209 1,251,645 1,470,783 1,378,790 1,284,355 1,295,452 17,243 1.3% 0.3% 0.1% 134 16 X84/C 1,712,659 1,668,120 1,237,912 1,071,481 937,252 1,053,111 -659,548 -38.5% -9.3% -2.9% 382 17 B0 (Renault) 1,006,884 1,150,378 1,172,712 1,299,304 1,466,716 1,582,058 575,174 57.1% 9.5% 2.6% 24 18 FIAT/GM 199/4400 1,344,607 1,294,877 1,330,435 1,348,548 977,569 908,544 -436,063 -32.4% -7.5% -1.9% 373 19 MLB 1,001,953 1,063,384 1,130,168 1,208,039 1,247,614 1,462,622 460,669 46.0% 7.9% 2.0% 27 20 IMV 1,134,149 1,103,028 1,136,577 1,159,559 1,175,258 1,202,112 67,963 6.0% 1.2% 0.3% 87 32,238,662 33,949,008 35,063,377 36,977,680 37,841,630 38,608,645 6,369,983 19.8% 3.7% 28.3% 40.7% 41.5% 40.5% 40.0% 38.7% 38.0% 28.3% 1 MQB 10 GLOBAL GAMMA 13 B2E Top 20 total assembly Top 20 (% of global total) 7 Autofacts October 2013 CTG % Rank For more information please visit us at www.autofacts.com
  • 8. Analyst Note Plus Baseline assembly forecast data - Global Growth analytics (2012-2017) Brand 2012 2013 2014 2015 2016 2017 Unit diff. % chg CAGR 1 Toyota 8,227,545 8,271,188 8,367,027 8,460,881 8,572,841 8,766,240 538,695 6.5% 1.3% 2.4% 10 2 Volkswagen 6,265,324 6,477,696 6,532,405 7,015,506 7,494,991 7,645,970 1,380,646 22.0% 4.1% 6.1% 3 3 Ford 5,371,299 5,965,254 6,169,705 6,605,414 6,898,364 7,086,488 1,715,189 31.9% 5.7% 7.6% 1 4 Chevrolet 4,850,991 5,114,329 5,475,092 5,781,409 6,141,961 6,353,937 1,502,946 31.0% 5.5% 6.7% 2 5 Nissan 4,618,921 4,637,039 5,161,325 5,378,728 5,370,883 5,476,366 857,445 18.6% 3.5% 3.8% 6 6 Hyundai 4,465,491 4,694,422 4,926,928 4,962,462 5,245,108 5,521,091 1,055,600 23.6% 4.3% 4.7% 5 7 Honda 3,823,990 4,162,206 4,722,123 4,991,291 4,970,857 5,075,245 1,251,255 32.7% 5.8% 5.6% 4 8 Kia 2,700,661 2,805,246 2,853,117 2,949,761 3,110,401 3,177,150 476,489 17.6% 3.3% 2.1% 16 9 Renault 2,124,621 2,057,784 2,098,533 2,344,529 2,653,007 2,740,043 615,422 29.0% 5.2% 2.7% 9 10 Peugeot 1,812,031 1,828,337 1,906,724 2,038,037 2,148,825 2,215,384 403,353 22.3% 4.1% 1.8% 17 11 Fiat 1,873,105 1,748,878 1,691,534 1,865,835 2,241,599 2,390,468 517,363 27.6% 5.0% 2.3% 13 12 Mercedes-Benz 1,624,676 1,772,002 1,887,606 1,994,294 1,990,951 2,148,261 523,585 32.2% 5.7% 2.3% 12 13 BMW 1,603,075 1,708,872 1,760,604 1,842,465 1,898,369 1,972,730 369,655 23.1% 4.2% 1.6% 19 14 Audi 1,469,197 1,601,384 1,703,028 1,850,000 1,894,584 2,004,078 534,881 36.4% 6.4% 2.4% 11 15 Mazda 1,327,881 1,423,460 1,619,898 1,724,378 1,746,766 1,827,489 499,608 37.6% 6.6% 2.2% 14 16 Suzuki 1,460,480 1,397,280 1,523,926 1,556,303 1,573,492 1,600,919 140,439 9.6% 1.9% 0.6% 42 17 Citroen 1,267,538 1,331,089 1,466,194 1,582,482 1,629,766 1,759,801 492,263 38.8% 6.8% 2.2% 15 18 Wuling 1,383,305 1,403,522 1,450,579 1,462,938 1,449,767 1,520,944 137,639 10.0% 1.9% 0.6% 43 19 Mitsubishi 1,030,404 1,091,331 1,307,396 1,419,515 1,399,817 1,407,209 376,805 36.6% 6.4% 1.7% 18 875,260 1,032,722 1,060,289 1,216,206 1,516,421 1,547,200 671,940 76.8% 12.1% 3.0% 8 58,175,795 60,524,041 63,684,033 67,042,434 69,948,770 72,237,013 14,061,218 24.2% 4.4% 62.6% 73.4% 74.0% 73.5% 72.5% 71.6% 71.0% 62.6% 20 Buick Top 20 total assembly Top 20 (% of global total) Brand Nameplate CTG % Rank 2012 2013 2014 2015 2016 2017 Unit diff. % chg CAGR 1 Toyota Corolla 1,198,249 1,170,453 1,263,224 1,229,445 1,210,340 1,262,997 64,748 5.4% 1.1% 0.3% 2 Ford Focus 1,040,077 1,129,343 995,605 932,617 1,054,209 1,127,210 87,133 8.4% 1.6% 0.4% 77 3 Ford F-Series 843,933 919,729 1,005,660 902,832 900,534 898,655 54,722 6.5% 1.3% 0.2% 164 4 Toyota Camry 858,421 869,499 859,040 885,685 909,514 905,243 46,822 5.5% 1.1% 0.2% 198 5 Hyundai Elantra/i30 764,844 848,300 809,436 786,054 833,925 951,760 186,916 24.4% 4.5% 0.8% 13 6 Ford Fiesta 715,832 738,415 744,515 800,067 884,818 911,348 195,516 27.3% 4.9% 0.9% 11 7 Volkswagen Golf 626,208 625,196 751,348 899,098 929,705 927,212 301,004 48.1% 8.2% 1.3% 3 8 Chevrolet Cruze 769,470 734,015 745,464 750,894 783,559 775,603 6,133 0.8% 0.2% 0.0% 671 9 Honda CR-V 698,421 755,687 732,287 708,466 742,042 759,634 61,213 8.8% 1.7% 0.3% 138 10 Honda Civic 717,377 717,557 702,871 704,883 688,399 711,500 -5,877 -0.8% -0.2% 0.0% 1223 11 Volkswagen Polo 668,642 648,143 650,729 656,977 758,350 795,367 126,725 19.0% 3.5% 0.6% 12 Volkswagen Passat 604,468 589,736 586,680 646,510 710,959 720,783 116,315 19.2% 3.6% 0.5% 43 13 Toyota Hilux Vigo 622,860 610,336 618,250 627,410 630,375 648,206 25,346 4.1% 0.8% 0.1% 350 14 Honda Accord 546,470 650,989 644,158 629,568 647,501 637,089 90,619 16.6% 3.1% 0.4% 75 15 Hyundai Sonata/i40 549,618 524,553 520,309 538,938 619,641 630,478 80,860 14.7% 2.8% 0.4% 87 16 Hyundai Tucson/iX35 554,374 556,181 502,803 520,611 548,174 591,701 37,327 6.7% 1.3% 0.2% 257 17 Chevrolet Silverado 508,821 544,182 563,009 557,899 542,655 555,155 46,334 9.1% 1.8% 0.2% 201 18 Toyota Prius 497,279 564,866 530,193 539,133 533,252 538,900 41,621 8.4% 1.6% 0.2% 229 19 Wuling Sunshine 523,274 489,196 510,193 531,231 540,363 569,756 46,482 8.9% 1.7% 0.2% 200 20 Chang'an SC63/10 Series 500,466 445,529 514,137 498,217 512,854 450,694 -49,772 -9.9% -2.1% -0.2% 1407 13,809,104 14,131,905 14,249,911 14,346,535 14,981,169 15,369,291 1,560,187 11.3% 2.2% 6.9% 17.4% 17.3% 16.5% 15.5% 15.3% 15.1% 6.9% Top 20 total assembly Top 20 (% of global total) 8 Autofacts October 2013 CTG % Rank 128 37 For more information please visit us at www.autofacts.com
  • 9. Analyst Note Plus Baseline forecast data – Global powertrain Growth analytics (2012-2017) Engine family [designer] 2012 2013 2014 2015 2016 2017 Unit diff. 1 EA111/112 [VW] 3,414,936 3,356,226 3,266,139 3,230,542 3,405,180 3,468,237 53,301 1.6% 4.3% 3.4% 2 S [Renault-Nissan] 1,756,871 2,127,014 2,808,964 3,420,220 3,671,494 3,810,050 2,053,179 116.9% 2.2% 3.7% 3 EA827/113/888 [VW] 2,598,229 2,665,235 2,679,033 2,760,162 2,765,665 2,866,637 268,408 10.3% 3.3% 2.8% 4 ZR [Toyota] 2,148,885 2,291,669 2,500,852 2,550,732 2,560,730 2,610,486 461,601 21.5% 2.7% 2.6% 5 MZR/DURATEC HE [Mazda] 1,805,436 2,336,083 2,442,014 2,659,292 2,736,796 2,674,534 869,098 48.1% 2.3% 2.6% 6 EA086/153/188 [VW] 2,282,942 2,169,089 2,276,353 2,453,432 2,530,271 2,560,066 277,124 12.1% 2.9% 2.5% 7 THETA II [Hyundai] 1,890,154 2,200,145 2,258,047 2,421,793 2,696,162 2,706,911 816,757 43.2% 2.4% 2.7% 8 K [Renault] 1,943,259 1,897,181 1,828,708 1,857,900 2,069,408 2,258,459 315,200 16.2% 2.5% 2.2% 9 GAMMA [Hyundai] 1,772,230 1,842,755 1,965,435 1,932,504 2,055,027 2,196,655 424,425 23.9% 2.2% 2.2% 10 BDOHC [GM Korea] 2,215,959 2,165,925 2,251,687 1,864,963 1,574,707 1,592,304 -623,655 -28.1% 2.8% 1.6% 21,828,901 23,051,322 24,277,232 25,151,540 26,065,440 26,744,339 4,915,438 22.5% 27.5% 26.3% 27.5% 28.2% 28.0% 27.2% 26.7% 26.3% 21.9% 2017 Unit diff. Top 10 total consumption Top 10 (% of total consumption) Engine size % chg 2012 share 2017 share 2012 2013 2014 2015 2016 1 1001-1600 cc 30,149,695 30,770,538 33,006,549 35,560,069 38,688,008 40,751,424 10,601,729 35.2% 38.0% 40.1% 2 1601-2000 cc 17,015,238 18,412,102 19,371,580 20,646,661 21,148,932 21,947,148 4,931,910 29.0% 21.5% 21.6% 3 2001-3000 cc 14,705,773 14,888,044 15,682,133 16,695,787 17,378,671 17,726,767 3,020,994 20.5% 18.6% 17.4% 4 0000-1000 cc 7,574,307 7,885,250 8,647,673 9,764,231 10,611,788 11,175,270 3,600,963 47.5% 9.6% 11.0% 5 3001-4000 cc 6,414,192 6,316,974 6,169,579 6,087,014 5,997,114 5,998,222 -415,970 -6.5% 8.1% 5.9% 6 4001-9999 cc 3,263,626 3,335,510 3,192,739 3,028,066 3,008,237 3,101,208 -162,418 -5.0% 4.1% 3.0% 126,803 223,098 517,253 751,644 922,686 1,029,385 902,582 711.8% 0.2% 1.0% 79,249,634 81,831,516 86,587,506 92,533,472 97,755,436 101,729,424 22,479,790 28.4% 100.0% 100.0% 7 Electric Total consumption Fuel type 2012 2013 2014 2015 2016 1 Combustion Gasoline 61,779,916 63,855,123 67,292,024 71,558,019 75,191,834 78,018,013 16,238,097 26.3% 78.0% 76.7% 2 Combustion Diesel 15,292,829 15,217,745 15,752,418 16,724,752 17,626,980 18,283,540 2,990,711 19.6% 19.3% 18.0% 3 Hybrid (Mild+Full) 1,999,550 2,416,983 2,809,404 3,025,169 3,331,384 3,532,537 1,532,987 76.7% 2.5% 3.5% 177,339 341,665 733,660 1,225,532 1,605,238 1,895,334 1,717,995 968.8% 0.2% 1.9% 79,249,634 81,831,516 86,587,506 92,533,472 97,755,436 101,729,424 22,479,790 28.4% 100.0% 100.0% 4 PEV+PHEV (Electric) Total consumption Transmission outlook 2017 Unit diff. % chg 2012 share 2017 share % chg 2012 share 2017 share 2012 2013 2014 2015 2016 2017 Unit diff. 1 Manual 39,152,396 39,052,823 40,698,632 42,988,328 45,251,460 46,982,459 7,830,063 20.0% 49.4% 46.2% 2 Automatic 28,487,636 29,106,005 29,857,143 30,888,524 31,662,127 32,155,958 3,668,322 12.9% 35.9% 31.6% 3 Continuously Variable 7,981,726 9,022,516 10,141,040 10,588,283 10,852,375 11,748,211 3,766,485 47.2% 10.1% 11.5% 4 Automated Manual Double Clutch 2,713,382 3,598,498 4,429,636 6,240,362 7,938,564 8,620,185 5,906,803 217.7% 3.4% 8.5% 5 Automated Manual 747,186 751,928 821,454 921,636 948,034 966,354 219,168 29.3% 0.9% 0.9% 6 Electric 159,725 285,797 612,280 870,393 1,066,327 1,216,508 1,056,783 661.6% 0.2% 1.2% 7,583 13,949 27,321 35,946 36,549 39,749 32,166 424.2% 0.0% 0.0% 79,249,634 81,831,516 86,587,506 92,533,472 97,755,436 101,729,424 22,479,790 28.4% 100.0% 100.0% 7 Automatic Hybrid Total consumption Gear outlook % chg 2012 share 2017 share 2012 2013 2014 2015 2016 2017 Unit diff. 1 5 33,271,625 31,894,051 31,766,442 32,503,283 33,443,665 33,942,182 670,557 2.0% 42.0% 33.4% 2 6 25,798,685 28,421,387 30,242,886 31,361,705 32,862,715 33,375,583 7,576,898 29.4% 32.6% 32.8% 3 Continuously Variable 7,981,726 9,022,516 10,141,040 10,588,283 10,852,375 11,748,211 3,766,485 47.2% 10.1% 11.5% 4 4 8,165,088 6,828,777 6,548,392 6,520,060 6,330,262 6,508,562 -1,656,526 -20.3% 10.3% 6.4% 5 8 or more 1,641,332 2,676,620 3,895,200 5,794,600 7,008,090 8,245,573 6,604,241 402.4% 2.1% 8.1% 6 7 2,129,034 2,601,317 3,189,081 4,700,574 5,999,997 6,500,319 4,371,285 205.3% 2.7% 6.4% 262,144 386,848 804,465 1,064,967 1,258,332 1,408,994 1,146,850 437.5% 0.3% 1.4% 79,249,634 81,831,516 86,587,506 92,533,472 97,755,436 101,729,424 22,479,790 28.4% 100.0% 100.0% 7 3 or less Total consumption 9 Autofacts October 2013 % chg 2012 share 2017 share For more information please visit us at www.autofacts.com
  • 10. Analyst Note Plus Baseline assembly forecast data – North America 1 2 3 4 5 6 7 8 9 10 1 2 3 4 5 6 7 8 9 10 1 2 3 4 5 6 7 8 9 10 1 2 3 4 5 6 7 8 9 10 10 Alliance group GM Group Ford Group Fiat Group Toyota Group Honda Group Renault-Nissan Hyundai Group VW Group BMW Group Daimler Group Top 10 total assembly Top 10 total capacity Excess capacity Utilisation (%) Growth analytics Unit diff. % chg 528,073 16.3% 307,322 11.0% 358,513 15.2% 346,619 17.7% 160,764 9.5% 378,615 29.1% 345,616 48.0% 279,988 37.1% 9,456 3.1% 91,089 47.7% 2,806,055 18.3% 3,936,516 24.6% 1,130,461 157.1% (2012-2017) CAGR CTG % Rank 3.1% 17.5% 1 2.1% 10.2% 6 2.9% 11.9% 3 3.3% 11.5% 4 1.8% 5.3% 8 5.2% 12.6% 2 8.2% 11.5% 5 6.5% 9.3% 7 0.6% 0.3% 13 8.1% 3.0% 10 3.4% 93.2% 4.5% 94.9% 20.8% 100.0% 2017 651,173 1,086,592 879,899 724,166 781,156 576,577 735,037 939,354 199,989 516,001 7,089,944 38.5% Unit diff. -436,058 1,086,592 357,509 65,419 200,606 99,505 629,029 571,941 -547,025 94,412 2,121,930 70.5% % chg -40.1% 0.0% 68.4% 9.9% 34.6% 20.9% 593.4% 155.7% -73.2% 22.4% 42.7% CAGR -9.7% 0.0% 11.0% 1.9% 6.1% 3.9% 47.3% 20.7% -23.2% 4.1% 7.4% CTG % Rank -14.5% 83 36.1% 1 11.9% 8 2.2% 28 6.7% 14 3.3% 23 20.9% 5 19.0% 6 -18.2% 84 3.1% 25 70.5% 2016 2,861,965 2,488,787 1,810,730 1,623,551 1,633,605 963,225 907,862 433,539 564,859 666,248 13,954,371 78.1% 2017 2,898,000 2,532,967 1,880,902 1,632,965 1,626,302 1,049,423 885,207 426,868 604,034 728,780 14,265,448 77.5% Unit diff. 178,599 263,235 194,605 117,997 359,440 334,775 129,531 -283,126 65,025 269,341 1,629,422 54.1% % chg 6.6% 11.6% 11.5% 7.8% 28.4% 46.8% 17.1% -39.9% 12.1% 58.6% 12.9% CAGR 1.3% 2.2% 2.2% 1.5% 5.1% 8.0% 3.2% -9.7% 2.3% 9.7% 2.5% CTG % Rank 5.9% 8 8.7% 4 6.5% 6 3.9% 12 11.9% 1 11.1% 2 4.3% 10 -9.4% 33 2.2% 19 8.9% 3 54.1% 2016 889,487 539,262 460,093 450,767 401,818 376,833 356,081 339,266 342,816 331,216 4,487,639 25.1% 2017 887,480 551,422 516,001 474,471 383,819 392,167 371,404 361,934 340,284 337,143 4,616,125 25.1% Unit diff. 52,814 46,039 94,412 21,508 -16,324 -3,720 6,067 30,633 5,574 -18,721 218,282 7.3% % chg 6.3% 9.1% 22.4% 4.7% -4.1% -0.9% 1.7% 9.2% 1.7% -5.3% 5.0% CAGR 1.2% 1.8% 4.1% 0.9% -0.8% -0.2% 0.3% 1.8% 0.3% -1.1% 1.0% CTG % Rank 1.8% 28 1.5% 33 3.1% 16 0.7% 65 -0.5% 179 -0.1% 160 0.2% 107 1.0% 55 0.2% 113 -0.6% 182 7.3% 2012 3,233,624 2,804,933 2,362,712 1,957,777 1,690,235 1,299,613 719,547 755,676 301,522 191,138 15,316,777 16,036,254 719,477 95.5% 2013 3,353,386 3,097,854 2,378,365 2,033,206 1,746,421 1,506,247 772,250 692,254 294,978 200,360 16,075,321 17,496,197 1,420,876 91.9% 2014 3,555,004 3,095,074 2,454,763 2,094,721 1,808,869 1,665,693 785,329 623,854 329,398 231,797 16,644,502 18,431,696 1,787,194 90.3% 2015 3,639,624 3,049,890 2,527,266 2,198,890 1,831,129 1,724,857 812,361 842,641 333,285 291,505 17,251,448 19,240,881 1,989,433 89.7% 2016 3,643,931 3,072,439 2,568,452 2,182,037 1,845,262 1,685,712 1,016,748 1,005,165 320,031 269,067 17,608,844 19,867,052 2,258,208 88.6% 2017 3,761,697 3,112,255 2,721,225 2,304,396 1,850,999 1,678,228 1,065,163 1,035,664 310,978 282,227 18,122,832 19,972,770 1,849,938 90.7% 2012 1,087,231 0 522,390 658,747 580,550 477,072 106,008 367,413 747,014 421,589 4,968,014 32.3% 2013 1,202,887 392,098 741,455 712,974 574,080 593,395 400,516 375,492 690,759 445,699 6,129,355 37.9% 2014 1,232,624 1,002,933 730,432 799,792 620,366 558,823 551,842 387,485 623,854 502,190 7,010,341 41.8% 2015 1,313,876 1,083,075 724,019 716,284 658,052 599,773 743,843 445,827 398,051 481,511 7,164,311 41.0% 2016 1,036,343 1,039,999 863,983 707,519 805,394 587,085 728,133 484,469 199,237 460,093 6,912,255 38.7% Brand Ford Chevrolet Toyota Honda Nissan Jeep Volkswagen Dodge GMC Hyundai Top 10 total assembly Top 10 (% of regional total) 2012 2,719,401 2,269,732 1,686,297 1,514,968 1,266,862 714,648 755,676 709,994 539,009 459,439 12,636,026 82.1% 2013 2,995,933 2,321,941 1,780,370 1,590,046 1,457,980 726,755 692,254 752,710 579,508 504,933 13,402,430 82.9% 2014 2,960,218 2,460,237 1,816,785 1,629,393 1,623,200 891,250 623,854 592,601 587,274 520,438 13,705,250 81.6% 2015 2,893,452 2,480,018 1,860,702 1,652,297 1,686,448 932,263 842,641 567,238 590,743 516,613 14,022,415 80.2% Brand nameplate Ford F-Series Chevrolet Silverado Ram Pickup Toyota Camry Honda Accord Honda Civic Toyota Corolla Ford Escape Nissan Altima Honda CR-V Top 10 total assembly Top 10 (% of regional total) 2012 834,666 505,383 421,589 452,963 400,143 395,887 365,337 331,301 334,710 355,864 4,397,843 28.6% 2013 911,755 541,875 445,699 458,683 452,927 436,668 333,685 377,724 388,225 393,999 4,741,240 29.3% 2014 995,721 559,482 502,190 446,077 411,626 401,553 386,216 360,271 360,048 352,140 4,775,324 28.4% 2015 893,225 554,133 481,511 474,106 392,213 391,886 372,556 355,503 349,121 334,172 4,598,426 26.3% Platform MC (Toyota Motor Corporation) K2XX C1/P1 T1 (Ford Motor Company) NF D (Renault-Nissan) CD4 GLOBAL DELTA PQ35/46 (A5) DS Top 10 total assembly Top 10 (% of regional total) Autofacts October 2013 For more information please visit us at www.autofacts.com
  • 11. Analyst Note Plus Baseline assembly forecast data – South America 1 2 3 4 5 6 7 8 9 10 1 2 3 4 5 6 7 8 9 10 1 2 3 4 5 6 7 8 9 10 1 2 3 4 5 6 7 8 9 10 11 Growth analytics Unit diff. % chg 267,606 28.3% 294,777 34.3% 148,191 18.8% 94,295 19.3% 162,044 44.0% 145,089 61.9% 170,987 205.4% 68,602 40.5% 157,301 160.1% 125,016 796.6% 1,633,908 40.3% 2,236,888 41.6% 602,980 45.5% (2012-2017) CAGR CTG % Rank 5.1% 14.0% 2 6.1% 15.4% 1 3.5% 7.7% 6 3.6% 4.9% 10 7.6% 8.5% 4 10.1% 7.6% 7 25.0% 8.9% 3 7.0% 3.6% 12 21.1% 8.2% 5 55.1% 6.5% 8 7.0% 85.3% 7.2% 81.5% 7.8% 100.0% Alliance group VW Group Fiat Group GM Group Renault-Nissan Ford Group PSA Group Hyundai Group Toyota Group Honda Group Chery Auto Top 10 total assembly Top 10 total capacity Excess capacity Utilisation (%) 2012 945,427 858,874 787,834 488,987 368,215 234,408 83,229 169,369 98,237 15,694 4,050,274 5,376,277 1,326,003 75.3% 2013 963,893 805,401 913,483 408,550 395,117 303,274 188,094 177,308 175,580 46,588 4,377,288 6,107,207 1,729,919 71.7% 2014 962,273 780,153 918,870 466,714 480,723 289,886 214,813 190,842 173,393 74,303 4,551,970 6,531,345 1,979,375 69.7% 2015 1,054,626 841,067 916,643 527,510 505,577 361,694 251,019 203,303 176,672 82,436 4,920,547 7,110,641 2,190,094 69.2% 2016 1,170,058 1,055,056 923,681 548,698 518,043 367,311 254,380 216,431 235,893 129,554 5,419,105 7,525,440 2,106,335 72.0% 2017 1,213,033 1,153,651 936,025 583,282 530,259 379,497 254,216 237,971 255,538 140,710 5,684,182 7,613,165 1,928,983 74.7% Platform PQ24 (AO4) FIAT/GM 199/4400 GLOBAL GAMMA B2E GM4200 B0 (Renault) PQ25 (AO5) HGSC PF1 X85/B Top 10 total assembly Top 10 (% of regional total) 2012 759,551 500,063 97,798 41,209 420,106 297,760 69,306 33,010 57,750 92,450 2,369,003 56.8% 2013 775,680 507,615 365,608 138,127 280,030 159,656 70,515 150,439 119,481 120,507 2,687,658 59.7% 2014 738,414 583,148 420,730 319,918 242,089 167,782 130,790 175,944 117,122 107,536 3,003,473 63.8% 2015 572,389 632,438 462,171 369,831 207,421 186,324 286,503 181,674 157,166 124,226 3,180,143 61.1% 2016 578,646 663,040 458,936 375,402 216,914 186,893 293,735 177,201 158,858 132,810 3,242,435 56.1% 2017 597,302 680,860 512,863 375,406 220,362 196,439 301,448 171,854 118,939 140,887 3,316,360 54.5% Unit diff. -162,249 180,797 415,065 334,197 -199,744 -101,321 232,142 138,844 61,189 48,437 947,357 49.4% % chg -21.4% 36.2% 424.4% 811.0% -47.5% -34.0% 335.0% 420.6% 106.0% 52.4% 40.0% CAGR -4.7% 6.4% 39.3% 55.6% -12.1% -8.0% 34.2% 39.1% 15.5% 8.8% 7.0% CTG % Rank -8.5% 93 9.4% 5 21.7% 1 17.4% 2 -10.4% 95 -5.3% 91 12.1% 4 7.2% 7 3.2% 13 2.5% 17 49.4% Brand Volkswagen Chevrolet Fiat Ford Renault Peugeot Toyota Hyundai Honda Citroen Top 10 total assembly Top 10 (% of regional total) 2012 945,427 787,834 843,561 368,215 422,171 148,033 169,369 71,554 98,237 86,375 3,940,776 94.5% 2013 963,893 913,483 784,090 395,117 378,824 180,201 177,308 176,726 175,580 123,073 4,268,295 94.8% 2014 962,273 918,870 744,820 480,723 375,148 172,264 190,842 202,976 173,393 117,622 4,338,931 92.1% 2015 1,019,863 916,643 801,762 505,577 414,107 228,343 203,303 239,274 176,672 133,351 4,638,895 89.2% 2016 1,114,418 923,681 928,025 518,043 433,502 233,048 216,431 242,347 235,893 134,263 4,979,651 86.2% 2017 1,154,030 936,025 1,020,378 530,259 460,280 238,975 237,971 242,080 255,538 140,522 5,216,058 85.7% Unit diff. 208,603 148,191 176,817 162,044 38,109 90,942 68,602 170,526 157,301 54,147 1,275,282 66.5% % chg 22.1% 18.8% 21.0% 44.0% 9.0% 61.4% 40.5% 238.3% 160.1% 62.7% 32.4% CAGR 4.1% 3.5% 3.9% 7.6% 1.7% 10.1% 7.0% 27.6% 21.1% 10.2% 5.8% CTG % Rank 10.9% 1 7.7% 6 9.2% 2 8.5% 4 2.0% 17 4.7% 8 3.6% 12 8.9% 3 8.2% 5 2.8% 15 66.5% Brand nameplate Volkswagen Gol Fiat Uno Fiat Palio Chevrolet Onix Volkswagen Fox Ford Fiesta Hyundai HB20 Fiat Siena Fiat Strada Ford Ka Top 10 total assembly Top 10 (% of regional total) 2012 402,001 262,653 193,324 13,333 197,932 109,950 33,010 100,821 130,087 91,025 1,534,136 36.8% 2013 405,152 192,933 203,717 205,547 206,494 155,676 150,439 106,450 110,785 40,416 1,777,609 39.5% 2014 430,619 179,145 203,923 231,363 200,567 183,147 142,981 97,875 103,238 104,330 1,877,188 39.9% 2015 423,545 223,120 203,485 255,071 192,382 139,474 144,428 108,965 93,814 131,787 1,916,071 36.8% 2016 431,840 281,365 196,509 253,599 194,710 136,056 138,457 111,200 94,572 122,371 1,960,679 33.9% 2017 443,059 289,874 210,272 245,604 204,752 143,346 134,946 119,880 103,383 119,428 2,014,544 33.1% Unit diff. % chg 41,058 10.2% 27,221 10.4% 16,948 8.8% 232,271 1742.1% 6,820 3.4% 33,396 30.4% 101,936 308.8% 19,059 18.9% -26,704 -20.5% 28,403 31.2% 480,408 31.3% 25.1% CAGR 2.0% 2.0% 1.7% 79.1% 0.7% 5.4% 32.5% 3.5% -4.5% 5.6% 5.6% CTG % Rank 2.1% 15 1.4% 36 0.9% 54 12.1% 1 0.4% 78 1.7% 26 5.3% 2 1.0% 53 -1.4% 164 1.5% 33 25.1% Autofacts October 2013 For more information please visit us at www.autofacts.com
  • 12. Analyst Note Plus Baseline forecast data – North and South America North America: fuel type and delivery by % share 2012 - 2017 North America: weighted engine displacement 2012 - 2017 (cubic centimeters) 70% 3,200 50% 80% 3,300 60% 100% 3,100 60% 40% 40% 30% 20% 20% 3,000 2,900 10% 0% 0% 2012 2013 Gasoline 2014 Diesel 2015 Hybrid 2016 PEV+PHEV 2,800 2,700 2012 2017 2013 2014 2015 2016 2017 DI Growth analytics (2012-2017) Transmission outlook 2012 2013 2014 2015 2016 2017 Unit diff. 12,182,823 12,402,325 12,432,275 12,657,407 12,640,350 12,438,793 255,970 2.1% 79.1% 67.6% 2 Continuously Variable 1,268,622 1,827,971 2,279,463 2,413,187 2,492,063 3,029,426 1,760,804 138.8% 8.2% 16.5% 3 Manual 1,264,125 1,149,347 1,156,915 1,072,466 1,018,436 998,991 -265,134 -21.0% 8.2% 5.4% 639,985 675,519 775,139 1,172,113 1,503,160 1,648,421 1,008,436 157.6% 4.2% 9.0% 40,428 98,723 134,362 164,525 189,104 243,714 203,286 502.8% 0.3% 1.3% 6 Automated Manual 0 5,239 11,753 12,508 28,004 46,914 46,914 0.0% 0.0% 0.3% Total consumption 15,395,983 16,159,124 16,789,907 17,492,206 17,871,117 18,406,259 3,010,276 19.6% 100.0% 100.0% 1 Automatic 4 Automated Manual Double Clutch 5 Electric South America: fuel type and delivery by % share 2012 - 2017 % chg 2012 share 2017 share South America: weighted engine displacement 2012 - 2017 (cubic centimeters) 100% 30% 80% 1,550 25% 20% 60% 1,500 15% 40% 10% 20% 1,450 5% 0% 0% 2012 2013 Gasoline 2014 Diesel 2015 Hybrid 2016 PEV+PHEV 1,400 2012 2017 2013 2014 2015 2016 2017 DI Growth analytics (2012-2017) Transmission outlook 1 Manual 2012 2013 2014 2015 2016 2017 Unit diff. 3,843,719 4,087,869 4,177,704 4,479,726 4,865,045 5,011,904 1,168,185 30.4% 92.1% 82.3% 301,427 339,758 372,368 415,732 438,781 446,635 145,208 48.2% 7.2% 7.3% 7,017 20,274 49,083 116,637 186,190 308,282 301,265 4293.4% 0.2% 5.1% 15,884 23,573 46,787 112,692 153,461 163,725 147,841 930.8% 0.4% 2.7% 3,511 33,008 64,662 77,493 135,433 157,495 153,984 4385.8% 0.1% 2.6% 4,171,558 4,504,482 4,710,604 5,202,280 5,778,910 6,088,041 1,916,483 45.9% 100.0% 100.0% 2 Automatic 3 Automated Manual Double Clutch 4 Automated Manual 5 Continuously Variable Total consumption 12 Autofacts October 2013 % chg 2012 share 2017 share For more information please visit us at www.autofacts.com
  • 13. Analyst Note Plus Baseline assembly forecast data – European Union 1 2 3 4 5 6 7 8 9 10 1 2 3 4 5 6 7 8 9 10 1 2 3 4 5 6 7 8 9 10 1 2 3 4 5 6 7 8 9 10 13 Alliance group VW Group PSA Group Renault-Nissan Daimler Group BMW Group Ford Group Fiat Group GM Group Hyundai Group Toyota Group Top 10 total assembly Top 10 total capacity Excess capacity Utilisation (%) 2012 4,425,041 1,976,462 1,908,864 1,347,801 1,358,509 1,064,178 872,044 941,952 533,105 364,796 14,792,752 19,950,013 5,157,261 74.1% 2013 4,414,119 1,971,636 1,810,585 1,452,506 1,407,606 1,055,358 751,624 869,306 539,708 436,446 14,708,894 19,515,468 4,806,574 75.4% 2014 4,612,643 2,089,303 1,830,357 1,521,981 1,366,649 1,069,224 795,147 869,257 549,798 474,414 15,178,773 20,023,210 4,844,437 75.8% 2015 4,934,571 2,118,632 1,998,831 1,543,514 1,464,323 1,112,521 1,162,571 934,070 516,781 474,312 16,260,126 20,270,634 4,010,508 80.2% 2016 4,968,437 2,196,052 2,172,446 1,527,397 1,583,237 1,100,364 1,369,197 1,173,376 508,048 448,098 17,046,652 20,571,064 3,524,412 82.9% 2017 4,990,353 2,277,239 2,164,847 1,620,438 1,665,638 1,066,591 1,397,491 1,271,016 537,342 443,467 17,434,422 20,448,139 3,013,717 85.3% Platform MQB PQ35/46 (A5) PF1 MLB C1/P1 L7 PF2 X85/B HD MFA Top 10 total assembly Top 10 (% of regional total) 2012 117,033 2,116,969 695,211 665,667 559,289 446,566 807,002 544,391 457,033 210,068 6,619,229 41.6% 2013 996,184 1,169,800 831,259 691,200 576,974 572,557 669,678 554,143 476,500 388,466 6,926,761 43.9% 2014 1,615,095 866,045 841,040 750,875 601,467 588,794 498,974 491,441 488,955 487,603 7,230,289 44.4% 2015 2,761,174 342,605 829,629 812,969 570,501 539,577 492,126 461,530 458,099 515,924 7,784,134 44.5% 2016 3,090,747 258,538 792,622 744,699 538,328 545,857 381,069 443,535 436,384 465,708 7,697,487 42.0% 2017 3,234,148 156,338 660,000 877,261 515,080 518,327 293,962 464,781 452,264 454,925 7,627,086 40.7% Brand Volkswagen Mercedes-Benz Audi Peugeot BMW Ford Renault Opel-Vauxhall Citroen Fiat Top 10 total assembly Top 10 (% of regional total) 2012 2,207,927 1,248,900 1,132,784 1,099,757 1,043,732 1,064,178 996,573 941,952 876,705 649,723 11,262,231 70.8% 2013 2,141,211 1,361,993 1,177,393 1,117,942 1,072,924 1,055,358 880,307 869,306 853,694 550,208 11,080,336 70.3% 2014 2,219,125 1,428,703 1,192,421 1,163,889 1,051,263 1,069,224 899,193 869,257 925,414 547,064 11,365,553 69.9% 2015 2,371,488 1,394,937 1,263,588 1,156,580 1,111,305 1,112,521 1,008,205 915,102 962,052 699,322 11,995,100 68.6% 2016 2,465,026 1,373,749 1,165,334 1,208,529 1,172,508 1,100,364 1,150,120 1,092,827 987,523 819,576 12,535,556 68.3% Brand nameplate Volkswagen Golf Ford Fiesta Opel-Vauxhall Corsa BMW 3 Series Peugeot 208 Volkswagen Polo Opel-Vauxhall Astra Nissan Qashqai Volkswagen Passat Ford Focus Top 10 total assembly Top 10 (% of regional total) 2012 475,804 350,332 294,441 339,920 241,672 287,289 299,757 310,837 236,687 289,079 3,125,818 19.6% 2013 495,763 338,969 278,923 360,568 294,887 262,756 223,797 288,364 227,254 259,671 3,030,952 19.2% 2014 598,546 308,310 269,955 289,174 293,541 257,263 205,529 239,825 212,678 240,757 2,915,578 17.9% 2015 589,599 336,401 247,174 249,354 288,910 252,525 235,963 247,669 274,282 230,918 2,952,795 16.9% 2016 582,680 389,522 304,500 229,653 290,525 284,291 320,568 241,147 294,393 216,465 3,153,744 17.2% Autofacts October 2013 Growth analytics (2012-2017) Unit diff. % chg CAGR CTG % Rank 565,312 12.8% 2.4% 19.9% 1 300,777 15.2% 2.9% 10.6% 5 255,983 13.4% 2.5% 9.0% 7 272,637 20.2% 3.8% 9.6% 6 307,129 22.6% 4.2% 10.8% 4 2,413 0.2% 0.0% 0.1% 17 525,447 60.3% 9.9% 18.5% 2 329,064 34.9% 6.2% 11.6% 3 4,237 0.8% 0.2% 0.1% 15 78,671 21.6% 4.0% 2.8% 9 2,641,670 17.9% 3.3% 93.0% 498,126 2.5% 0.5% 77.7% -2,143,544 -41.6% -10.2% 100.0% Unit diff. % chg 3,117,115 2663.4% -1,960,631 -92.6% -35,211 -5.1% 211,594 31.8% -44,209 -7.9% 71,761 16.1% -513,040 -63.6% -79,610 -14.6% -4,769 -1.0% 244,857 116.6% 1,007,857 15.2% 35.5% CAGR 94.2% -40.6% -1.0% 5.7% -1.6% 3.0% -18.3% -3.1% -0.2% 16.7% 2.9% CTG % Rank 109.7% 1 -69.0% 144 -1.2% 112 7.4% 13 -1.6% 114 2.5% 27 -18.1% 142 -2.8% 122 -0.2% 90 8.6% 12 35.5% 2017 2,459,732 1,476,192 1,177,880 1,201,616 1,240,010 1,066,591 1,118,515 1,193,104 1,075,623 817,235 12,826,498 68.4% Unit diff. 251,805 227,292 45,096 101,859 196,278 2,413 121,942 251,152 198,918 167,512 1,564,267 55.1% % chg 11.4% 18.2% 4.0% 9.3% 18.8% 0.2% 12.2% 26.7% 22.7% 25.8% 13.9% CAGR 2.2% 3.4% 0.8% 1.8% 3.5% 0.0% 2.3% 4.8% 4.2% 4.7% 2.6% CTG % Rank 8.9% 1 8.0% 3 1.6% 21 3.6% 13 6.9% 6 0.1% 33 4.3% 8 8.8% 2 7.0% 4 5.9% 7 55.1% 2017 573,301 387,980 330,745 254,170 277,085 291,763 336,555 236,910 291,869 209,523 3,189,901 17.0% Unit diff. 97,497 37,648 36,304 -85,750 35,413 4,474 36,798 -73,927 55,182 -79,556 64,083 2.3% % chg 20.5% 10.7% 12.3% -25.2% 14.7% 1.6% 12.3% -23.8% 23.3% -27.5% 2.1% CAGR 3.8% 2.1% 2.4% -5.6% 2.8% 0.3% 2.3% -5.3% 4.3% -6.2% 0.4% CTG % Rank 3.4% 7 1.3% 52 1.3% 56 -3.0% 361 1.2% 59 0.2% 148 1.3% 54 -2.6% 355 1.9% 30 -2.8% 358 2.3% For more information please visit us at www.autofacts.com
  • 14. Analyst Note Plus Baseline assembly forecast data – Eastern Europe 1 2 3 4 5 6 7 8 9 10 1 2 3 4 5 6 7 8 9 10 1 2 3 4 5 6 7 8 9 10 1 2 3 4 5 6 7 8 9 10 14 Alliance group Renault-Nissan GM Group Hyundai Group Ford Group Fiat Group VW Group Toyota Group PSA Group GAZ Group Daewoo Group Top 10 total assembly Top 10 total capacity Excess capacity Utilisation (%) 2012 1,104,458 541,182 437,840 385,063 216,270 211,468 112,547 100,824 58,414 39,264 3,207,330 4,938,384 1,731,054 64.9% 2013 1,134,338 509,931 489,657 389,458 278,000 221,903 143,505 116,479 54,406 24,766 3,362,443 5,159,947 1,797,504 65.2% 2014 1,162,982 501,773 546,713 422,438 251,005 268,061 189,867 131,388 58,500 46,395 3,579,122 5,502,609 1,923,487 65.0% 2015 1,258,147 510,946 567,797 531,977 257,606 277,178 186,980 151,817 61,174 51,792 3,855,414 5,693,789 1,838,375 67.7% 2016 1,428,836 537,799 557,479 545,343 327,684 288,456 240,585 99,223 61,227 53,133 4,139,765 6,313,002 2,173,237 65.6% 2017 1,553,733 566,087 558,843 567,724 396,808 307,140 248,140 104,371 63,216 56,385 4,422,447 6,499,489 2,077,042 68.0% Platform B0 (Renault) HGSC X85/B 2190 V184/5 GLOBAL GAMMA FIAT/GM 199/4400 X84/C B-EVO 2121 Top 10 total assembly Top 10 (% of regional total) 2012 177,124 224,598 158,312 145,307 168,232 105,714 243,265 117,952 29,666 128,402 1,498,572 43.1% 2013 338,643 225,032 245,247 229,072 205,361 170,466 215,699 100,464 112,298 111,710 1,953,992 53.0% 2014 335,455 296,659 268,202 280,186 250,261 212,403 188,825 99,544 122,611 97,153 2,151,299 54.2% 2015 379,858 294,237 275,015 290,603 267,736 228,445 191,660 114,592 135,739 96,582 2,274,467 52.9% 2016 466,543 281,031 287,997 276,384 279,412 230,015 127,164 190,684 180,122 97,295 2,416,647 52.5% 2017 523,793 281,718 293,312 257,772 292,949 240,603 129,276 266,024 223,803 117,528 2,626,778 53.6% Brand Lada Renault Ford Chevrolet Hyundai Fiat Kia Toyota Volkswagen Skoda Top 10 total assembly Top 10 (% of regional total) 2012 600,713 458,589 385,063 337,417 236,563 215,717 201,277 112,547 113,297 98,171 2,759,354 79.4% 2013 495,850 575,842 389,458 323,655 263,699 277,444 225,958 143,505 128,283 86,053 2,909,747 79.0% 2014 457,973 569,276 422,438 351,844 312,342 250,439 234,371 189,867 136,452 120,438 3,045,440 76.7% 2015 521,121 559,652 531,977 358,294 336,304 239,101 231,493 186,980 140,088 119,507 3,224,517 75.0% 2016 642,358 605,991 545,343 382,543 340,218 295,696 217,261 226,466 143,421 127,341 3,526,638 76.7% 2017 735,319 623,976 567,724 406,683 345,234 331,928 213,609 233,236 150,980 137,205 3,745,894 76.4% Brand nameplate Renault Clio Ford Transit Lada Granta Hyundai Solaris Lada Kalina Fiat 500L Kia Rio Hyundai Getz/i20 Chevrolet Spark Renault Symbol / Thalia Top 10 total assembly Top 10 (% of regional total) 2012 158,312 150,974 149,548 124,325 119,522 29,666 100,273 82,713 88,466 42,053 1,045,852 30.1% 2013 230,465 163,178 185,047 125,856 72,058 112,298 97,616 86,911 69,391 74,918 1,217,738 33.1% 2014 232,812 172,976 173,536 115,771 99,169 122,611 92,124 82,622 77,308 82,791 1,251,720 31.5% 2015 221,811 180,924 177,412 110,423 109,271 111,723 89,732 87,417 74,215 82,363 1,245,291 29.0% 2016 227,063 189,911 170,156 101,476 102,716 95,255 82,748 89,366 80,546 91,251 1,230,488 26.7% 2017 226,556 201,355 155,600 98,890 98,519 89,101 80,382 89,445 95,422 100,510 1,235,780 25.2% Autofacts October 2013 Growth analytics Unit diff. % chg 449,275 40.7% 24,905 4.6% 121,003 27.6% 182,661 47.4% 180,538 83.5% 95,672 45.2% 135,593 120.5% 3,547 3.5% 4,802 8.2% 17,121 43.6% 1,215,117 37.9% 1,561,105 31.6% 345,988 20.0% (2012-2017) CAGR CTG % Rank 7.1% 31.5% 1 0.9% 1.7% 10 5.0% 8.5% 5 8.1% 12.8% 2 12.9% 12.7% 3 7.8% 6.7% 6 17.1% 9.5% 4 0.7% 0.2% 19 1.6% 0.3% 18 7.5% 1.2% 13 6.6% 85.3% 5.7% 82.7% 3.7% 100.0% Unit diff. 346,669 57,120 135,000 112,465 124,717 134,889 -113,989 148,072 194,137 -10,874 1,128,206 79.2% CAGR 24.2% 4.6% 13.1% 12.1% 11.7% 17.9% -11.9% 17.7% 49.8% -1.8% 11.9% CTG % Rank 24.3% 1 4.0% 11 9.5% 6 7.9% 9 8.8% 8 9.5% 7 -8.0% 117 10.4% 5 13.6% 3 -0.8% 101 79.2% Unit diff. % chg 134,606 22.4% 165,387 36.1% 182,661 47.4% 69,266 20.5% 108,671 45.9% 116,211 53.9% 12,332 6.1% 120,689 107.2% 37,683 33.3% 39,034 39.8% 986,540 35.8% 69.3% CAGR 4.1% 6.4% 8.1% 3.8% 7.9% 9.0% 1.2% 15.7% 5.9% 6.9% 6.3% CTG % Rank 9.5% 3 11.6% 2 12.8% 1 4.9% 8 7.6% 6 8.2% 5 0.9% 25 8.5% 4 2.6% 13 2.7% 12 69.3% Unit diff. 68,244 50,381 6,052 -25,435 -21,003 59,435 -19,891 6,732 6,956 58,457 189,928 13.3% CAGR 7.4% 5.9% 0.8% -4.5% -3.8% 24.6% -4.3% 1.6% 1.5% 19.0% 3.4% CTG % Rank 4.8% 7 3.5% 15 0.4% 73 -1.8% 221 -1.5% 219 4.2% 9 -1.4% 218 0.5% 68 0.5% 67 4.1% 10 13.3% % chg 195.7% 25.4% 85.3% 77.4% 74.1% 127.6% -46.9% 125.5% 654.4% -8.5% 75.3% % chg 43.1% 33.4% 4.0% -20.5% -17.6% 200.3% -19.8% 8.1% 7.9% 139.0% 18.2% For more information please visit us at www.autofacts.com
  • 15. Analyst Note Plus Baseline forecast data – Europe European Union: fuel type and delivery by % share 2012 - 2017 European Union: weighted engine displacement 2012 - 2017 (cubic centimeters) 100% 100% 2,000 80% 80% 1,900 60% 60% 1,800 40% 40% 1,700 20% 20% 1,600 0% 1,500 2012 0% 2012 2013 Gasoline 2014 Diesel 2015 Hybrid 2016 2017 PEV+PHEV 2013 2014 2015 2016 2017 DI Growth analytics (2012-2017) Transmission outlook 2012 2013 2014 2015 2016 2017 Unit diff. 11,243,812 10,861,151 10,949,986 11,558,954 11,961,774 12,061,484 817,672 7.3% 70.6% 64.3% 2 Automatic 2,622,359 2,645,764 2,648,834 2,736,647 2,872,596 3,104,661 482,302 18.4% 16.5% 16.6% 3 Automated Manual Double Clutch 1,210,439 1,405,882 1,584,613 2,065,087 2,375,604 2,472,600 1,262,161 104.3% 7.6% 13.2% 544,792 495,096 521,788 518,242 453,713 410,632 -134,160 -24.6% 3.4% 2.2% 17,139 54,745 291,665 366,826 434,095 478,084 460,945 2689.5% 0.1% 2.5% 276,612 307,970 270,506 248,976 244,594 228,831 -47,781 -17.3% 1.7% 1.2% 15,915,153 15,770,608 16,267,392 17,494,732 18,342,376 18,756,292 2,841,139 17.9% 100.0% 100.0% 1 Manual 4 Automated Manual 5 Electric 6 Continuously Variable Total consumption Eastern Europe: fuel type and delivery by % share 2012 - 2017 % chg 2012 share 2017 share Eastern Europe: weighted engine displacement 2012 - 2017 (cubic centimeters) 100% 50% 1,700 80% 45% 1,650 60% 40% 40% 35% 20% 30% 1,600 0% 25% 2012 2013 Gasoline 2014 Diesel 2015 Hybrid 2016 PEV+PHEV 2017 1,550 1,500 2012 2013 2014 2015 2016 2017 DI Growth analytics (2012-2017) Transmission outlook 2012 2013 2014 2015 2016 2017 Unit diff. 2,986,502 3,019,640 3,194,089 3,451,649 3,674,736 3,941,873 955,371 32.0% 85.9% 80.4% 351,688 488,544 549,825 531,671 538,254 555,191 203,503 57.9% 10.1% 11.3% 3 Automated Manual Double Clutch 51,906 76,126 114,989 200,852 252,342 263,863 211,957 408.3% 1.5% 5.4% 4 Automated Manual 37,604 37,403 45,103 47,923 56,729 57,304 19,700 52.4% 1.1% 1.2% 5 Continuously Variable 29,626 35,657 43,369 45,016 52,714 52,601 22,975 77.6% 0.9% 1.1% 6 Electric 19,778 26,566 21,204 21,523 25,933 30,430 10,652 53.9% 0.6% 0.6% 3,477,104 3,683,936 3,968,579 4,298,634 4,600,708 4,901,262 1,424,158 41.0% 100.0% 100.0% 1 Manual 2 Automatic Total consumption 15 Autofacts October 2013 % chg 2012 share 2017 share For more information please visit us at www.autofacts.com
  • 16. Analyst Note Plus Baseline assembly forecast data – Developed Asia Pacific Growth analytics Unit diff. % chg -824,725 -16.8% 59,324 1.8% -106,334 -7.5% -26,635 -2.6% 130,434 14.6% 12,271 1.4% -155,821 -17.8% 12,639 2.8% 21,963 18.4% -12,712 -27.8% -889,596 -6.4% -1,574,186 -9.7% -684,590 -29.1% (2012-2017) CAGR CTG % Rank -3.6% -90.4% 13 0.4% 6.5% 2 -1.6% -11.7% 11 -0.5% -2.9% 9 2.8% 14.3% 1 0.3% 1.3% 5 -3.9% -17.1% 12 0.6% 1.4% 4 3.4% 2.4% 3 -6.3% -1.4% 8 -1.3% -97.5% -2.0% -93.7% -6.6% 100.0% 2017 1,273,262 494,863 Unit diff. 109,028 -1,001,744 % chg 9.4% -66.9% CAGR CTG % Rank 1.8% 11.9% 10 -19.9% -109.8% 108 793,534 928,100 689,343 498,428 446,384 490,570 419,620 493,627 6,708,230 51.4% 774,374 948,403 702,048 490,429 106,987 471,939 422,384 473,533 6,158,222 47.2% -60,437 703,848 140,775 -62,383 -722,812 -145,016 -162,648 81,929 -1,119,460 122.7% -7.2% 287.8% 25.1% -11.3% -87.1% -23.5% -27.8% 20.9% -15.4% -1.5% 31.1% 4.6% -2.4% -33.6% -5.2% -6.3% 3.9% -3.3% 2015 2,447,201 1,725,753 1,582,252 1,052,418 1,018,145 926,121 726,638 540,856 609,153 586,303 11,214,840 85.0% 2016 2,475,131 1,768,950 1,572,219 983,088 983,485 919,642 727,954 549,931 575,238 506,355 11,061,993 84.7% 2017 2,438,408 1,786,606 1,592,894 994,903 1,021,149 912,055 717,661 530,819 606,830 474,996 11,076,321 84.8% Unit diff. -742,029 -48,069 107,393 -2,967 130,434 -246,493 -155,821 -166,131 59,559 -88,429 -1,152,553 126.3% % chg -23.3% -2.6% 7.2% -0.3% 14.6% -21.3% -17.8% -23.8% 10.9% -15.7% -9.4% CAGR CTG % Rank -5.2% -81.3% 28 -0.5% -5.3% 22 1.4% 11.8% 3 -0.1% -0.3% 16 2.8% 14.3% 2 -4.7% -27.0% 27 -3.9% -17.1% 25 -5.3% -18.2% 26 2.1% 6.5% 5 -3.4% -9.7% 23 -2.0% -126.3% 2015 524,346 306,004 250,801 227,170 207,007 218,562 224,745 204,742 201,121 201,584 2,566,082 19.4% 2016 518,237 277,463 246,180 216,704 239,856 223,930 196,305 192,550 199,679 212,232 2,523,136 19.3% 2017 522,513 272,397 280,073 244,223 232,702 220,913 197,178 219,908 193,394 225,643 2,608,944 20.0% Unit diff. 41,043 -32,710 -54,177 39,297 -15,365 -28,040 -16,433 -1,937 -35,964 5,702 -98,584 10.8% % chg 8.5% -10.7% -16.2% 19.2% -6.2% -11.3% -7.7% -0.9% -15.7% 2.6% -3.6% CAGR 1.6% -2.2% -3.5% 3.6% -1.3% -2.4% -1.6% -0.2% -3.4% 0.5% -0.7% 2012 4,916,519 3,320,176 1,411,760 1,029,855 890,715 880,962 873,482 451,889 119,142 45,751 13,940,251 16,295,678 2,355,427 85.5% 2013 4,631,813 3,337,863 1,161,124 955,046 989,525 903,113 780,157 386,998 134,831 32,216 13,312,686 15,099,251 1,786,565 88.2% 2014 4,318,317 3,335,442 1,280,458 1,060,095 1,022,019 910,477 746,628 442,963 130,012 36,637 13,283,048 14,823,998 1,540,950 89.6% 2015 4,146,151 3,308,005 1,365,067 1,061,185 1,018,145 871,749 726,638 501,111 134,938 34,591 13,167,580 14,872,180 1,704,600 88.5% 2016 4,144,758 3,341,169 1,335,713 991,524 983,485 851,699 727,954 482,368 138,530 32,808 13,030,008 14,800,757 1,770,749 88.0% 2017 4,091,794 3,379,500 1,305,426 1,003,220 1,021,149 893,233 717,661 464,528 141,105 33,039 13,050,655 14,721,492 1,670,837 88.7% Platform 1 HD 2 MC (Toyota Motor Corporation) 3 NF 4 SKYACTIV 5 HGSC 6 SI 7 NBC 8 L4 (Daihatsu Motor Company) 9 YP/YN 10 GLOBAL GAMMA Top 10 total assembly Top 10 (% of regional total) 2012 1,164,234 1,496,607 2013 1,207,567 1,471,313 2014 1,262,622 1,311,279 2015 1,226,276 881,306 2016 1,231,001 717,623 834,811 244,555 561,273 552,812 829,799 616,955 585,032 391,604 7,277,682 52.1% 834,297 577,159 577,308 591,494 699,054 546,279 551,389 463,653 7,519,513 56.4% 748,854 856,488 694,793 591,104 603,153 528,352 493,009 445,253 7,534,907 56.6% 797,042 881,817 674,006 585,594 585,738 480,469 462,577 452,742 7,027,567 53.2% Brand Toyota Hyundai Kia Honda Mazda Nissan Suzuki Daihatsu Chevrolet Subaru Top 10 total assembly Top 10 (% of regional total) 2012 3,180,437 1,834,675 1,485,501 997,870 890,715 1,158,548 873,482 696,950 547,271 563,425 12,228,874 87.5% 2013 2,877,642 1,802,346 1,535,517 929,901 989,525 891,462 780,157 620,754 542,595 588,897 11,558,796 86.7% 2014 2,572,483 1,751,471 1,583,971 1,051,351 1,022,019 937,484 746,628 588,342 592,172 587,268 11,433,189 85.9% Brand nameplate Toyota Prius Mazda Axela Toyota Prius C/Aqua Mazda CX-5 Hyundai Accent Hyundai Elantra/i30 Kia Forte Kia Rio Toyota Land Cruiser Hyundai Tucson/iX35 Top 10 total assembly Top 10 (% of regional total) 2012 481,470 305,107 334,250 204,926 248,067 248,953 213,611 221,845 229,358 219,941 2,707,528 19.4% 2013 550,956 274,550 304,416 281,242 237,039 240,661 209,219 226,084 229,203 200,330 2,753,700 20.7% 2014 516,184 324,041 258,395 235,925 237,487 228,937 245,165 197,012 205,623 187,479 2,636,248 19.8% 1 2 3 4 5 6 7 8 9 10 1 2 3 4 5 6 7 8 9 10 1 2 3 4 5 6 7 8 9 10 16 Alliance group Toyota Group Hyundai Group Renault-Nissan Honda Group Mazda GM Group Suzuki Group Mitsubishi Group Mahindra PSA Group Top 10 total assembly Top 10 total capacity Excess capacity Utilisation (%) Autofacts October 2013 -6.6% 77.1% 15.4% -6.8% -79.2% -15.9% -17.8% 9.0% -122.7% 91 2 7 92 107 101 103 13 CTG % Rank 4.5% 16 -3.6% 318 -5.9% 334 4.3% 18 -1.7% 280 -3.1% 306 -1.8% 284 -0.2% 196 -3.9% 321 0.6% 97 -10.8% For more information please visit us at www.autofacts.com
  • 17. Analyst Note Plus Baseline assembly forecast data – Developing Asia Pacific 1 2 3 4 5 6 7 8 9 10 1 2 3 4 5 6 7 8 9 10 1 2 3 4 5 6 7 8 9 10 1 2 3 4 5 6 7 8 9 10 17 Alliance group GM Group VW Group Toyota Group Hyundai Group Renault-Nissan Honda Group Suzuki Group Ford Group Chang'an Group Geely Group Top 10 total assembly Top 10 total capacity Excess capacity Utilisation (%) Growth analytics Unit diff. % chg 1,727,930 58.6% 1,569,227 57.4% 1,005,706 34.5% 862,838 41.6% 1,239,584 83.6% 1,156,890 109.2% 364,083 25.4% 1,285,198 171.1% 238,813 23.1% 444,894 87.7% 9,895,163 58.4% 10,506,578 50.5% 611,415 15.9% (2012-2017) CAGR CTG % Rank 9.7% 12.4% 1 9.5% 11.2% 2 6.1% 7.2% 6 7.2% 6.2% 7 12.9% 8.9% 4 15.9% 8.3% 5 4.6% 2.6% 12 22.1% 9.2% 3 4.2% 1.7% 14 13.4% 3.2% 10 9.6% 70.9% 8.5% 67.6% 3.0% 100.0% 2012 2,951,057 2,734,317 2,916,433 2,075,413 1,482,861 1,059,895 1,434,328 751,172 1,035,144 507,317 16,947,937 20,792,273 3,844,336 81.5% 2013 3,212,770 3,161,801 3,109,152 2,184,869 1,701,556 1,372,114 1,386,887 1,047,681 1,064,493 569,450 18,810,773 23,220,907 4,410,134 81.0% 2014 3,420,757 3,331,516 3,418,264 2,386,820 2,063,950 1,771,440 1,430,699 1,144,019 1,163,735 715,368 20,846,568 25,568,628 4,722,060 81.5% 2015 3,852,279 3,451,666 3,652,522 2,493,351 2,377,642 2,048,386 1,526,155 1,495,170 1,237,841 849,288 22,984,300 29,308,039 6,323,739 78.4% 2016 4,461,719 3,992,241 3,777,727 2,714,805 2,522,462 2,139,545 1,562,019 1,866,287 1,284,361 888,595 25,209,761 31,128,890 5,919,129 81.0% 2017 4,678,987 4,303,544 3,922,139 2,938,251 2,722,445 2,216,785 1,798,411 2,036,370 1,273,957 952,211 26,843,100 31,298,851 4,455,751 85.8% Platform MINICAB CARRY PQ34 (A4) PQ35/46 (A5) IMV HD C1/P1 MQB GLOBAL DELTA NBC Top 10 total assembly Top 10 (% of regional total) 2012 1,400,893 1,384,065 785,158 1,143,374 917,202 640,886 476,402 0 499,169 525,972 7,773,121 31.7% 2013 1,438,834 1,224,514 942,763 1,285,696 910,107 861,368 745,755 37,425 530,882 562,621 8,539,965 31.8% 2014 1,484,876 1,321,290 961,497 1,113,161 926,404 859,264 682,022 362,291 589,991 642,501 8,943,297 29.8% 2015 1,502,337 1,311,465 1,002,681 841,500 933,705 915,882 865,048 839,795 681,253 668,193 9,561,859 28.8% 2016 1,494,700 1,271,375 1,008,649 589,719 936,507 1,023,119 796,712 1,387,138 793,086 696,487 9,997,492 27.6% 2017 1,568,384 1,224,849 1,031,696 605,710 953,861 1,108,332 899,083 1,517,682 908,285 757,457 10,575,339 27.5% Unit diff. 167,491 -159,216 246,538 -537,664 36,659 467,446 422,681 1,517,682 409,116 231,485 2,802,218 20.1% % chg 12.0% -11.5% 31.4% -47.0% 4.0% 72.9% 88.7% 0.0% 82.0% 44.0% 36.1% CAGR 2.3% -2.4% 5.6% -11.9% 0.8% 11.6% 13.5% 0.0% 12.7% 7.6% 6.4% CTG % Rank 1.2% 32 -1.1% 233 1.8% 19 -3.9% 236 0.3% 82 3.3% 6 3.0% 8 10.9% 1 2.9% 9 1.7% 24 20.1% Brand Toyota Volkswagen Hyundai Nissan Honda Wuling Ford Chevrolet Chang'an Buick Top 10 total assembly Top 10 (% of regional total) 2012 2,562,472 2,130,483 1,551,317 1,403,325 1,021,962 1,383,305 751,172 883,920 825,494 677,286 13,190,736 53.8% 2013 2,722,341 2,442,362 1,637,016 1,518,141 1,325,576 1,403,522 1,047,681 982,246 898,176 809,806 14,786,867 55.0% 2014 2,972,492 2,488,422 1,845,546 1,678,554 1,721,598 1,450,579 1,144,019 1,120,684 997,637 828,520 16,248,051 54.2% 2015 3,127,795 2,540,502 1,860,603 1,764,657 1,927,479 1,462,938 1,462,529 1,367,166 1,047,494 918,846 17,480,009 52.7% 2016 3,231,536 2,760,772 1,947,097 1,769,781 1,947,428 1,449,767 1,783,740 1,659,899 1,084,005 1,193,476 18,827,501 51.9% 2017 3,368,571 2,891,738 2,127,526 1,859,168 2,017,179 1,520,944 1,943,870 1,761,558 1,052,887 1,231,582 19,775,023 51.4% Unit diff. 806,099 761,255 576,209 455,843 995,217 137,639 1,192,698 877,638 227,393 554,296 6,584,287 47.2% % chg 31.5% 35.7% 37.1% 32.5% 97.4% 10.0% 158.8% 99.3% 27.5% 81.8% 49.9% CAGR 5.6% 6.3% 6.5% 5.8% 14.6% 1.9% 20.9% 14.8% 5.0% 12.7% 8.4% CTG % Rank 5.8% 4 5.5% 5 4.1% 6 3.3% 8 7.1% 2 1.0% 28 8.5% 1 6.3% 3 1.6% 19 4.0% 7 47.2% Brand nameplate Toyota Corolla Toyota Hilux Vigo Wuling Sunshine Chang'an SC63/10 Series Dongfeng Xiaokang Hyundai Elantra/i30 Volkswagen Lavida Wuling Hong Guang Wuling Rong Guang Ford Focus Top 10 total assembly Top 10 (% of regional total) 2012 543,516 539,392 523,274 500,466 447,028 374,583 250,304 339,509 378,268 325,736 4,222,076 17.2% 2013 548,634 531,887 489,196 445,529 455,277 409,469 415,942 394,966 346,259 441,089 4,478,248 16.7% 2014 563,152 535,442 510,193 514,137 446,067 415,536 425,264 402,719 371,260 338,381 4,522,151 15.1% 2015 561,366 537,248 531,231 498,217 413,505 413,183 446,253 390,845 377,676 273,467 4,442,991 13.4% 2016 565,146 535,914 540,363 512,854 352,411 398,641 435,658 390,188 363,288 292,624 4,387,087 12.1% 2017 586,778 548,191 569,756 450,694 357,363 446,840 434,601 412,621 378,040 367,529 4,552,413 11.8% Unit diff. 43,262 8,799 46,482 -49,772 -89,665 72,257 184,297 73,112 -228 41,793 330,337 2.4% % chg 8.0% 1.6% 8.9% -9.9% -20.1% 19.3% 73.6% 21.5% -0.1% 12.8% 7.8% CAGR 1.5% 0.3% 1.7% -2.1% -4.4% 3.6% 11.7% 4.0% 0.0% 2.4% 1.5% CTG % Rank 0.3% 109 0.1% 372 0.3% 98 -0.4% 681 -0.6% 686 0.5% 50 1.3% 4 0.5% 48 0.0% 586 0.3% 115 2.4% Autofacts October 2013 For more information please visit us at www.autofacts.com
  • 18. Analyst Note Plus Baseline forecast data – Asia Pacific Developed AP: fuel type and delivery by % share 2012 - 2017 Developed AP: weighted engine displacement 2012 - 2017 (cubic centimeters) 100% 50% 1,900 80% 40% 1,800 60% 30% 40% 20% 20% 10% 1,600 0% 1,500 2012 1,700 0% 2012 2013 Gasoline Diesel 2014 2015 Hybrid 2016 2017 PEV+PHEV 2013 2014 2015 2016 2017 DI Growth analytics (2012-2017) Transmission outlook 2012 2013 2014 2015 2016 2017 Unit diff. % chg 2012 share 1 Continuously Variable 5,096,728 5,084,377 5,090,955 4,965,870 4,925,709 4,943,473 -153,255 -3.0% 36.5% 37.9% 2 Automatic 5,205,446 4,796,831 4,711,264 4,597,845 4,541,933 4,547,537 -657,909 -12.6% 37.3% 34.8% 3 Manual 3,518,321 3,284,051 3,094,142 3,042,457 2,870,971 2,802,207 -716,114 -20.4% 25.2% 21.5% 4 Automated Manual Double Clutch 93,559 95,627 272,089 351,355 393,994 400,698 307,139 328.3% 0.7% 3.1% 5 Electric 48,782 57,796 106,184 204,988 279,077 322,271 273,489 560.6% 0.3% 2.5% 6 Automatic Hybrid 7,583 13,949 27,321 35,946 36,549 39,749 32,166 424.2% 0.1% 0.3% 7 Automated Manual 2,721 2,258 1,865 1,320 4,950 4,753 2,032 74.7% 0.0% 0.0% Total consumption 13,973,140 13,334,889 13,303,820 13,199,781 13,053,183 13,060,688 -912,452 -6.5% 100.0% 100.0% Developing AP: fuel type and delivery by % share 2012 - 2017 100% Developing AP: weighted engine displacement 2012 - 2017 (cubic centimeters) 40% 80% 2017 share 1,800 30% 1,700 60% 20% 40% 10% 20% 0% 0% 2012 2013 Gasoline 2014 Diesel 2015 Hybrid 2016 PEV+PHEV 2017 1,600 1,500 2012 2013 2014 2015 2016 2017 DI Growth analytics (2012-2017) Transmission outlook 2012 2013 2014 2015 2016 2017 Unit diff. 14,637,574 15,294,638 16,738,742 17,897,994 19,220,596 20,365,912 5,728,338 39.1% 59.7% 52.9% 2 Automatic 7,693,012 8,291,453 8,981,659 9,761,604 10,428,830 10,844,193 3,151,181 41.0% 31.4% 28.2% 3 Continuously Variable 1,305,132 1,732,249 2,390,758 2,836,335 3,000,243 3,334,586 2,029,454 155.5% 5.3% 8.7% 4 Automated Manual Double Clutch 704,433 1,318,756 1,627,307 2,325,925 3,213,559 3,511,782 2,807,349 398.5% 2.9% 9.1% 5 Automated Manual 144,123 184,799 188,516 222,730 244,875 276,991 132,868 92.2% 0.6% 0.7% 33,598 47,967 58,865 112,531 138,118 142,009 108,411 322.7% 0.1% 0.4% 24,517,872 26,869,862 29,985,847 33,157,119 36,246,221 38,475,473 13,957,601 56.9% 100.0% 100.0% 1 Manual 6 Electric Total consumption 18 Autofacts October 2013 % chg 2012 share 2017 share For more information please visit us at www.autofacts.com