Infography "Security: from pain to empowerment"
•
0 j'aime•1,247 vues

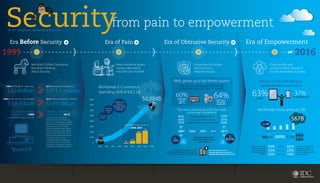
Infographie IDC pour Blue Coat, sur l’évolution de la sécurité informatique. L’infographie part de la période où la sécurité informatique n’était pas une priorité, puis lorsqu’elle est devenue une contrainte pour les utilisateurs, jusqu’à nos jours où la sécurité informatique est devenu un facteur de productivité et de nouvelles possibilités pour les employés.
Recommandé

Recommandé
Contenu connexe
Tendances
Tendances (20)
Similaire à Infography "Security: from pain to empowerment"
Similaire à Infography "Security: from pain to empowerment" (20)
Plus de Cedric Buisson
Plus de Cedric Buisson (20)
Infography "Security: from pain to empowerment"
- 1. from pain to empowerment An IDC Infographic, sponsored by Blue Coat Era Before Security Era of Pain Era of Obtrusive Security Era of Empowerment 2016 1999 Not Much Online Commerce, Not Much thinking About Security Web commerce grows; hackers take notice, mischief turns to theft Cloud, mobile and consumerization disrupt IT. Security empowers business. Enterprises lock-down infrastructures. Breaches mount. Web grows as a top threat source 1999 Worldwide PC shipments $20 million 1999 Worldwide Security Software $3.8 Billion Security submarkets tracked by IDC 1999 Antiviral, Firewall, Encryption, Security AAA $371.1 million 2012 Worldwide Security Software $19.3 Billion Security submarkets tracked by IDC 2013 Identity and access management; Advanced authentication; Web single sign-on; Enterprise single sign-on; Legacy authorization; User provisioning; Personal portable security devices; Software licensing authentication token; Unified threat management; Intrusion detection and prevention; Virtual private network; Security and vulnerability management; Security information and event management; Proactive endpoint risk management; Forensics and incident investigation; Security device and systems management; Vulnerability assessment... Top security challenges facing large enterprises over the next 12 months Worldwide E-Commerce Spending (B2B & B2C) $B 2012 Worldwide PC shipments $6,884B 8000 7000 Code Red costs top $2B 6000 5000 Slammer Worm infects an estimated 150,000 to 200,000 servers worldwide EMPLOYEE USE OF WEB 2.0 DIFFICULTY SECURING WEB APPS 45% 45% 41% 4000 DataLossDB.org incidents 2004-2007 644 2000 774 2007 Complexity of security solutions Increasing sophistication of attacks Increasing volume of threats and/or attacks 2008 2009 2010 53% 61% 63% 43 0 2000 2001 2002 2003 2004 Yes 157 2005 55% 2006 2007 No 45% Does your organization have a formal documented security policy? $67B $29B 2012 Yes No 35% 659 65% 2008 Which if any of the following is your company currently using/likely to purchase or implement during the next 12 months? 37% IT-CONTROLLED BYOD 2011 $357.4B 1000 63% Worldwide cloud revenue ($B) Top rated enterprise security challenges (a five year comparison) I LOVE YOU Emerges 3000 64% 60% How would you describe your mobile device environment? Data loss prevention: 62% Network Admission Control: 57% Employee Monitoring Solutions: 57% Any potential security risks cloud computing or SaaS introduce are far outweighed by the benefits. 2013 2014 2015 SMARTPHONE SHIPMENTS (M) 45% 33% 22% AGREE DISAGREE NEUTRAL 2016 1,161 63% 23% 14% Employees using personal smartphones at work understand the risks, and are aware of security proper security practices.