Scorecards and dashboards
•
1 j'aime•766 vues

Thanks to HR Linked In discussion group for sharing this information.

Recommandé
Recommandé
Contenu connexe
Tendances
Tendances (18)
En vedette
Similaire à Scorecards and dashboards
Similaire à Scorecards and dashboards (20)
Plus de Simon Penny
Plus de Simon Penny (20)
Scorecards and dashboards
- 1. Scorecards and Dashboards Translating HR Strategies Into Meaningful Metrics and Staying Focused By Charles H. Hannabarger and Frederick S. Buchman
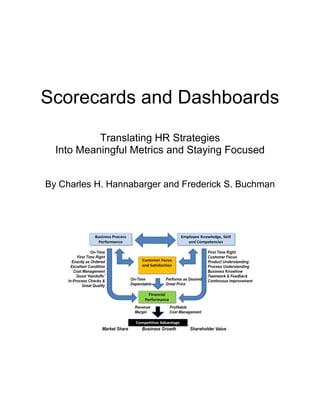
- 2. Human Resources Scorecards and Dashboards Translating Human Resources Strategies into Meaningful Metrics and Staying Focused Today, achieving competitive advantage for your business is more complex than ever. Knowing that you are headed in the right direction for the long-term is tough. It’s hard enough just knowing where you are sometimes, let alone where you are going and why. Not Just for Labor Relations Anymore There was a time when the Human Resources organization was a small, tightly focused group within a company, mostly focused on labor relations. Today, Human Resources is involved in almost every aspect of the business, with direct impact to the bottom line. The end result? Human Resources is now involved at very strategic levels within a company. The problem is, many Human Resource Departments are scrambling to keep up: hiring the right people, effectively providing the right training, pursuing competitive employee pay and benefits, managing shared services and outsourcing, just to name a few. Finding Help in the Balanced Scorecard Though it has been around for some time, there are some advances being made in the Balanced Scorecard. Once viewed as only a process, it is now being viewed as a system for management. A critical element of that system is Human Resources. Recognizing this, successful HR departments are helping to manage their organizations using the Balanced Scorecard, by planning their performance measurements across the 4 distinct ‘legs’ of the balanced scorecard, to maximize their overall financial performance while building a solid foundation for the future. The 4 ‘legs’ are: 1. Customer focus, 2. Financial performance, 3. Internal process performance, and 4. Employee learning and growth. The relationships between the 4 ‘Legs’ are depicted directionally in the figure below. The organization must develop employee competence and skills within solid business process performance, to enable customer focus and satisfaction, resulting in desired financial performance and achieving competitive advantage and business growth. HR plays a vital part in developing competent, knowledgeable human resources to the ever changing process and performance demands of the business.
- 3. The process to develop and implement a balanced scorecard is really quite simple, yet somewhat involved, consisting of four steps, as depicted in the diagram below: 1. Create a Strategic Map; 2. Set up a balanced scorecard, 3. Design and implement dashboards to monitor and adjust in real time, and 4. Continuously review, assess, and improve the system through feedback and feed forward loops back to the scorecard and strategy map.
- 4. It Starts With the Strategy Map Every company has 2-3 major strategic goals or objectives for the year, or the next 5 years. The Strategy Map establishes key objectives within the framework of the 4 ‘legs’ as they relate to achieving the overall goals of the organization. With this map, the organization can develop strategic initiatives that will ensure the goals are met, focusing on all 4 ‘Legs’ collaboratively. The following figure provides a good example of a top-level strategy map, linking the 4 ‘legs’ to the 3 long term goals of an organization. ‘Legs’ of the Growth & Market Highly Regarded Increased Balanced Share Expert in the Shareholder Value Scorecard Industry Customer Create desire for our Looked to for Profitability Leader Focus products, at our price Expertise First for our Shareholders Financial Increasing Revenue, Higher Margins, Performance Price Competitive Cost competitive Deliver when, where, and Demonstrated Best Cost Reduction, Business how much, f lexible to Practices, Leading- Efficient Process, Processes demand changes Edge Processes Minimize Waste Knowledge, Demonstrated Leaders Demonstrated Leaders Skills and and Experts in the and Experts in the competence Industry Industry The next figure provides an example of a strategy map for a car dealership, showing how interim goals align through the 4 ‘legs’ to achieve the 3 strategic objectives. STRATEGIC GOALS Profitable Shareholder Longevity Company Value Increase Increase Financial Increase Profit Revenue Market Share Customer Competitive Easy Reliable Price Rental Car Internal Reduce Reduce Car Streamline Processes Rework Costs Utilization Rental Staff Hire / Car Sales Learning & Training Selection Training Growth We see then, at the Internalthat HR plays a vital role in ensuring the workforce has the start, Processes competence and capability critical to achieving specific goals and accomplishing expected performance levels, which will enable the organization to achieve its overall goals and
- 5. objectives. But even beyond this, human resources are part of the internal processes, deal directly with customers, and provide for financial performance every day. Developing your Scorecard The creation of a balanced scorecard first takes the Strategy Map and adds performance metrics to each of the 4 ‘legs’ objectives. This is done at three levels: Strategic, Operational and Tactical. Strategic measures focus on the effectiveness of the overall long term performance of the organization. Operational measures look at productivity and delivery of the product and services the organization provides to the customer. And Tactical measures focus on daily activities and how well they are done in support of operational performance. Let’s take a look at an example of this application on a Healthcare Organization: Balanced Scorecard Worksheet - Strategic, Operational, Tactical - Example: Health Care Shared Services - Business Process 'Leg' Process Objectives Process Measurement Target Strategic - Align strategic direction with upcoming health care - Anticipated compliance, and Risk levels - 100% legislation - Benchmark 'best practices' for business process - Comparison to 'Best Practices' over time - Meet or Exceed performance, and establish achievement targets, strategies - Overall focus on Customer Satisfaction - Customer Satisfaction Indices - >98% Monthly Operational - Comply with existing and upcoming health care - Business Process Compliance to Legislation - 100% legislation Requirements - Effectively Plan and Operate at optimum cost - Staffing levels/Indices, Operational Process - Indices targes are 1.0 efficiency - staffing levels, operational process Cost Indices, Waste reduction, Response, - Waste Reduction: 25% year over year costs, reduced waste, … Customer Satisfaction operational indices, - Response: TBD and overall Process Performance - Overall Process Performance: >95% Tactical - Comply with legislated requirements for daily - Compliance to legislated requirements - 100% operation - Manage business and operational processes to - Compliance to budget weekly, Monthly, with - 100% or better budget actions in place - Meet daily, weekly and Monthly operational goals - Goal acheivement - on/off track - On track, or plans in place to recover - Ensure Customers needs are satisfied daily - Customer Satisfaction Indices - >98% - Conduct Admin functions in a timely manner - Cycle time, First Pass Yield, Rework and - Improvement 25% year over year process capability You then develop the Balanced Scorecard using these considerations for each ‘Leg’, linked to each objective, in terms of its measurement, expectation, level and rate of measure, and which departments or functions are linked to that objective. The result is a scorecard that balances performance across all 4 ‘legs’ to achieve the company’s strategic goals. The following figure is an example of how a Balanced Scorecard might look for a Retail Sales organization.
- 6. Scorecard Indicator Measure Units Target Leg Knowledge Employee feelings about Employee complaints Complaints 0 and Growth work Employee suggestions Ideas suggested and 10% more each year implemented Employee feelings about Employee turnover Turnover <5% qualifications Training and Development T&D numbers 25% per year Movement within Sears Employee feelings about the Growth Successions 15% per year future Internal Service oriented Handling situations First Pass Yield >95% Business Movement of merchandise Inventory levels/Turnover Process Helpful to Customers Ease of processes Cycle Time >5 per year 10% better each year Value Merchandise Customer Customer ideas and Number of ideas from Number, type >300 per year Focused recommendations customers suggested and % Implemented >10% implemented $ Saved/Improved >$5M each division Customer impressions Customer surveys Customer Retention % Return customers Percent, by demographics >10% each year New Customers % Increased customers Percent, by demographics >10% each year Financials Investment return ROA $$ $XXXX Profit Operating Margin Percent YY% Sales Gross Revenue $$ Sales $$MMMM Growth Revenue Growth over last Percent ZZ% year Draft Working Balanced Scorecard Example [Retail sales Corporation - Worldwide] A department such as HR can take this information, and determine what they would need to do to support the overall organization’s performance in meeting or exceeding its targets. It is not enough just to conduct training; an organization needs to define what it needs based on where it is going, and then take steps to develop/train, acquire or contract the necessary skills and competencies required. They might also examine the customer experience, to determine what can be improved in the human interface, as well as enhancing any operational or systems capability to enable greater levels of performance, to improve the organization’s financial gains. Dashboards Make Things Real For Everyone From this balanced scorecard, we now must help each person in the organization to understand their role in achieving these goals and objectives. To do this, we will now design our dashboards, by setting up the charts and graphs that display these measures and their performance so that they can indicate the comparison to expectations as the days, months and year progresses. The creative aspects of this step are limitless, in that the data can be displayed in dozens of ways, from line and bar charts to graphs to tables to pie shaped to any other number of ways to portray this information. The key is to keep it simple, clear and uncluttered, and easy to interpret for decision making. The next 2 figures are examples of how a dashboard might look for a sales or Operations Group.
- 7. Harry’s Widgets – Global Sales April 2004 (Fictional example) April Goal: $.7M Sales to date: ($000) Status: To Plan: +5% Hi Lo $1.8M AUS S. Am April Total: EU S.W. $736,233 K N.W. Regional Breakout 1 2 3 4 5 Sales Strategy Step Bill Bob Sue NW NE SE SW EU A EGY SA CA AUS CH JA K Reprinted with permission from Author, Balanced Scorecard Strategy for Dummies, Published Sept. 4, by Wiley Publishing Co. The key is to have first created the scorecard linking the different departments and functions and their specific goals and measures to the overall organization’s goals and objectives, and then to create the dashboards for these departments and functions to see how well they are doing, using visual display techniques based on real-time data updates and comparisons to expectations. An HR specific dashboard might depict levels of achieved competence given certain targets, or headcount churn levels by region, function or country. It can also tap into levels of errors experienced within the business processes, determine which are related to possible human error, and work with operations to improve or ‘mistake-proof’ processes and decisions, to then see improved performance as a result. Incorporating Scorecards and Dashboards Into Your Management Systems Imagine every group within an organization having dashboards that reflect real-time (hourly or daily if possible) performance against goals, and making decisions in real time (rather than
- 8. monthly or quarterly) that impact and adjust for optimum performance. Once the departments and functions have their dashboards up and running, each reflecting their own measures against specific goals as outlined within the 4 ‘legs’, and linked to the next level above with respect to performance and issue or problem resolution, every manager and leader will be able to tell how well his or her department is doing, and what adjustments might be necessary as well. Now imagine HR’s subsequent ability to support such an approach, where performance indicators can show opportunities for resource planning and development, tied directly to the goals and objectives of the organization. With each department dashboard linked to the next level above with respect to performance and issue or problem resolution, every manager and leader will be able to tell how well his or her department is doing, and, working with HR, determine what adjustments might be necessary as well. In companies that have incorporated this method, internal periodic reporting becomes obsolete as everyone can call up the data in real time and management teams can adjust accordingly. Decisions are proactive rather than reactive. And, performance objectives are rarely missed, if ever. You can customize your scorecard and dashboards to fit your business needs and wants, and then watch your performance and your management team excel.
- 9. About the Authors: Charles H. ‘Chuck’ Hannabarger, President of PSI Solutions, Inc., has worked with dozens of organizations over 28 years as an expert in management systems and continuous improvement strategies, Co-founder of The Balanced Business Institute, LLC, and co-author of the book Balanced Scorecard Strategy for Dummies, released Sept. 2007 by Wiley Publishing Co. Frederick S. ‘Rick’ Buchman has over 25 years seasoned experience in business performance consulting around the globe, Co-founder of The Balanced Business Institute, LLC, and co- author of the book Balanced Scorecard Strategy for Dummies, released Sept. 2007 by Wiley Publishing Co.