SlideShare une entreprise Scribd logo
1  sur  4
What are the prospects for global trade growth? 
At a glance… 
The outlook for global economic growth has deteriorated 
In October, policymakers will gather in Washington DC to assess global economic growth prospects. However, the outlook now looks less optimistic than it did in January (see Figure 1), mainly due to one-off events in the US and disappointing outturns in Japan and the Eurozone. 
Growing trade flows are one of the successes of multilateralism 
Despite these short term troubles, one area where there has been longer term success is the growth of world trade. Throughout our analysis, we focus on trade in goods as opposed to goods and services. 
Our analysis (see page 3) shows that global trade has increased by a factor of five since 1980, compared with ‘just’ a tripling of global GDP in the same period. 
This trend has had far ranging benefits for businesses and consumers. For example, in the aftermath of the financial crisis, stronger emerging market demand provided a much- needed lifeline for some hard-hit businesses in the advanced economies. 
From $10 trillion in 2013 to $18 trillion in 2030 
We think the global economy will become even more inter-connected in the future. Our analysis shows that the 
value of global goods trade is expected to grow in real terms from around $10 trillion in 2013 to around $18 trillion in 2030. This implied real trade growth of 3.3% per annum will be an important driver of global growth over this period. But our projections also show that there will be a reshuffling of the biggest ‘actors’ in the global trade arena, with Asia becoming ever more important. Specifically, our analysis suggests that by 2030: 
•China could feature in 12 out of the top 20 bi-lateral trade routes; and 
•the US and Germany could feature in only 5 out of the busiest 20 bilateral trade routes. For emerging economies, the best is yet to come Our analysis shows that trade between emerging economies is projected to grow by around 6% per annum in real terms in the period to 2030, almost twice the global average rate. By 2030, the trade links between China and India, as well as other South East Asian economies like Malaysia, Indonesia and Singapore, will become ever more important to global trade. This reflects Asia’s growing role in the world economy and its rapidly expanding consumer appetite. Our analysis here shows that, since 2012, consumer spending in the largest seven emerging markets (‘the E7’) has grown four times quicker than that in the G7 (see page 2). 
Visit our blog for periodic updates at: pwc.blogs.com/economics_in_business 
Fig 1: We have lowered our 2014 projections for global growth and for growth in the US and Japan since the beginning of the year 
Global Economy Watch October 2014 
Source: PwC analysis 
0.0 
0.5 
1.0 
1.5 
2.0 
2.5 
3.0 
3.5 
4.0 
Global (PPP) 
Global (MER) 
US 
Japan 
Eurozone 
2014 real GDP growth projection (%) 
Jan-14 
Oct-14
Economic update: The end is near for QE in the US 
QE likely to come to a halt at the end of October Since 2009, the Fed has expanded its balance sheet by purchasing around $3.7 trillion worth of mortgage-backed securities and US Treasury debt (see Figure 2). But this policy of quantitative easing (‘QE’) is likely to be brought to an end at the next meeting of the Federal Open Market Committee (FOMC) in late October. However, the Committee did keep the door open for further purchases in the event of unexpected developments in the labour market or around inflation. One step closer to normal monetary policy The likely end of QE is the first step in the Fed’s return to normal monetary policy, which will eventually involve raising interest rates and winding down its asset holdings. We see two key points coming out of the latest Fed guidance on this transition: 
•the FOMC do not expect to stop renewing maturing QE assets until after interest rates have begun to rise, which we expect to occur gradually from mid-2015 onwards assuming no major data surprises; and 
•the FOMC do not expect to sell mortgage-backed securities, suggesting that the Fed will hold this debt to maturity; this “gradual and predictable” approach should reduce the risk of a serious adverse impact on the market prices of these securities during the transition period. 
Fig 2: The Fed’s holding of mortgage-backed and Treasury securities has increased dramatically since 2009 
What is the GCI? Consumer spending is the biggest component of the global economy and so a key driver of future growth. Our monthly updated Global Consumer Index (GCI) aims to provide an early steer on consumer spending and growth prospects in the world’s 20 largest economies. 
When it comes to giving an early steer on consumer spending trends, our GCI passes the test 
E7 consumers on a spending spree Focusing on the seven largest emerging economies in the world (the ‘E7’*), our analysis shows that, since 2012, consumption in these E7 markets has grown four times more quickly than in the G7 (see Figure 4). In absolute terms, consumer spending in the E7 remains significantly smaller compared to the G7. However, as economic activity continues to shift from the West to the East we expect this to have a positive knock-on impact on living standards in the E7, which will boost consumer demand there for a wide variety of products and services. 
Fig 3: The GCI has been a good indicator of trends in consumer spending 
Sources: PwC analysis, Datastream 
(correlation coefficient of +0.8) with actual consumer data sourced from national accounts (which only becomes available at a global level some months after the data used in our index). This is further reinforced by the fact that the Index has, on average, underestimated actual consumer spending by just 0.1 percentage points – a very small average margin of error. 
What trends are we seeing in the latest data? 
For the month of September, we expect consumption to grow by 2.9% (year- on-year) which is above the long-term rate of 2.7%. 
Even though this is a respectable growth rate it comes on the back of a rather abrupt slowdown in global consumption in the second quarter of 2014. This was partly attributed to the rise in consumption tax in Japan - the first such increase in 17 years. 
At the same time, we have continued to see disappointing growth in the Eurozone, which is dragging down global consumption. However, if the US and UK remain on a positive growth path this should act as a buffer against some of these more negative influences. 
Source: US Federal Reserve 
Fig 4: Real consumer spending has grown faster in the E7 than in the G7 
Sources: PwC analysis, Datastream 
So how has our GCI been doing? Broadly speaking the GCI has been successful at tracking global consumer spending trends (see Figure 3). Our analysis of the numbers show that our index is strongly correlated 
0% 
2% 
4% 
6% 
8% 
10% 
12% 
14% 
G7 
E7 
% change in consumer spending 2012 Q1 - 2014 Q2 
5.5 
2.0 
2014 Q2 consumer spending ($trn, 2010 prices) 
0.0 
0.5 
1.0 
1.5 
2.0 
2.5 
3.0 
2009 
2010 
2011 
2012 
2013 
2014 
Federal Reserve holdings (US$ trillion) 
Mortgage-backed securities 
US Treasury securities 
-2% 
-1% 
0% 
1% 
2% 
3% 
4% 
2004 
Q1 
2006 
Q1 
2008 
Q1 
2010 
Q1 
2012 
Q1 
2014 
Q1 
% change on a year earlier 
GCI 
Actual consumer spending 
*Brazil, Russia, India, China, Mexico, Turkey, Indonesia
0% 
1% 
2% 
3% 
4% 
5% 
6% 
7% 
Advanced - Advanced 
Advanced - Emerging 
Emerging - Emerging 
Projected 2013-2030 CAGR of intra-group trade 
Where will the top goods trade routes be in 2030? 
Focusing on the bright side: Global trade One of the long-term successes of multilateralism has been the strengthening of trade flows across the global economy. Our analysis of IMF numbers shows that, since 1980, the volume of global trade has increased by a factor of five, compared with ‘just’ a tripling of global GDP over the same period (measured in purchasing power parity terms). This trend has been good news for businesses, especially those with a global footprint, which have the ability to cushion a down-turn in their home markets by switching their sales efforts to overseas markets. Historically, growth in trade was limited to a ‘closed club’ of Western economies. But successive rounds of GATT trade liberalisation talks and the subsequent establishment of the World Trade Organisation (WTO) in 1995 helped to expand trade on a global basis. Is this trend set to continue and, if so, which will be the busiest merchandise trade routes in 2030? Goods trade between advanced and emerging economies is projected to grow by around $4 trillion by 2030 Our estimate is that the total value of global goods trade will continue to grow from around $10.3 trillion in 2013 to around $18 trillion in 2030 (in constant 2013 US dollars) with trade between advanced and emerging markets accounting for almost half ($3.9 trillion) of this increase (see Figure 5). China, which is by far the largest emerging economy in the world, is expected to grab a bigger slice of the world’s top trade routes by 2030 because: 
•Chinese consumers are expected to buy more overseas goods as they become wealthier, so leading to higher imports; and 
•China will also remain a key player in manufacturing, although it is likely to move to higher valued exports (e.g. cars not textiles) as its relative wage costs get higher in line with increased capital investment and productivity. Brazil, India, Saudi Arabia and the UAE feature in the Top 20 Our analysis also shows that global trade is expected to enter a new phase in the next two decades, with intra-emerging-market trade growing at around 6% per annum (see Figure 5). Our analysis suggests that by 2030: 
•the China – India trade link will grow to become the world’s 7th largest trade route, exceeding the size of the Germany-US trade route; 
•resource rich economies like Brazil and Saudi Arabia are projected to take advantage of China’s appetite for natural resources and further strengthen their already strong trade links with China; and 
•trade links between China and other lower cost South East Asian economies (e.g. Indonesia) will intensify as Chinese companies look to take advantage of the relatively lower wages on offer in these markets. So what does this mean for businesses? We think there are two key things for businesses to consider in their future plans: 
1.China is expected to reinforce its position as the major global goods trading hub. China’s lead over the US for the title of ‘most places in the top 20’ is expected to grow from 2 places in 2013 to 7 places in 2030, further evidence of economic power shifting from the West to the East. 
2.The emergence of South East Asia as a centre for global trade will need to be accompanied by major infrastructure investments, particularly in transportation, to allow easier movement of goods to market. 
Ranking 
Bilateral trade pair 
Trade value (2013 US$ bn) 
1 
China 
US 
491 
2 
China 
Japan 
279 
3 
China 
South Korea 
237 
4 
Germany 
France 
225 
5 
Japan 
US 
200 
6 
Germany 
US 
165 
7 
China 
Germany 
157 
8 
Germany 
UK 
143 
9 
Germany 
Italy 
134 
10 
China 
Australia 
125 
11 
UK 
US 
110 
12 
South Korea 
US 
104 
13 
France 
Italy 
96 
14 
China 
Singapore 
94 
15 
Hong Kong 
US 
92 
16 
Japan 
South Korea 
91 
17 
China 
Brazil 
82 
18 
Singapore 
Malaysia 
82 
19 
UAE 
India 
80 
20 
China 
Malaysia 
77 
Ranking 
Bilateral trade pair 
Projected trade value (2013 US$ bn) 
1 u 
China 
US 
716 
2 u 
China 
Japan 
390 
3 u 
China 
South Korea 
366 
4 u 
Germany 
France 
277 
5 u 
Japan 
US 
244 
6 s 
China 
Germany 
240 
7 g 
China 
India 
214 
8 t 
Germany 
US 
209 
9 s 
China 
Singapore 
208 
10 u 
China 
Australia 
205 
11 s 
China 
Malaysia 
189 
12 g 
China 
Indonesia 
179 
13 t 
Germany 
UK 
178 
14 s 
China 
Brazil 
165 
15 g 
China 
Saudi Arabia 
164 
16 t 
Germany 
Italy 
163 
17 t 
Hong Kong 
US 
146 
18 g 
China 
UAE 
144 
19 t 
South Korea 
US 
142 
20 t 
UAE 
India 
141 
Table 1: Top 20 bilateral goods trade routes in 2013 
Table 2: Top 20 bilateral goods trade routes in 2030 
Assumptions underlying projections Our analysis above was based on an update of our previous research (Future of world trade: Top 25 sea and air freight routes in 2030). Our estimates are based on the following key assumptions: 
•national GDP growth rates follow those projected by the IMF in the World Economic Outlook report and our World in 2050 projections; 
•trade flows are based on merchandise exports to GDP ratios, which have been fixed at their long-term rates; and 
•we project how the destination of each country’s exports is expected to evolve over the period using a weighted average of current and future demand, which is driven by GDP growth. Our analysis is restricted to 29 major economies selected on the basis of their present size (GDP) and the expected growth rate of their trade flows. 
Fig 5: We expect goods trade between emerging markets to be the fastest growing bloc 
2.3 
3.9 
1.4 
2013-2030 difference in trade value ($trn) 
Note: For the purposes of compiling the tables, we have removed intra-European (with the exception of the 4 largest European economies), US-Canada and China-Hong Kong trade routes. 
Source: PwC analysis (countries categorised according to IMF country groups) 
Source: PwC analysis 
u retains position; s moves up; t moves down; g new entrant
Projections: October 2014 
Sources: PwC analysis, National statistical authorities, Thomson Datastream and IMF. All inflation indicators relate to the Consumer Price Index (CPI), with the exception of the Indian indicator which refers to the Wholesale Price Index (WPI). Argentina's inflation projections use the IPCNu Index released by INDEC which is based in the fourth quarter of 2013 (therefore we do not provide a 2013 estimate). We will provide a 2016-2020 inflation projection once a longer time series of data is available. GDP projections for Argentina use the 2004 base year national account data (previously base year 1993). Our Nigeria GDP projections relate to the new rebased GDP figures but are subject to high margins of error. Also note that the tables above form our main scenario projections and are therefore subject to considerable uncertainties. We recommend that our clients look at a range of alternative scenarios. 
Interest rate outlook of major economies 
Current rate (Last change) 
Expectation 
Next meeting 
Federal Reserve 
0-0.25% (December 2008) 
Rate to start to rise during the second half of 2015 
28-29 October 
European Central Bank 
0.05% (September 2014) 
Rates on hold following decrease in September 
6 November 
Bank of England 
0.5% (March 2009) 
Rate to rise gradually from late 2014 or early 2015 
9 October 
Richard Boxshall T: +44 (0) 20 7213 2079 E: richard.boxshall@uk.pwc.com 
Conor Lambe T: +44 (0) 20 7212 8783 E: conor.r.lambe@uk.pwc.com 
Barret Kupelian T: + 44 (0) 20 7213 1579 E: barret.g.kupelian@uk.pwc.com 
The GCI is a monthly updated index providing an early steer on consumer spending and growth prospects in the world’s 20 largest economies. For more information, please visit www.pwc.co.uk/globalconsumerindex 
This publication has been prepared for general guidance on matters of interest only, and does not constitute professional advice. You should not act upon the information contained in this publication without obtaining specific professional advice. No representation or warranty (express or implied) is given as to the accuracy or completeness of the information contained in this publication, and, to the extent permitted by law, PricewaterhouseCoopers LLP, its members, employees and agents do not accept or assume any liability, responsibility or duty of care for any consequences of you or anyone else acting, or refraining to act, in reliance on the information contained in this publication or for any decision based on it. © 2014 PricewaterhouseCoopers LLP. All rights reserved. In this document, “PwC” refers to the UK member firm, and may sometimes refer to the PwC network. Each member firm is a separate legal entity. Please see www.pwc.com/structure for further details. 
We help you understand how big economic, demographic, social, and environmental changes affect your organisation by setting out scenarios that identify growth opportunities and risks on a global, regional, national and local level. We help make strategic and tactical operational, pricing and investment decisions to support business value creation. We work together with you to achieve sustainable growth. 
PwC’s Global Consumer Index Global consumer spending growth falls to 2.9% this month, the lowest rate since July 2013. Growth in the money supply has slowed while consumer confidence has fallen again this month. Energy commodity prices also fell, exerting downward pressure on the index. However, on a brighter note, industrial production grew strongly. 
0.0% 
0.5% 
1.0% 
1.5% 
2.0% 
2.5% 
3.0% 
3.5% 
4.0% 
Oct-13 
Nov-13 
Dec-13 
Jan-14 
Feb-14 
Mar-14 
Apr-14 
May-14 
Jun-14 
Jul-14 
Aug-14 
Sep-14 
YoY growth 
Long-term growth 
2.9% PPP*MER*20132014p2015p2016-2020p20132014p2015p2016-2020pGlobal (market exchange rates)100%2.52.73.13.22.32.72.82.6Global (PPP rates)100%3.03.13.63.6United States19.5%22.5%2.22.13.12.41.51.92.21.9China14.7%11.4%7.77.47.37.02.62.33.03.4Japan5.5%8.3%1.51.31.21.20.42.51.71.5United Kingdom2.8%3.4%1.73.02.62.42.61.71.92.0Eurozone13.5%16.9%-0.5 0.81.31.51.40.51.21.5France2.7%3.6%0.10.40.91.71.00.71.01.5Germany3.8%4.7%0.21.51.61.31.60.81.61.7Greece0.3%0.3%-3.9 0.21.83.0-0.9 -1.2 -0.3 1.3Ireland0.2%0.3%0.23.42.52.50.50.51.51.5Italy2.2%2.8%-1.8 -0.2 0.61.01.30.20.91.4Netherlands0.8%1.1%-0.7 0.81.52.02.60.91.21.4Portugal0.3%0.3%-1.0 0.91.61.80.40.00.61.5Spain1.7%1.8%-1.2 1.21.71.51.5-0.1 0.81.0Poland1.0%0.7%1.63.23.33.51.20.41.82.5Russia3.0%2.8%1.30.10.52.56.87.16.35.0Turkey1.3%1.1%4.12.83.84.57.58.87.04.8Australia1.2%2.1%2.43.22.83.12.22.62.62.7India5.7%2.6%4.75.26.56.56.35.65.96.0Indonesia1.4%1.2%5.85.25.86.36.46.25.95.1South Korea1.9%1.6%3.03.53.63.81.31.72.22.9Argentina0.9%0.7%2.9-1.6 0.63.3-25.025.0- Brazil2.8%3.1%2.30.51.54.06.26.25.44.8Canada1.8%2.5%2.02.22.52.21.02.01.82.1Mexico2.2%1.6%1.32.63.73.63.83.93.73.6South Africa0.7%0.5%1.91.62.53.85.86.25.64.8Nigeria0.5%0.4%5.56.36.25.78.58.58.67.3Saudi Arabia1.1%1.0%4.04.34.44.33.53.13.54.0Real GDP growthInflation Share of 2012 world GDP

Contenu connexe

En vedette

Economics The Best Economy
Economics The Best EconomyEconomics The Best Economy
Economics The Best Economyguest2fa30e
 
How much does prostitution contribute to the uk economy?
How much does prostitution contribute to the uk economy?How much does prostitution contribute to the uk economy?
How much does prostitution contribute to the uk economy?Andrew Fogg
 
Sectors of indian economy
Sectors of indian economySectors of indian economy
Sectors of indian economyLehan Fayaz
 
Новая реальность налоговых соглашений.
Новая реальность  налоговых  соглашений.Новая реальность  налоговых  соглашений.
Новая реальность налоговых соглашений.PwC Russia
 
French economy
French economyFrench economy
French economyCOLUMDAE
 
Prospects for the UK Economy in 2012
Prospects for the UK Economy in 2012Prospects for the UK Economy in 2012
Prospects for the UK Economy in 2012tutor2u
 
A2 Macro: Challenges for the UK Economy
A2 Macro: Challenges for the UK EconomyA2 Macro: Challenges for the UK Economy
A2 Macro: Challenges for the UK Economytutor2u
 
UK Economy in 2015 - Macro Revision Presentation
UK Economy in 2015 - Macro Revision PresentationUK Economy in 2015 - Macro Revision Presentation
UK Economy in 2015 - Macro Revision PresentationEton College
 
Digital Manufacturing:cogliere l'opportunità per il rinascimento digitale.
 Digital Manufacturing:cogliere l'opportunità per il rinascimento digitale. Digital Manufacturing:cogliere l'opportunità per il rinascimento digitale.
Digital Manufacturing:cogliere l'opportunità per il rinascimento digitale.FaberLab
 
Role Of Banks In Indian Economy Presentation
Role Of Banks In Indian Economy PresentationRole Of Banks In Indian Economy Presentation
Role Of Banks In Indian Economy PresentationICICI Securities
 
France - presentation
France -  presentationFrance -  presentation
France - presentationRida Khan
 
PwC Trends in the workforce
PwC Trends in the workforcePwC Trends in the workforce
PwC Trends in the workforcePwC
 

En vedette (16)

Economics The Best Economy
Economics The Best EconomyEconomics The Best Economy
Economics The Best Economy
 
How much does prostitution contribute to the uk economy?
How much does prostitution contribute to the uk economy?How much does prostitution contribute to the uk economy?
How much does prostitution contribute to the uk economy?
 
Sectors of indian economy
Sectors of indian economySectors of indian economy
Sectors of indian economy
 
Economy
EconomyEconomy
Economy
 
Новая реальность налоговых соглашений.
Новая реальность  налоговых  соглашений.Новая реальность  налоговых  соглашений.
Новая реальность налоговых соглашений.
 
French economy
French economyFrench economy
French economy
 
Prospects for the UK Economy in 2012
Prospects for the UK Economy in 2012Prospects for the UK Economy in 2012
Prospects for the UK Economy in 2012
 
Uk economy update 2015
Uk economy update 2015Uk economy update 2015
Uk economy update 2015
 
the economy of UK
the economy of UKthe economy of UK
the economy of UK
 
A2 Macro: Challenges for the UK Economy
A2 Macro: Challenges for the UK EconomyA2 Macro: Challenges for the UK Economy
A2 Macro: Challenges for the UK Economy
 
UK Economy in 2015 - Macro Revision Presentation
UK Economy in 2015 - Macro Revision PresentationUK Economy in 2015 - Macro Revision Presentation
UK Economy in 2015 - Macro Revision Presentation
 
Digital Manufacturing:cogliere l'opportunità per il rinascimento digitale.
 Digital Manufacturing:cogliere l'opportunità per il rinascimento digitale. Digital Manufacturing:cogliere l'opportunità per il rinascimento digitale.
Digital Manufacturing:cogliere l'opportunità per il rinascimento digitale.
 
Role Of Banks In Indian Economy Presentation
Role Of Banks In Indian Economy PresentationRole Of Banks In Indian Economy Presentation
Role Of Banks In Indian Economy Presentation
 
France - presentation
France -  presentationFrance -  presentation
France - presentation
 
France-2015-main-findings-growth-and-jobs
France-2015-main-findings-growth-and-jobsFrance-2015-main-findings-growth-and-jobs
France-2015-main-findings-growth-and-jobs
 
PwC Trends in the workforce
PwC Trends in the workforcePwC Trends in the workforce
PwC Trends in the workforce
 

Plus de PwC France

Etude PwC "20ème édition de la CEO Survey" - Janvier 2017
Etude PwC "20ème édition de la CEO Survey" - Janvier 2017Etude PwC "20ème édition de la CEO Survey" - Janvier 2017
Etude PwC "20ème édition de la CEO Survey" - Janvier 2017PwC France
 
Etude PwC "Carbon Factor" (nov. 2015)
Etude PwC "Carbon Factor" (nov. 2015)Etude PwC "Carbon Factor" (nov. 2015)
Etude PwC "Carbon Factor" (nov. 2015)PwC France
 
Etude PwC : La transition énergétique pour la croissance verte (nov 2015)
Etude PwC : La transition énergétique pour la croissance verte (nov 2015)Etude PwC : La transition énergétique pour la croissance verte (nov 2015)
Etude PwC : La transition énergétique pour la croissance verte (nov 2015)PwC France
 
Etude PwC "Total Retail 2015" Sur quoi miser aujourd’hui pour réenchanter la ...
Etude PwC "Total Retail 2015" Sur quoi miser aujourd’hui pour réenchanter la ...Etude PwC "Total Retail 2015" Sur quoi miser aujourd’hui pour réenchanter la ...
Etude PwC "Total Retail 2015" Sur quoi miser aujourd’hui pour réenchanter la ...PwC France
 
GEMO 2016 : un digital de plus en plus cannibale ?
GEMO 2016  : un digital de plus en plus cannibale ?GEMO 2016  : un digital de plus en plus cannibale ?
GEMO 2016 : un digital de plus en plus cannibale ?PwC France
 
Infographie PwC GEMO 2016 sur l'industrie Médias et Loisirs (juin 2015)
Infographie PwC GEMO 2016 sur l'industrie Médias et Loisirs (juin 2015)Infographie PwC GEMO 2016 sur l'industrie Médias et Loisirs (juin 2015)
Infographie PwC GEMO 2016 sur l'industrie Médias et Loisirs (juin 2015)PwC France
 
Etude PwC Low Carbon Economy Index (oct. 2015)
Etude PwC Low Carbon Economy Index (oct. 2015)Etude PwC Low Carbon Economy Index (oct. 2015)
Etude PwC Low Carbon Economy Index (oct. 2015)PwC France
 
Etude FCD, ESSEC et PwC sur la distribution responsable (août 2015)
Etude FCD, ESSEC et PwC sur la distribution responsable (août 2015)Etude FCD, ESSEC et PwC sur la distribution responsable (août 2015)
Etude FCD, ESSEC et PwC sur la distribution responsable (août 2015)PwC France
 
Etude PwC IPO Watch
Etude PwC IPO WatchEtude PwC IPO Watch
Etude PwC IPO WatchPwC France
 
Etude PwC CEO Survey Talent "People Strategy for the Digital Age" (juillet 2015)
Etude PwC CEO Survey Talent "People Strategy for the Digital Age" (juillet 2015)Etude PwC CEO Survey Talent "People Strategy for the Digital Age" (juillet 2015)
Etude PwC CEO Survey Talent "People Strategy for the Digital Age" (juillet 2015)PwC France
 
Etude PwC Golden Age Index (juin 2015)
Etude PwC Golden Age Index (juin 2015)Etude PwC Golden Age Index (juin 2015)
Etude PwC Golden Age Index (juin 2015)PwC France
 
Etude PwC Global Economy Watch (juin 2015)
Etude PwC Global Economy Watch (juin 2015)Etude PwC Global Economy Watch (juin 2015)
Etude PwC Global Economy Watch (juin 2015)PwC France
 
Etude PwC et Essec "Grande consommation 1985 - 2015 - 2045"
Etude PwC et Essec "Grande consommation 1985 - 2015 - 2045"Etude PwC et Essec "Grande consommation 1985 - 2015 - 2045"
Etude PwC et Essec "Grande consommation 1985 - 2015 - 2045"PwC France
 
Etude PwC sur le Top 100 des entreprises les mieux valorisées au monde en 201...
Etude PwC sur le Top 100 des entreprises les mieux valorisées au monde en 201...Etude PwC sur le Top 100 des entreprises les mieux valorisées au monde en 201...
Etude PwC sur le Top 100 des entreprises les mieux valorisées au monde en 201...PwC France
 
Etude PwC "Point of View: Enterprise Portfolio & Program Management" (mai 2015)
Etude PwC "Point of View: Enterprise Portfolio & Program Management" (mai 2015)Etude PwC "Point of View: Enterprise Portfolio & Program Management" (mai 2015)
Etude PwC "Point of View: Enterprise Portfolio & Program Management" (mai 2015)PwC France
 
Etude PwC "Bridging the gap" sur les investisseurs institutionnels (mai 2015)
Etude PwC "Bridging the gap" sur les investisseurs institutionnels (mai 2015)Etude PwC "Bridging the gap" sur les investisseurs institutionnels (mai 2015)
Etude PwC "Bridging the gap" sur les investisseurs institutionnels (mai 2015)PwC France
 
Etude PwC, AFDEL et SNJV sur "Les 100 digital"
Etude PwC, AFDEL et SNJV sur "Les 100 digital"Etude PwC, AFDEL et SNJV sur "Les 100 digital"
Etude PwC, AFDEL et SNJV sur "Les 100 digital"PwC France
 
Etude PwC Global Economy Watch (mai 2015)
Etude PwC Global Economy Watch (mai 2015)Etude PwC Global Economy Watch (mai 2015)
Etude PwC Global Economy Watch (mai 2015)PwC France
 
Etude PwC sur l'économie collaborative (mai 2015)
Etude PwC sur l'économie collaborative (mai 2015)Etude PwC sur l'économie collaborative (mai 2015)
Etude PwC sur l'économie collaborative (mai 2015)PwC France
 
Etude PwC sur l'intérêt des investisseurs pour l’Afrique (avril 2015)
Etude PwC sur l'intérêt des investisseurs pour l’Afrique (avril 2015)Etude PwC sur l'intérêt des investisseurs pour l’Afrique (avril 2015)
Etude PwC sur l'intérêt des investisseurs pour l’Afrique (avril 2015)PwC France
 

Plus de PwC France (20)

Etude PwC "20ème édition de la CEO Survey" - Janvier 2017
Etude PwC "20ème édition de la CEO Survey" - Janvier 2017Etude PwC "20ème édition de la CEO Survey" - Janvier 2017
Etude PwC "20ème édition de la CEO Survey" - Janvier 2017
 
Etude PwC "Carbon Factor" (nov. 2015)
Etude PwC "Carbon Factor" (nov. 2015)Etude PwC "Carbon Factor" (nov. 2015)
Etude PwC "Carbon Factor" (nov. 2015)
 
Etude PwC : La transition énergétique pour la croissance verte (nov 2015)
Etude PwC : La transition énergétique pour la croissance verte (nov 2015)Etude PwC : La transition énergétique pour la croissance verte (nov 2015)
Etude PwC : La transition énergétique pour la croissance verte (nov 2015)
 
Etude PwC "Total Retail 2015" Sur quoi miser aujourd’hui pour réenchanter la ...
Etude PwC "Total Retail 2015" Sur quoi miser aujourd’hui pour réenchanter la ...Etude PwC "Total Retail 2015" Sur quoi miser aujourd’hui pour réenchanter la ...
Etude PwC "Total Retail 2015" Sur quoi miser aujourd’hui pour réenchanter la ...
 
GEMO 2016 : un digital de plus en plus cannibale ?
GEMO 2016  : un digital de plus en plus cannibale ?GEMO 2016  : un digital de plus en plus cannibale ?
GEMO 2016 : un digital de plus en plus cannibale ?
 
Infographie PwC GEMO 2016 sur l'industrie Médias et Loisirs (juin 2015)
Infographie PwC GEMO 2016 sur l'industrie Médias et Loisirs (juin 2015)Infographie PwC GEMO 2016 sur l'industrie Médias et Loisirs (juin 2015)
Infographie PwC GEMO 2016 sur l'industrie Médias et Loisirs (juin 2015)
 
Etude PwC Low Carbon Economy Index (oct. 2015)
Etude PwC Low Carbon Economy Index (oct. 2015)Etude PwC Low Carbon Economy Index (oct. 2015)
Etude PwC Low Carbon Economy Index (oct. 2015)
 
Etude FCD, ESSEC et PwC sur la distribution responsable (août 2015)
Etude FCD, ESSEC et PwC sur la distribution responsable (août 2015)Etude FCD, ESSEC et PwC sur la distribution responsable (août 2015)
Etude FCD, ESSEC et PwC sur la distribution responsable (août 2015)
 
Etude PwC IPO Watch
Etude PwC IPO WatchEtude PwC IPO Watch
Etude PwC IPO Watch
 
Etude PwC CEO Survey Talent "People Strategy for the Digital Age" (juillet 2015)
Etude PwC CEO Survey Talent "People Strategy for the Digital Age" (juillet 2015)Etude PwC CEO Survey Talent "People Strategy for the Digital Age" (juillet 2015)
Etude PwC CEO Survey Talent "People Strategy for the Digital Age" (juillet 2015)
 
Etude PwC Golden Age Index (juin 2015)
Etude PwC Golden Age Index (juin 2015)Etude PwC Golden Age Index (juin 2015)
Etude PwC Golden Age Index (juin 2015)
 
Etude PwC Global Economy Watch (juin 2015)
Etude PwC Global Economy Watch (juin 2015)Etude PwC Global Economy Watch (juin 2015)
Etude PwC Global Economy Watch (juin 2015)
 
Etude PwC et Essec "Grande consommation 1985 - 2015 - 2045"
Etude PwC et Essec "Grande consommation 1985 - 2015 - 2045"Etude PwC et Essec "Grande consommation 1985 - 2015 - 2045"
Etude PwC et Essec "Grande consommation 1985 - 2015 - 2045"
 
Etude PwC sur le Top 100 des entreprises les mieux valorisées au monde en 201...
Etude PwC sur le Top 100 des entreprises les mieux valorisées au monde en 201...Etude PwC sur le Top 100 des entreprises les mieux valorisées au monde en 201...
Etude PwC sur le Top 100 des entreprises les mieux valorisées au monde en 201...
 
Etude PwC "Point of View: Enterprise Portfolio & Program Management" (mai 2015)
Etude PwC "Point of View: Enterprise Portfolio & Program Management" (mai 2015)Etude PwC "Point of View: Enterprise Portfolio & Program Management" (mai 2015)
Etude PwC "Point of View: Enterprise Portfolio & Program Management" (mai 2015)
 
Etude PwC "Bridging the gap" sur les investisseurs institutionnels (mai 2015)
Etude PwC "Bridging the gap" sur les investisseurs institutionnels (mai 2015)Etude PwC "Bridging the gap" sur les investisseurs institutionnels (mai 2015)
Etude PwC "Bridging the gap" sur les investisseurs institutionnels (mai 2015)
 
Etude PwC, AFDEL et SNJV sur "Les 100 digital"
Etude PwC, AFDEL et SNJV sur "Les 100 digital"Etude PwC, AFDEL et SNJV sur "Les 100 digital"
Etude PwC, AFDEL et SNJV sur "Les 100 digital"
 
Etude PwC Global Economy Watch (mai 2015)
Etude PwC Global Economy Watch (mai 2015)Etude PwC Global Economy Watch (mai 2015)
Etude PwC Global Economy Watch (mai 2015)
 
Etude PwC sur l'économie collaborative (mai 2015)
Etude PwC sur l'économie collaborative (mai 2015)Etude PwC sur l'économie collaborative (mai 2015)
Etude PwC sur l'économie collaborative (mai 2015)
 
Etude PwC sur l'intérêt des investisseurs pour l’Afrique (avril 2015)
Etude PwC sur l'intérêt des investisseurs pour l’Afrique (avril 2015)Etude PwC sur l'intérêt des investisseurs pour l’Afrique (avril 2015)
Etude PwC sur l'intérêt des investisseurs pour l’Afrique (avril 2015)
 

Dernier

Stock Market Brief Deck (Under Pressure).pdf
Stock Market Brief Deck (Under Pressure).pdfStock Market Brief Deck (Under Pressure).pdf
Stock Market Brief Deck (Under Pressure).pdfMichael Silva
 
CALL ON ➥8923113531 🔝Call Girls Gomti Nagar Lucknow best sexual service
CALL ON ➥8923113531 🔝Call Girls Gomti Nagar Lucknow best sexual serviceCALL ON ➥8923113531 🔝Call Girls Gomti Nagar Lucknow best sexual service
CALL ON ➥8923113531 🔝Call Girls Gomti Nagar Lucknow best sexual serviceanilsa9823
 
VIP Independent Call Girls in Bandra West 🌹 9920725232 ( Call Me ) Mumbai Esc...
VIP Independent Call Girls in Bandra West 🌹 9920725232 ( Call Me ) Mumbai Esc...VIP Independent Call Girls in Bandra West 🌹 9920725232 ( Call Me ) Mumbai Esc...
VIP Independent Call Girls in Bandra West 🌹 9920725232 ( Call Me ) Mumbai Esc...dipikadinghjn ( Why You Choose Us? ) Escorts
 
(DIYA) Bhumkar Chowk Call Girls Just Call 7001035870 [ Cash on Delivery ] Pun...
(DIYA) Bhumkar Chowk Call Girls Just Call 7001035870 [ Cash on Delivery ] Pun...(DIYA) Bhumkar Chowk Call Girls Just Call 7001035870 [ Cash on Delivery ] Pun...
(DIYA) Bhumkar Chowk Call Girls Just Call 7001035870 [ Cash on Delivery ] Pun...ranjana rawat
 
02_Fabio Colombo_Accenture_MeetupDora&Cybersecurity.pptx
02_Fabio Colombo_Accenture_MeetupDora&Cybersecurity.pptx02_Fabio Colombo_Accenture_MeetupDora&Cybersecurity.pptx
02_Fabio Colombo_Accenture_MeetupDora&Cybersecurity.pptxFinTech Belgium
 
Booking open Available Pune Call Girls Shivane 6297143586 Call Hot Indian Gi...
Booking open Available Pune Call Girls Shivane  6297143586 Call Hot Indian Gi...Booking open Available Pune Call Girls Shivane  6297143586 Call Hot Indian Gi...
Booking open Available Pune Call Girls Shivane 6297143586 Call Hot Indian Gi...Call Girls in Nagpur High Profile
 
Vip Call US 📞 7738631006 ✅Call Girls In Sakinaka ( Mumbai )
Vip Call US 📞 7738631006 ✅Call Girls In Sakinaka ( Mumbai )Vip Call US 📞 7738631006 ✅Call Girls In Sakinaka ( Mumbai )
Vip Call US 📞 7738631006 ✅Call Girls In Sakinaka ( Mumbai )Pooja Nehwal
 
VIP Call Girl Service Andheri West ⚡ 9920725232 What It Takes To Be The Best ...
VIP Call Girl Service Andheri West ⚡ 9920725232 What It Takes To Be The Best ...VIP Call Girl Service Andheri West ⚡ 9920725232 What It Takes To Be The Best ...
VIP Call Girl Service Andheri West ⚡ 9920725232 What It Takes To Be The Best ...dipikadinghjn ( Why You Choose Us? ) Escorts
 
The Economic History of the U.S. Lecture 19.pdf
The Economic History of the U.S. Lecture 19.pdfThe Economic History of the U.S. Lecture 19.pdf
The Economic History of the U.S. Lecture 19.pdfGale Pooley
 
The Economic History of the U.S. Lecture 30.pdf
The Economic History of the U.S. Lecture 30.pdfThe Economic History of the U.S. Lecture 30.pdf
The Economic History of the U.S. Lecture 30.pdfGale Pooley
 
Top Rated Pune Call Girls Viman Nagar ⟟ 6297143586 ⟟ Call Me For Genuine Sex...
Top Rated  Pune Call Girls Viman Nagar ⟟ 6297143586 ⟟ Call Me For Genuine Sex...Top Rated  Pune Call Girls Viman Nagar ⟟ 6297143586 ⟟ Call Me For Genuine Sex...
Top Rated Pune Call Girls Viman Nagar ⟟ 6297143586 ⟟ Call Me For Genuine Sex...Call Girls in Nagpur High Profile
 
TEST BANK For Corporate Finance, 13th Edition By Stephen Ross, Randolph Weste...
TEST BANK For Corporate Finance, 13th Edition By Stephen Ross, Randolph Weste...TEST BANK For Corporate Finance, 13th Edition By Stephen Ross, Randolph Weste...
TEST BANK For Corporate Finance, 13th Edition By Stephen Ross, Randolph Weste...ssifa0344
 
High Class Call Girls Nashik Maya 7001305949 Independent Escort Service Nashik
High Class Call Girls Nashik Maya 7001305949 Independent Escort Service NashikHigh Class Call Girls Nashik Maya 7001305949 Independent Escort Service Nashik
High Class Call Girls Nashik Maya 7001305949 Independent Escort Service NashikCall Girls in Nagpur High Profile
 
VVIP Pune Call Girls Katraj (7001035870) Pune Escorts Nearby with Complete Sa...
VVIP Pune Call Girls Katraj (7001035870) Pune Escorts Nearby with Complete Sa...VVIP Pune Call Girls Katraj (7001035870) Pune Escorts Nearby with Complete Sa...
VVIP Pune Call Girls Katraj (7001035870) Pune Escorts Nearby with Complete Sa...Call Girls in Nagpur High Profile
 
The Economic History of the U.S. Lecture 21.pdf
The Economic History of the U.S. Lecture 21.pdfThe Economic History of the U.S. Lecture 21.pdf
The Economic History of the U.S. Lecture 21.pdfGale Pooley
 
The Economic History of the U.S. Lecture 26.pdf
The Economic History of the U.S. Lecture 26.pdfThe Economic History of the U.S. Lecture 26.pdf
The Economic History of the U.S. Lecture 26.pdfGale Pooley
 
VIP Independent Call Girls in Andheri 🌹 9920725232 ( Call Me ) Mumbai Escorts...
VIP Independent Call Girls in Andheri 🌹 9920725232 ( Call Me ) Mumbai Escorts...VIP Independent Call Girls in Andheri 🌹 9920725232 ( Call Me ) Mumbai Escorts...
VIP Independent Call Girls in Andheri 🌹 9920725232 ( Call Me ) Mumbai Escorts...dipikadinghjn ( Why You Choose Us? ) Escorts
 
Basic concepts related to Financial modelling
Basic concepts related to Financial modellingBasic concepts related to Financial modelling
Basic concepts related to Financial modellingbaijup5
 

Dernier (20)

Stock Market Brief Deck (Under Pressure).pdf
Stock Market Brief Deck (Under Pressure).pdfStock Market Brief Deck (Under Pressure).pdf
Stock Market Brief Deck (Under Pressure).pdf
 
(INDIRA) Call Girl Mumbai Call Now 8250077686 Mumbai Escorts 24x7
(INDIRA) Call Girl Mumbai Call Now 8250077686 Mumbai Escorts 24x7(INDIRA) Call Girl Mumbai Call Now 8250077686 Mumbai Escorts 24x7
(INDIRA) Call Girl Mumbai Call Now 8250077686 Mumbai Escorts 24x7
 
CALL ON ➥8923113531 🔝Call Girls Gomti Nagar Lucknow best sexual service
CALL ON ➥8923113531 🔝Call Girls Gomti Nagar Lucknow best sexual serviceCALL ON ➥8923113531 🔝Call Girls Gomti Nagar Lucknow best sexual service
CALL ON ➥8923113531 🔝Call Girls Gomti Nagar Lucknow best sexual service
 
VIP Independent Call Girls in Bandra West 🌹 9920725232 ( Call Me ) Mumbai Esc...
VIP Independent Call Girls in Bandra West 🌹 9920725232 ( Call Me ) Mumbai Esc...VIP Independent Call Girls in Bandra West 🌹 9920725232 ( Call Me ) Mumbai Esc...
VIP Independent Call Girls in Bandra West 🌹 9920725232 ( Call Me ) Mumbai Esc...
 
(DIYA) Bhumkar Chowk Call Girls Just Call 7001035870 [ Cash on Delivery ] Pun...
(DIYA) Bhumkar Chowk Call Girls Just Call 7001035870 [ Cash on Delivery ] Pun...(DIYA) Bhumkar Chowk Call Girls Just Call 7001035870 [ Cash on Delivery ] Pun...
(DIYA) Bhumkar Chowk Call Girls Just Call 7001035870 [ Cash on Delivery ] Pun...
 
02_Fabio Colombo_Accenture_MeetupDora&Cybersecurity.pptx
02_Fabio Colombo_Accenture_MeetupDora&Cybersecurity.pptx02_Fabio Colombo_Accenture_MeetupDora&Cybersecurity.pptx
02_Fabio Colombo_Accenture_MeetupDora&Cybersecurity.pptx
 
Booking open Available Pune Call Girls Shivane 6297143586 Call Hot Indian Gi...
Booking open Available Pune Call Girls Shivane  6297143586 Call Hot Indian Gi...Booking open Available Pune Call Girls Shivane  6297143586 Call Hot Indian Gi...
Booking open Available Pune Call Girls Shivane 6297143586 Call Hot Indian Gi...
 
Vip Call US 📞 7738631006 ✅Call Girls In Sakinaka ( Mumbai )
Vip Call US 📞 7738631006 ✅Call Girls In Sakinaka ( Mumbai )Vip Call US 📞 7738631006 ✅Call Girls In Sakinaka ( Mumbai )
Vip Call US 📞 7738631006 ✅Call Girls In Sakinaka ( Mumbai )
 
VIP Call Girl Service Andheri West ⚡ 9920725232 What It Takes To Be The Best ...
VIP Call Girl Service Andheri West ⚡ 9920725232 What It Takes To Be The Best ...VIP Call Girl Service Andheri West ⚡ 9920725232 What It Takes To Be The Best ...
VIP Call Girl Service Andheri West ⚡ 9920725232 What It Takes To Be The Best ...
 
The Economic History of the U.S. Lecture 19.pdf
The Economic History of the U.S. Lecture 19.pdfThe Economic History of the U.S. Lecture 19.pdf
The Economic History of the U.S. Lecture 19.pdf
 
The Economic History of the U.S. Lecture 30.pdf
The Economic History of the U.S. Lecture 30.pdfThe Economic History of the U.S. Lecture 30.pdf
The Economic History of the U.S. Lecture 30.pdf
 
Veritas Interim Report 1 January–31 March 2024
Veritas Interim Report 1 January–31 March 2024Veritas Interim Report 1 January–31 March 2024
Veritas Interim Report 1 January–31 March 2024
 
Top Rated Pune Call Girls Viman Nagar ⟟ 6297143586 ⟟ Call Me For Genuine Sex...
Top Rated  Pune Call Girls Viman Nagar ⟟ 6297143586 ⟟ Call Me For Genuine Sex...Top Rated  Pune Call Girls Viman Nagar ⟟ 6297143586 ⟟ Call Me For Genuine Sex...
Top Rated Pune Call Girls Viman Nagar ⟟ 6297143586 ⟟ Call Me For Genuine Sex...
 
TEST BANK For Corporate Finance, 13th Edition By Stephen Ross, Randolph Weste...
TEST BANK For Corporate Finance, 13th Edition By Stephen Ross, Randolph Weste...TEST BANK For Corporate Finance, 13th Edition By Stephen Ross, Randolph Weste...
TEST BANK For Corporate Finance, 13th Edition By Stephen Ross, Randolph Weste...
 
High Class Call Girls Nashik Maya 7001305949 Independent Escort Service Nashik
High Class Call Girls Nashik Maya 7001305949 Independent Escort Service NashikHigh Class Call Girls Nashik Maya 7001305949 Independent Escort Service Nashik
High Class Call Girls Nashik Maya 7001305949 Independent Escort Service Nashik
 
VVIP Pune Call Girls Katraj (7001035870) Pune Escorts Nearby with Complete Sa...
VVIP Pune Call Girls Katraj (7001035870) Pune Escorts Nearby with Complete Sa...VVIP Pune Call Girls Katraj (7001035870) Pune Escorts Nearby with Complete Sa...
VVIP Pune Call Girls Katraj (7001035870) Pune Escorts Nearby with Complete Sa...
 
The Economic History of the U.S. Lecture 21.pdf
The Economic History of the U.S. Lecture 21.pdfThe Economic History of the U.S. Lecture 21.pdf
The Economic History of the U.S. Lecture 21.pdf
 
The Economic History of the U.S. Lecture 26.pdf
The Economic History of the U.S. Lecture 26.pdfThe Economic History of the U.S. Lecture 26.pdf
The Economic History of the U.S. Lecture 26.pdf
 
VIP Independent Call Girls in Andheri 🌹 9920725232 ( Call Me ) Mumbai Escorts...
VIP Independent Call Girls in Andheri 🌹 9920725232 ( Call Me ) Mumbai Escorts...VIP Independent Call Girls in Andheri 🌹 9920725232 ( Call Me ) Mumbai Escorts...
VIP Independent Call Girls in Andheri 🌹 9920725232 ( Call Me ) Mumbai Escorts...
 
Basic concepts related to Financial modelling
Basic concepts related to Financial modellingBasic concepts related to Financial modelling
Basic concepts related to Financial modelling
 

Etude PwC France "Global Economy Watch" (oct. 2014)

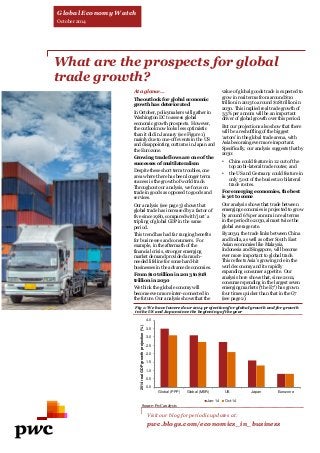
  • 1. What are the prospects for global trade growth? At a glance… The outlook for global economic growth has deteriorated In October, policymakers will gather in Washington DC to assess global economic growth prospects. However, the outlook now looks less optimistic than it did in January (see Figure 1), mainly due to one-off events in the US and disappointing outturns in Japan and the Eurozone. Growing trade flows are one of the successes of multilateralism Despite these short term troubles, one area where there has been longer term success is the growth of world trade. Throughout our analysis, we focus on trade in goods as opposed to goods and services. Our analysis (see page 3) shows that global trade has increased by a factor of five since 1980, compared with ‘just’ a tripling of global GDP in the same period. This trend has had far ranging benefits for businesses and consumers. For example, in the aftermath of the financial crisis, stronger emerging market demand provided a much- needed lifeline for some hard-hit businesses in the advanced economies. From $10 trillion in 2013 to $18 trillion in 2030 We think the global economy will become even more inter-connected in the future. Our analysis shows that the value of global goods trade is expected to grow in real terms from around $10 trillion in 2013 to around $18 trillion in 2030. This implied real trade growth of 3.3% per annum will be an important driver of global growth over this period. But our projections also show that there will be a reshuffling of the biggest ‘actors’ in the global trade arena, with Asia becoming ever more important. Specifically, our analysis suggests that by 2030: •China could feature in 12 out of the top 20 bi-lateral trade routes; and •the US and Germany could feature in only 5 out of the busiest 20 bilateral trade routes. For emerging economies, the best is yet to come Our analysis shows that trade between emerging economies is projected to grow by around 6% per annum in real terms in the period to 2030, almost twice the global average rate. By 2030, the trade links between China and India, as well as other South East Asian economies like Malaysia, Indonesia and Singapore, will become ever more important to global trade. This reflects Asia’s growing role in the world economy and its rapidly expanding consumer appetite. Our analysis here shows that, since 2012, consumer spending in the largest seven emerging markets (‘the E7’) has grown four times quicker than that in the G7 (see page 2). Visit our blog for periodic updates at: pwc.blogs.com/economics_in_business Fig 1: We have lowered our 2014 projections for global growth and for growth in the US and Japan since the beginning of the year Global Economy Watch October 2014 Source: PwC analysis 0.0 0.5 1.0 1.5 2.0 2.5 3.0 3.5 4.0 Global (PPP) Global (MER) US Japan Eurozone 2014 real GDP growth projection (%) Jan-14 Oct-14
  • 2. Economic update: The end is near for QE in the US QE likely to come to a halt at the end of October Since 2009, the Fed has expanded its balance sheet by purchasing around $3.7 trillion worth of mortgage-backed securities and US Treasury debt (see Figure 2). But this policy of quantitative easing (‘QE’) is likely to be brought to an end at the next meeting of the Federal Open Market Committee (FOMC) in late October. However, the Committee did keep the door open for further purchases in the event of unexpected developments in the labour market or around inflation. One step closer to normal monetary policy The likely end of QE is the first step in the Fed’s return to normal monetary policy, which will eventually involve raising interest rates and winding down its asset holdings. We see two key points coming out of the latest Fed guidance on this transition: •the FOMC do not expect to stop renewing maturing QE assets until after interest rates have begun to rise, which we expect to occur gradually from mid-2015 onwards assuming no major data surprises; and •the FOMC do not expect to sell mortgage-backed securities, suggesting that the Fed will hold this debt to maturity; this “gradual and predictable” approach should reduce the risk of a serious adverse impact on the market prices of these securities during the transition period. Fig 2: The Fed’s holding of mortgage-backed and Treasury securities has increased dramatically since 2009 What is the GCI? Consumer spending is the biggest component of the global economy and so a key driver of future growth. Our monthly updated Global Consumer Index (GCI) aims to provide an early steer on consumer spending and growth prospects in the world’s 20 largest economies. When it comes to giving an early steer on consumer spending trends, our GCI passes the test E7 consumers on a spending spree Focusing on the seven largest emerging economies in the world (the ‘E7’*), our analysis shows that, since 2012, consumption in these E7 markets has grown four times more quickly than in the G7 (see Figure 4). In absolute terms, consumer spending in the E7 remains significantly smaller compared to the G7. However, as economic activity continues to shift from the West to the East we expect this to have a positive knock-on impact on living standards in the E7, which will boost consumer demand there for a wide variety of products and services. Fig 3: The GCI has been a good indicator of trends in consumer spending Sources: PwC analysis, Datastream (correlation coefficient of +0.8) with actual consumer data sourced from national accounts (which only becomes available at a global level some months after the data used in our index). This is further reinforced by the fact that the Index has, on average, underestimated actual consumer spending by just 0.1 percentage points – a very small average margin of error. What trends are we seeing in the latest data? For the month of September, we expect consumption to grow by 2.9% (year- on-year) which is above the long-term rate of 2.7%. Even though this is a respectable growth rate it comes on the back of a rather abrupt slowdown in global consumption in the second quarter of 2014. This was partly attributed to the rise in consumption tax in Japan - the first such increase in 17 years. At the same time, we have continued to see disappointing growth in the Eurozone, which is dragging down global consumption. However, if the US and UK remain on a positive growth path this should act as a buffer against some of these more negative influences. Source: US Federal Reserve Fig 4: Real consumer spending has grown faster in the E7 than in the G7 Sources: PwC analysis, Datastream So how has our GCI been doing? Broadly speaking the GCI has been successful at tracking global consumer spending trends (see Figure 3). Our analysis of the numbers show that our index is strongly correlated 0% 2% 4% 6% 8% 10% 12% 14% G7 E7 % change in consumer spending 2012 Q1 - 2014 Q2 5.5 2.0 2014 Q2 consumer spending ($trn, 2010 prices) 0.0 0.5 1.0 1.5 2.0 2.5 3.0 2009 2010 2011 2012 2013 2014 Federal Reserve holdings (US$ trillion) Mortgage-backed securities US Treasury securities -2% -1% 0% 1% 2% 3% 4% 2004 Q1 2006 Q1 2008 Q1 2010 Q1 2012 Q1 2014 Q1 % change on a year earlier GCI Actual consumer spending *Brazil, Russia, India, China, Mexico, Turkey, Indonesia
  • 3. 0% 1% 2% 3% 4% 5% 6% 7% Advanced - Advanced Advanced - Emerging Emerging - Emerging Projected 2013-2030 CAGR of intra-group trade Where will the top goods trade routes be in 2030? Focusing on the bright side: Global trade One of the long-term successes of multilateralism has been the strengthening of trade flows across the global economy. Our analysis of IMF numbers shows that, since 1980, the volume of global trade has increased by a factor of five, compared with ‘just’ a tripling of global GDP over the same period (measured in purchasing power parity terms). This trend has been good news for businesses, especially those with a global footprint, which have the ability to cushion a down-turn in their home markets by switching their sales efforts to overseas markets. Historically, growth in trade was limited to a ‘closed club’ of Western economies. But successive rounds of GATT trade liberalisation talks and the subsequent establishment of the World Trade Organisation (WTO) in 1995 helped to expand trade on a global basis. Is this trend set to continue and, if so, which will be the busiest merchandise trade routes in 2030? Goods trade between advanced and emerging economies is projected to grow by around $4 trillion by 2030 Our estimate is that the total value of global goods trade will continue to grow from around $10.3 trillion in 2013 to around $18 trillion in 2030 (in constant 2013 US dollars) with trade between advanced and emerging markets accounting for almost half ($3.9 trillion) of this increase (see Figure 5). China, which is by far the largest emerging economy in the world, is expected to grab a bigger slice of the world’s top trade routes by 2030 because: •Chinese consumers are expected to buy more overseas goods as they become wealthier, so leading to higher imports; and •China will also remain a key player in manufacturing, although it is likely to move to higher valued exports (e.g. cars not textiles) as its relative wage costs get higher in line with increased capital investment and productivity. Brazil, India, Saudi Arabia and the UAE feature in the Top 20 Our analysis also shows that global trade is expected to enter a new phase in the next two decades, with intra-emerging-market trade growing at around 6% per annum (see Figure 5). Our analysis suggests that by 2030: •the China – India trade link will grow to become the world’s 7th largest trade route, exceeding the size of the Germany-US trade route; •resource rich economies like Brazil and Saudi Arabia are projected to take advantage of China’s appetite for natural resources and further strengthen their already strong trade links with China; and •trade links between China and other lower cost South East Asian economies (e.g. Indonesia) will intensify as Chinese companies look to take advantage of the relatively lower wages on offer in these markets. So what does this mean for businesses? We think there are two key things for businesses to consider in their future plans: 1.China is expected to reinforce its position as the major global goods trading hub. China’s lead over the US for the title of ‘most places in the top 20’ is expected to grow from 2 places in 2013 to 7 places in 2030, further evidence of economic power shifting from the West to the East. 2.The emergence of South East Asia as a centre for global trade will need to be accompanied by major infrastructure investments, particularly in transportation, to allow easier movement of goods to market. Ranking Bilateral trade pair Trade value (2013 US$ bn) 1 China US 491 2 China Japan 279 3 China South Korea 237 4 Germany France 225 5 Japan US 200 6 Germany US 165 7 China Germany 157 8 Germany UK 143 9 Germany Italy 134 10 China Australia 125 11 UK US 110 12 South Korea US 104 13 France Italy 96 14 China Singapore 94 15 Hong Kong US 92 16 Japan South Korea 91 17 China Brazil 82 18 Singapore Malaysia 82 19 UAE India 80 20 China Malaysia 77 Ranking Bilateral trade pair Projected trade value (2013 US$ bn) 1 u China US 716 2 u China Japan 390 3 u China South Korea 366 4 u Germany France 277 5 u Japan US 244 6 s China Germany 240 7 g China India 214 8 t Germany US 209 9 s China Singapore 208 10 u China Australia 205 11 s China Malaysia 189 12 g China Indonesia 179 13 t Germany UK 178 14 s China Brazil 165 15 g China Saudi Arabia 164 16 t Germany Italy 163 17 t Hong Kong US 146 18 g China UAE 144 19 t South Korea US 142 20 t UAE India 141 Table 1: Top 20 bilateral goods trade routes in 2013 Table 2: Top 20 bilateral goods trade routes in 2030 Assumptions underlying projections Our analysis above was based on an update of our previous research (Future of world trade: Top 25 sea and air freight routes in 2030). Our estimates are based on the following key assumptions: •national GDP growth rates follow those projected by the IMF in the World Economic Outlook report and our World in 2050 projections; •trade flows are based on merchandise exports to GDP ratios, which have been fixed at their long-term rates; and •we project how the destination of each country’s exports is expected to evolve over the period using a weighted average of current and future demand, which is driven by GDP growth. Our analysis is restricted to 29 major economies selected on the basis of their present size (GDP) and the expected growth rate of their trade flows. Fig 5: We expect goods trade between emerging markets to be the fastest growing bloc 2.3 3.9 1.4 2013-2030 difference in trade value ($trn) Note: For the purposes of compiling the tables, we have removed intra-European (with the exception of the 4 largest European economies), US-Canada and China-Hong Kong trade routes. Source: PwC analysis (countries categorised according to IMF country groups) Source: PwC analysis Source: PwC analysis u retains position; s moves up; t moves down; g new entrant
  • 4. Projections: October 2014 Sources: PwC analysis, National statistical authorities, Thomson Datastream and IMF. All inflation indicators relate to the Consumer Price Index (CPI), with the exception of the Indian indicator which refers to the Wholesale Price Index (WPI). Argentina's inflation projections use the IPCNu Index released by INDEC which is based in the fourth quarter of 2013 (therefore we do not provide a 2013 estimate). We will provide a 2016-2020 inflation projection once a longer time series of data is available. GDP projections for Argentina use the 2004 base year national account data (previously base year 1993). Our Nigeria GDP projections relate to the new rebased GDP figures but are subject to high margins of error. Also note that the tables above form our main scenario projections and are therefore subject to considerable uncertainties. We recommend that our clients look at a range of alternative scenarios. Interest rate outlook of major economies Current rate (Last change) Expectation Next meeting Federal Reserve 0-0.25% (December 2008) Rate to start to rise during the second half of 2015 28-29 October European Central Bank 0.05% (September 2014) Rates on hold following decrease in September 6 November Bank of England 0.5% (March 2009) Rate to rise gradually from late 2014 or early 2015 9 October Richard Boxshall T: +44 (0) 20 7213 2079 E: richard.boxshall@uk.pwc.com Conor Lambe T: +44 (0) 20 7212 8783 E: conor.r.lambe@uk.pwc.com Barret Kupelian T: + 44 (0) 20 7213 1579 E: barret.g.kupelian@uk.pwc.com The GCI is a monthly updated index providing an early steer on consumer spending and growth prospects in the world’s 20 largest economies. For more information, please visit www.pwc.co.uk/globalconsumerindex This publication has been prepared for general guidance on matters of interest only, and does not constitute professional advice. You should not act upon the information contained in this publication without obtaining specific professional advice. No representation or warranty (express or implied) is given as to the accuracy or completeness of the information contained in this publication, and, to the extent permitted by law, PricewaterhouseCoopers LLP, its members, employees and agents do not accept or assume any liability, responsibility or duty of care for any consequences of you or anyone else acting, or refraining to act, in reliance on the information contained in this publication or for any decision based on it. © 2014 PricewaterhouseCoopers LLP. All rights reserved. In this document, “PwC” refers to the UK member firm, and may sometimes refer to the PwC network. Each member firm is a separate legal entity. Please see www.pwc.com/structure for further details. We help you understand how big economic, demographic, social, and environmental changes affect your organisation by setting out scenarios that identify growth opportunities and risks on a global, regional, national and local level. We help make strategic and tactical operational, pricing and investment decisions to support business value creation. We work together with you to achieve sustainable growth. PwC’s Global Consumer Index Global consumer spending growth falls to 2.9% this month, the lowest rate since July 2013. Growth in the money supply has slowed while consumer confidence has fallen again this month. Energy commodity prices also fell, exerting downward pressure on the index. However, on a brighter note, industrial production grew strongly. 0.0% 0.5% 1.0% 1.5% 2.0% 2.5% 3.0% 3.5% 4.0% Oct-13 Nov-13 Dec-13 Jan-14 Feb-14 Mar-14 Apr-14 May-14 Jun-14 Jul-14 Aug-14 Sep-14 YoY growth Long-term growth 2.9% PPP*MER*20132014p2015p2016-2020p20132014p2015p2016-2020pGlobal (market exchange rates)100%2.52.73.13.22.32.72.82.6Global (PPP rates)100%3.03.13.63.6United States19.5%22.5%2.22.13.12.41.51.92.21.9China14.7%11.4%7.77.47.37.02.62.33.03.4Japan5.5%8.3%1.51.31.21.20.42.51.71.5United Kingdom2.8%3.4%1.73.02.62.42.61.71.92.0Eurozone13.5%16.9%-0.5 0.81.31.51.40.51.21.5France2.7%3.6%0.10.40.91.71.00.71.01.5Germany3.8%4.7%0.21.51.61.31.60.81.61.7Greece0.3%0.3%-3.9 0.21.83.0-0.9 -1.2 -0.3 1.3Ireland0.2%0.3%0.23.42.52.50.50.51.51.5Italy2.2%2.8%-1.8 -0.2 0.61.01.30.20.91.4Netherlands0.8%1.1%-0.7 0.81.52.02.60.91.21.4Portugal0.3%0.3%-1.0 0.91.61.80.40.00.61.5Spain1.7%1.8%-1.2 1.21.71.51.5-0.1 0.81.0Poland1.0%0.7%1.63.23.33.51.20.41.82.5Russia3.0%2.8%1.30.10.52.56.87.16.35.0Turkey1.3%1.1%4.12.83.84.57.58.87.04.8Australia1.2%2.1%2.43.22.83.12.22.62.62.7India5.7%2.6%4.75.26.56.56.35.65.96.0Indonesia1.4%1.2%5.85.25.86.36.46.25.95.1South Korea1.9%1.6%3.03.53.63.81.31.72.22.9Argentina0.9%0.7%2.9-1.6 0.63.3-25.025.0- Brazil2.8%3.1%2.30.51.54.06.26.25.44.8Canada1.8%2.5%2.02.22.52.21.02.01.82.1Mexico2.2%1.6%1.32.63.73.63.83.93.73.6South Africa0.7%0.5%1.91.62.53.85.86.25.64.8Nigeria0.5%0.4%5.56.36.25.78.58.58.67.3Saudi Arabia1.1%1.0%4.04.34.44.33.53.13.54.0Real GDP growthInflation Share of 2012 world GDP