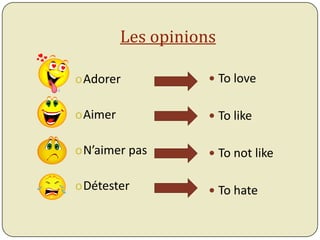
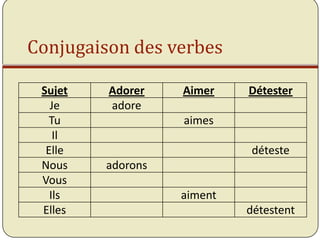
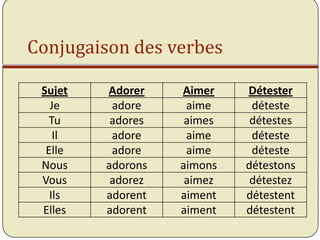
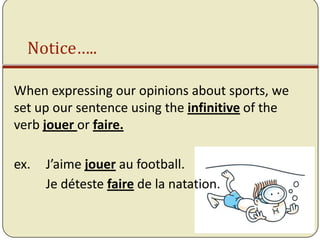
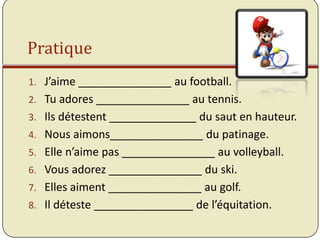
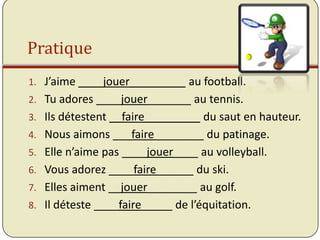
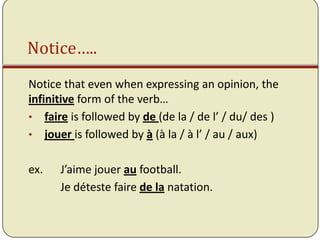
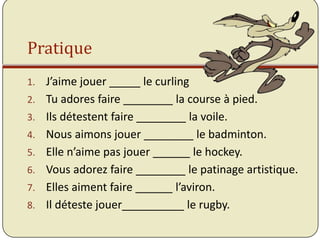
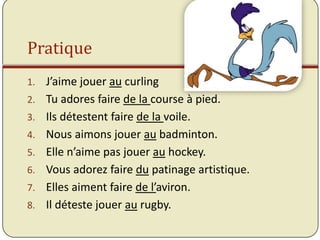
This review power point will help you review the major part for the exam. Of course, you also need to review all your vocabulary as well as your verbs we have studied.
This is a Power Point that I use in Unit 2 of my French 1 course. In this presentation, I use images and text to help my students acquire language to communicate their likes and dislikes or preferences as far as leisure activities, hobbies, and other activities in which they might engage on a daily/weekly basis.
This document discusses key concepts for historians in evaluating primary and secondary sources. It defines primary sources as those created during the time period being studied, and secondary sources as those created afterwards. When determining usefulness, reliability, and limitations, historians consider factors like the author, date, intended audience, message, and completeness of information. While primary sources have the advantage of being contemporaneous, both primary and secondary sources can be useful or unreliable depending on thorough analysis. The reliability of a source may also depend on balancing multiple perspectives.
Agriculture is a primary activity that involves growing crops and raising livestock. It requires significant amounts of water to produce common foods - 3 gallons for a serving of tomatoes, 6 gallons for french fries, and 1,300 gallons for a hamburger. There are different types of agriculture including subsistence farming where all outputs are consumed by the family, commercial farming where all outputs are sold in the market, and pastoral farming which is rearing animals. An agricultural system involves inputs like fertilizer and seeds which are processed through activities like plowing, sowing, and growing and eventually outputs are harvested.
This document summarizes a seminar on measurement education in the lower grades of primary school. It discusses the learning trajectory of measurement, which progresses from comparing to ordering, composing, pacing off, and reading instruments. The goal is for students to develop a sense of measurement through language, determining the appropriate measurement in different situations. Measurement lessons should use hands-on materials and activities to reinforce concepts, and allow students to work individually and in groups. Examples of learning activities include measuring tables, designing storybooks with measurement concepts, and using image books and posters.
This document provides information on various coastal landforms and erosion processes. It defines key terms like headlands, bays, fetch, corrasion, deposition, longshore drift, backwash, attrition, hydraulic action, and corrosion. It also matches these terms to their meanings. The document discusses how differing rock properties lead to different coastal landform shapes. It specifically examines how headlands, cliffs, and wave-cut platforms are formed through erosion processes acting on resistant and weak rocks over time.
This document provides an overview of different types of spatial information and maps. It discusses aerial photographs, orthophoto maps, topographic maps, and their key differences. Topographic maps show terrain and elevation using contours, trigonometric stations, spot heights and bench marks. They also use conventional signs and colors to represent natural and human landscape features. The document then covers map scales, latitude and longitude, coordinate systems, and techniques for determining direction and converting distances on maps.
The document discusses scales used in engineering drawings. It defines scale as the ratio between the dimensions on a drawing and the actual dimensions of an object. Scales can be represented by a ratio like 1cm = 1m or a representative fraction like 1/100. There are three types of scales: reducing, full, and enlarging. Plain and diagonal scales are used to accurately measure distances on drawings. Examples are given of how to construct various scales meeting given specifications, such as units of measurement, accuracy, and range of distances.
The document discusses different types of scales used in technical drawings. It explains reducing and enlarging scales used to adjust dimensions of large and small objects to fit on a standard drawing sheet. Representative fraction is the ratio of drawing dimension to actual dimension. Formulas are provided to calculate representative fraction, length, area, and volume based on the scale. Common scales include plain, diagonal, vernier, and comparative scales. Examples are given to illustrate how to construct and use plain and diagonal scales to accurately represent distances and dimensions.
This document discusses several key concepts for understanding maps, including:
1) Scale refers to the ratio of distance on a map to distance on the ground, such as 1:50,000 where 1cm equals 500m.
2) Location can be specified using grid references or latitude and longitude coordinates.
3) Relief shows elevation and slope using techniques like spot heights, contours, and hill shading. Gradient can also be calculated from contour maps.
4) The key or legend provides information to interpret map symbols which may differ between maps from different countries.
This document discusses building techniques for construction in cold climates. The main objectives are resisting heat loss and promoting heat gain. To resist heat loss, buildings should decrease exposed surface area and use insulating materials. To promote heat gain, buildings should maximize sunlight exposure and trap heat from the sun. Specific techniques discussed include orienting buildings on south-facing slopes, clustering buildings to reduce wind, using wide east-west oriented streets, and designing windows, walls, roofs, and colors to minimize heat loss and maximize solar heat gain. A case study of buildings in Leh, India demonstrates these cold climate construction methods.
1. The document provides instructions and explanations for various mapwork calculations including distance, gradient, area, speed/time, coordinates, bearing, declination, cross sections, scale conversion, and landforms.
2. It explains how to calculate distance, gradient, area, speed, coordinates, bearing, declination, cross sections, and how to convert between word and fractional scales. Diagrams are provided to illustrate concepts like cross sections, declination, and landforms.
3. The document serves as a comprehensive guide for students to learn how to perform various geometric and spatial calculations required for topographic mapwork.
The document discusses various weather and climate concepts including:
- Weather is the current atmospheric conditions while climate is the average weather over time.
- High pressure systems are associated with clear skies and dry conditions while low pressure systems bring clouds and rain.
- Weather maps use lines of equal pressure (isobars) and symbols to show wind speed and direction helping predict future conditions.
The document discusses how to measure gradient, which is the rate of change of a slope. It explains that gradient is calculated by taking the difference in vertical height divided by the horizontal distance, with both measurements converted to the same scale, typically meters. An example is provided of a gradient of 1:20, meaning that for every 20 meters traveled horizontally, there is a 1 meter increase in elevation, representing a small slope.
Bearings are used to indicate direction and are more precise than compass points. They are always measured clockwise from North. To measure the bearing from point A to point B, mark and draw the North line at A, measure the angle to B clockwise from North, and record it as a three-digit figure. The bearing of B from A will be different than the bearing of A from B, as the measurement is taken from the location and clockwise direction indicated.
The document provides information about rivers and coasts for a GCSE Geography revision pack. It includes key terms, landforms, and processes related to rivers and coasts, as well as case studies on river and coastal management. Resources for further study are also listed.
This document provides revision materials for a GCSE Geography exam on key themes. It includes information on the exam structure, resources for revision, and details on the three exam sections: natural hazards, population and settlement, and economic development. For the economic development section, it outlines different industry types and changes over time, as well as case studies on topics like goat aid and Coca-Cola. Various practice exam questions are provided at the end related to development indicators, the Brandt line, and Rostow's model of development stages.
The document discusses how to measure and describe gradients on maps and in the field. It explains that gradient measures the steepness of a slope by calculating the rise over the run between two points. An example calculation is shown where the rise is 42 meters and the run is 600 meters, resulting in a gradient of 1 in 14.3. This means that for every 14.3 meters traveled along the ground, one would go up one meter, indicating a gentle slope. The document asks the reader to consider how gradient relates to land use and hazards like bushfires.
The wind directions are:
A. Easterly Light
B. Southerly Moderate
C. Westerly Gentle
D. Northerly Fresh
E. Variable Light and variable
F. Calm Calm
G. Southerly to southwesterly Fresh
The strongest wind is D. Northerly - Fresh
The weakest wind is F. Calm
Acc0101. Meaning and Scope of AccountingCPT Success
Accounting involves recording, classifying, summarizing, analyzing, interpreting and communicating financial transactions and events. It includes journal entries, a ledger, a trial balance, income statements, balance sheets, and cash flow statements. The results are used by internal managers and external parties like investors, lenders, and government agencies. Accounting provides information for decision making, compares performance over time, identifies weaknesses for control, and supplies data for taxes and regulation.
This summarizes a document describing the 2010 eruption of the Eyjafjallajokull volcano in Iceland. It began by locating Iceland on the Mid-Atlantic Ridge where the Eurasian and North American tectonic plates are diverging. The causes of the eruption were explained as magma rising to the surface due to plate movement. The effects in Iceland were minor, but the ash cloud spread over Europe, grounding flights and costing airlines billions. Measures to manage volcanic hazards in Iceland focus on evacuations and monitoring, which helped minimize loss of life during this eruption.
The document discusses map scales. It defines three types of scales: stated scale, linear scale, and ratio scale. It explains how to convert between ratio scales and stated scales using the metric system and decimal places. It provides examples of calculating distances on maps using cross-multiplication and five steps: find the ratio scale, convert to stated scale, measure map distance, use cross-multiplication, and write a conclusion statement. Finally, it describes the difference between large scale and small scale maps in terms of the level of detail shown and area covered.
The document discusses climatology and considerations for building design based on climate. It covers different climate types such as hot and dry, hot and humid, and warm humid and provides recommendations for each. These include using high ceilings and narrow lanes for hot dry climates, and sloped roofs, broad eaves and ventilation for hot humid areas. It also discusses building orientation, with south, south-east and south-west generally preferred. The best directions for rooms like bedrooms and living rooms are outlined. Factors like insulation, fenestration, ventilation and solar control are important to thermal building performance.
This document discusses reflexive verbs in French. It explains that reflexive verbs show that the subject is performing the action on itself. It provides examples of common reflexive verbs like se baigner, which means "to bathe." It then discusses how to conjugate reflexive verbs, including changing the reflexive pronoun to agree with the subject and conjugating the infinitive verb form. It also covers placing the reflexive pronoun and exceptions, negative forms of reflexive verbs, and notes that many reflexive verbs can also be used non-reflexively with a change in meaning.
This document discusses determining common multiples and common factors of numbers. It explains that the common multiples of two numbers are the multiples that are shared between the two lists of all their individual multiples. The least common multiple is the smallest number that is a multiple of both numbers. It also explains that common factors are factors that two numbers have in common, and these can be determined by making lists of all the factors of each number and looking for the ones they share. A Venn diagram can also be used to visualize common factors between two numbers.
Divisibility refers to whether a number can be divided by another number without a remainder. A number is divisible by another number if when you divide them, the result is a whole number. The document then provides rules for determining if a number is divisible by 2, 3, 5, 6, 8, 9, 10, and 4. It explains that you cannot divide by 0 because there is no number that when multiplied by 0 equals the original number.
There are eight cardinal directions that can be expanded to include intermediate directions like southeast and northwest. Occasionally sixteen directions are used, or bearings measured in degrees from 0 to 360 can specify an exact direction. Magnetic compasses and protractors are tools used to determine directions and calculate bearings, although GPS is more commonly used today.
Maps represent 3D landscapes in 2D, which can make it difficult to depict elevation changes. There are two main ways maps show 3D terrain: profile views and contour maps. Contour maps take a 3D landscape and represent it with 2D contour lines that connect points of equal elevation. The closer the lines are together, the steeper the slope; lines farther apart indicate flatter land. Contour maps provide detailed elevation information and allow inferences about landscape shapes and slopes.
1. The document describes changes in job sectors and economies as nations progress from agricultural to industrial to service-based.
2. It then focuses on the agricultural revolution, which involved adopting bigger farms through enclosures and land reclamation, better equipment like mechanized plows and reapers, and improved techniques like crop rotation and selective breeding.
3. These changes dramatically increased food production and lowered costs, fueling population growth and freeing many farmers to seek work in cities as agriculture became more industrialized.
The royal family tried to escape France but was caught. This led to the creation of a new constitution and Legislative Assembly with power shared between the king and assembly. Internal divisions grew between moderate and radical groups as the war went badly. Radicals took control in Paris, declared a republic and executed the king and queen. The Reign of Terror followed under Robespierre until his own fall from power. The government transitioned to the Directory and then the Consulate before Napoleon declared himself Emperor.
The document summarizes the social and political structure of France prior to the French Revolution, known as the Old Regime. Under this system, French society was rigidly divided into three estates - clergy, nobility, and commoners. The nobility and clergy comprised only a small portion of the population but held most of the wealth and political power. Growing economic problems and resentment of the privileges of the higher estates led to calls for reform and eventually sparked the French Revolution.
Napoleon Bonaparte rose to power in France during the French Revolution. He established himself as the Emperor of France and expanded French territory across Europe through military conquest. At the height of his power, Napoleon controlled a vast empire stretching from France to Russia. However, his invasion of Russia in 1812 proved disastrous and marked the beginning of his decline in power. After being defeated at the Battle of Waterloo in 1815, Napoleon was exiled to St. Helena, where he died in 1821. His reign significantly influenced the development of nationalism and the modernization of legal codes across Europe.
This document provides guidance for judges at a debate tournament. It explains that judges are to watch debates, score individual speakers, record the winning team, and provide feedback. It outlines the formats and styles of debates, including cross-examination and CNDF styles. It describes what judges should evaluate in their scoring, such as organization, evidence, rebuttal, delivery, and questioning. Judges are advised to remain impartial and consistent in their scoring.
Geography Skills - Thematic Maps & Climate Tim Bonnar
Maps represent areas of the Earth's surface and provide information like place names, land features, and boundaries. Maps usually have North at the top and use symbols in legends to label features clearly. There are physical maps of natural areas and political maps of borders. Thematic maps focus on specific themes like climate, vegetation, or population. Modern maps use satellite data to be highly accurate.
The document outlines the five key themes of geography: (1) Location, (2) Place, (3) Human-Environment Interaction, (4) Movement, and (5) Regions. Location refers to where places are located and their absolute and relative positions. Place examines the physical and human characteristics of locations. Human-Environment Interaction considers how humans impact and are impacted by their environments. Movement discusses how people, goods, and ideas flow between places. Regions looks at how the world can be divided into defined areas based on various characteristics.
1) Jacques Cartier explored the Maritimes and St. Lawrence River in the 1530s and 1540s, claiming land for France and founding settlements that ultimately failed.
2) Samuel de Champlain founded Quebec City in 1608, establishing the first permanent French colony in New France.
3) New France grew slowly due to its system of seigneurial land grants and the Company of One Hundred Associates' focus on the fur trade over settlement.
4) France lost New France after its defeat in the Seven Years' War, ceding the territory to Britain in the 1763 Treaty of Paris.
Formation M2i - Onboarding réussi - les clés pour intégrer efficacement vos n...M2i Formation
Améliorez l'intégration de vos nouveaux collaborateurs grâce à notre formation flash sur l'onboarding. Découvrez des stratégies éprouvées et des outils pratiques pour transformer l'intégration en une expérience fluide et efficace, et faire de chaque nouvelle recrue un atout pour vos équipes.
Les points abordés lors de la formation :
- Les fondamentaux d'un onboarding réussi
- Les outils et stratégies pour un onboarding efficace
- L'engagement et la culture d'entreprise
- L'onboarding continu et l'amélioration continue
Formation offerte animée à distance avec notre expert Eric Collin
Newsletter SPW Agriculture en province du Luxembourg du 12-06-24BenotGeorges3
Les informations et évènements agricoles en province du Luxembourg et en Wallonie susceptibles de vous intéresser et diffusés par le SPW Agriculture, Direction de la Recherche et du Développement, Service extérieur de Libramont.
Le fichier :
Les newsletters : https://agriculture.wallonie.be/home/recherche-developpement/acteurs-du-developpement-et-de-la-vulgarisation/les-services-exterieurs-de-la-direction-de-la-recherche-et-du-developpement/newsletters-des-services-exterieurs-de-la-vulgarisation/newsletters-du-se-de-libramont.html
Bonne lecture et bienvenue aux activités proposées.
#Agriculture #Wallonie #Newsletter #Recherche #Développement #Vulgarisation #Evènement #Information #Formation #Innovation #Législation #PAC #SPW #ServicepublicdeWallonie
Impact des Critères Environnementaux, Sociaux et de Gouvernance (ESG) sur les...mrelmejri
J'ai réalisé ce projet pour obtenir mon diplôme en licence en sciences de gestion, spécialité management, à l'ISCAE Manouba. Au cours de mon stage chez Attijari Bank, j'ai été particulièrement intéressé par l'impact des critères Environnementaux, Sociaux et de Gouvernance (ESG) sur les décisions d'investissement dans le secteur bancaire. Cette étude explore comment ces critères influencent les stratégies et les choix d'investissement des banques.
Conseils pour Les Jeunes | Conseils de La Vie| Conseil de La JeunesseOscar Smith
Besoin des conseils pour les Jeunes ? Le document suivant est plein des conseils de la Vie ! C’est vraiment un document conseil de la jeunesse que tout jeune devrait consulter.
Voir version video:
➡https://youtu.be/7ED4uTW0x1I
Sur la chaine:👇
👉https://youtube.com/@kbgestiondeprojets
Aimeriez-vous donc…
-réussir quand on est jeune ?
-avoir de meilleurs conseils pour réussir jeune ?
- qu’on vous offre des conseils de la vie ?
Ce document est une ressource qui met en évidence deux obstacles qui empêchent les jeunes de mener une vie épanouie : l'inaction et le pessimisme.
1) Découvrez comment l'inaction, c'est-à-dire le fait de ne pas agir ou d'agir alors qu'on le devrait ou qu'on est censé le faire, est un obstacle à une vie épanouie ;
> Comment l'inaction affecte-t-elle l'avenir du jeune ? Que devraient plutôt faire les jeunes pour se racheter et récupérer ce qui leur appartient ? A découvrir dans le document ;
2) Le pessimisme, c'est douter de tout ! Les jeunes doutent que la génération plus âgée ne soit jamais orientée vers la bonne volonté. Les jeunes se sentent toujours mal à l'aise face à la ruse et la volonté politique de la génération plus âgée ! Cet état de doute extrême empêche les jeunes de découvrir les opportunités offertes par les politiques et les dispositifs en faveur de la jeunesse. Voulez-vous en savoir plus sur ces opportunités que la plupart des jeunes ne découvrent pas à cause de leur pessimisme ? Consultez cette ressource gratuite et profitez-en !
En rapport avec les " conseils pour les jeunes, " cette ressource peut aussi aider les internautes cherchant :
➡les conseils pratiques pour les jeunes
➡conseils pour réussir
➡jeune investisseur conseil
➡comment investir son argent quand on est jeune
➡conseils d'écriture jeunes auteurs
➡conseils pour les jeunes auteurs
➡comment aller vers les jeunes
➡conseil des jeunes citoyens
➡les conseils municipaux des jeunes
➡conseils municipaux des jeunes
➡conseil des jeunes en mairie
➡qui sont les jeunes
➡projet pour les jeunes
➡conseil des jeunes paris
➡infos pour les jeunes
➡conseils pour les jeunes
➡Quels sont les bienfaits de la jeunesse ?
➡Quels sont les 3 qualités de la jeunesse ?
➡Comment gérer les problèmes des adolescents ?
➡les conseils de jeunes
➡guide de conseils de jeunes
Cycle de Formation Théâtrale 2024 / 2025Billy DEYLORD
Pour la Saison 2024 / 2025, l'association « Le Bateau Ivre » propose un Cycle de formation théâtrale pour particuliers amateurs et professionnels des arts de la scène enfants, adolescents et adultes à l'Espace Saint-Jean de Melun (77). 108 heures de formation, d’octobre 2024 à juin 2025, à travers trois cours hebdomadaires (« Pierrot ou la science de la Scène », « Montage de spectacles », « Le Mime et son Répertoire ») et un stage annuel « Tournez dans un film de cinéma muet ».
2. Les opinions
oAdorer To love
oAimer To like
oN’aimer pas To not like
oDétester To hate
3. Conjugaison des verbes
Sujet Adorer Aimer Détester
Je adore
Tu aimes
Il
Elle déteste
Nous adorons
Vous
Ils aiment
Elles détestent
4. Conjugaison des verbes
Sujet Adorer Aimer Détester
Je adore aime déteste
Tu adores aimes détestes
Il adore aime déteste
Elle adore aime déteste
Nous adorons aimons détestons
Vous adorez aimez détestez
Ils adorent aiment détestent
Elles adorent aiment détestent
5. Notice…..
When expressing our opinions about sports, we
set up our sentence using the infinitive of the
verb jouer or faire.
ex. J’aime jouer au football.
Je déteste faire de la natation.
6. Pratique
1. J’aime _______________ au football.
2. Tu adores _______________ au tennis.
3. Ils détestent ______________ du saut en hauteur.
4. Nous aimons_______________ du patinage.
5. Elle n’aime pas _______________ au volleyball.
6. Vous adorez _______________ du ski.
7. Elles aiment _______________ au golf.
8. Il déteste ________________ de l’équitation.
7. Pratique
1. J’aime ____jouer_________ au football.
2. Tu adores ____jouer_______ au tennis.
3. Ils détestent __faire_________ du saut en hauteur.
4. Nous aimons ___faire________ du patinage.
5. Elle n’aime pas ____jouer____ au volleyball.
6. Vous adorez ____faire______ du ski.
7. Elles aiment __jouer________ au golf.
8. Il déteste ____faire_____ de l’équitation.
8. Notice…..
Notice that even when expressing an opinion, the
infinitive form of the verb…
• faire is followed by de (de la / de l’ / du/ des )
• jouer is followed by à (à la / à l’ / au / aux)
ex. J’aime jouer au football.
Je déteste faire de la natation.
9. Pratique
1. J’aime jouer _____ le curling
2. Tu adores faire ________ la course à pied.
3. Ils détestent faire ________ la voile.
4. Nous aimons jouer ________ le badminton.
5. Elle n’aime pas jouer ______ le hockey.
6. Vous adorez faire ________ le patinage artistique.
7. Elles aiment faire ______ l’aviron.
8. Il déteste jouer__________ le rugby.
10. Pratique
1. J’aime jouer au curling
2. Tu adores faire de la course à pied.
3. Ils détestent faire de la voile.
4. Nous aimons jouer au badminton.
5. Elle n’aime pas jouer au hockey.
6. Vous adorez faire du patinage artistique.
7. Elles aiment faire de l’aviron.
8. Il déteste jouer au rugby.