SlideShare une entreprise Scribd logo
1  sur  10
Convergence limitée de la composition des régimes alimentaires
Quantités consommées par habitant (en calories)
0
500
1000
1500
2000
2500
3000
3500
4000
2020-22 2032 2020-22 2032 2020-22 2032 2020-22 2032 2020-22 2032 2020-22 2032 2020-22 2032 2020-22 2032
Monde Amérique du
Nord
Amérique latine
et Caraïbes
Europe et Asie
centrale
Proche-Orient et
Afrique du Nord
Asie développée
et de l’Est
Asie du Sud et
du Sud-Est
Afrique subsah.
kcal/jour/hab Aliments de base Produits d'origine animale Graisses Edulcorants Fruits et légumes Autres
Différences persistantes entre les groupes de revenus dans la composition
des sources de protéines pour la consommation alimentaire
0
10
20
30
40
50
60
70
0
20
40
60
80
100
120
2020-22 2032 2020-22 2032 2020-22 2032 2020-22 2032
Pays à revenu élevé Pays à revenu intermédiaire
supérieur
Pays à revenu intermédiaire de
la tranche inférieure
Pays à revenu faible
%
g/hab/jour Aliments de base Autres produits végétaux Viande Produits laitiers Oeuf Poisson % de protéines animales dans la disponibilité totale en protéines (axe de droite)
0.00
0.50
1.00
1.50
2.00
2.50
3.00
3.50
4.00
Pays à revenu élevé Pays à revenu intermédiaire de
la tranche supérieure
Pays à revenu intermédiaire de
la tranche inférieure
Pays à faible revenu
% p.a. Non-ruminants Aquaculture Ruminants Lait Alim. animale
L'augmentation de l'efficacité de la production se traduit par une croissance lente de
l'utilisation d'aliments pour animaux
Évolution annuelle de l'utilisation des aliments pour animaux et de la production animale,
2023-2032
Des taux de mélange et des mandats plus élevés pour accroître l'utilisation des biocarburants dans les principaux
pays consommateurs, alors que la demande de carburant pour les transports diminue et que les incitations
politiques à la réduire sont réduites dans d'autres pays.
0
5
10
15
20
25
30
35
2010-12 à 2020-22 2020-22 à 2032 2010-12 à 2020-22 2020-22 à 2032
Ethanol Biodiesel
Mrd L Brésil États-Unis Union européenne Chine Inde Indonésie Autres
Les pays à revenu intermédiaire et à faible revenu continueront à tirer
la croissance de la production agricole mondiale
0
5
10
15
20
25
30
35
0
100
200
300
400
500
600
700
800
2020-22 2032 2020-22 2032 2020-22 2032 2020-22 2032 2020-22 2032 2020-22 2032 2020-22 2032 2020-22 2032
Inde Chine Asie-Pacifique
(hors Chine et
Inde)
Afrique subsah. Proche-Orient et
Afrique du Nord
Europe et Asie
Centrale
Amérique du Nord Amérique latine
et Caraïbes
%
Milliards USD de 2014-16
Produits végétaux Bétail Poisson Croissance de la production, 2020-22 à 2032 (axe de droite)
La production végétale doit être stimulée par des améliorations de la
productivité plutôt que par l'expansion de l'utilisation des terres
-100
0
100
200
300
400
500
600
-20
-10
0
10
20
30
40
50
2013-22 2023-32 2013-22 2023-32 2013-22 2023-32 2013-22 2023-32 2013-22 2023-32 2013-22 2023-32
Asie pacifique Afrique subsah. Proche-Orient et
Afrique du Nord
Europe et Asie
Centrale
Amérique du Nord Amérique latine et
Caraïbes
Mha
%
Croissance de l'utilisation des terres Croissance des terres à cultures multiples
Croissance des rendements Superficie récoltée en 2032 (axe de droite)
La flambée des prix des intrants agricoles
suscite des inquiétudes quant à la sécurité alimentaire mondiale
Une augmentation de 1 % des prix des engrais entraînerait une hausse de 0,2 % des prix des
produits de base
0
2
4
6
8
10
12
Moyenne
Moyenne
Blé
Maïs
Autres
céréales
second.
Riz
Soja
Autres
oléagineux
Huiles
végétales
Tourteaux
protéiques
Sucre
Coton
Viande
de
volaille
Viande
porcine
Viande
bovine
Viande
ovine
Beurre
Fromage
Lait
entier
en
poudre
Céréales Oléagineux Viande Produits laitiers
%
L'intensité en carbone de la production agricole devrait diminuer
Évolution annuelle de la production agricole et des émissions directes de GES, 2023 à 2032
0.0
0.5
1.0
1.5
2.0
2.5
Asie pacifique Afrique subsah. Proche-Orient et
Afrique du Nord
Europe et Asie
Centrale
Amérique du Nord Amérique latine et
Caraïbes
% p.a. Croissance de la production agricole Augmentation des émissions de GES
Différenciation croissante entre les régions exportatrices nettes et les régions importatrices nettes
Commerce net par région, en valeur constante
-120
-70
-20
30
80
Amérique
du Nord
Amérique latine et
Caraïbes
Europe et Asie
Centrale
Asie du Sud et du
Sud-Est
Afrique
subsaharienne
Proche-Orient et
Afrique du Nord
Asie développée
et de l’Est
Mrd USD 2000-02 2010-12 2020-22 2032
Les prix réels des produits de base agricoles devraient continuer à
baisser en raison de l'augmentation de la productivité
0
50
100
150
200
250
300
350
400
450
500
1960
1962
1964
1966
1968
1970
1972
1974
1976
1978
1980
1982
1984
1986
1988
1990
1992
1994
1996
1998
2000
2002
2004
2006
2008
2010
2012
2014
2016
2018
2020
2022
2024
2026
2028
2030
2032
(2019=100)
Soja Blé Maïs Viande bovine Viande porcine

Contenu connexe

En vedette

2024 State of Marketing Report – by Hubspot
2024 State of Marketing Report – by Hubspot2024 State of Marketing Report – by Hubspot
2024 State of Marketing Report – by HubspotMarius Sescu
 
Everything You Need To Know About ChatGPT
Everything You Need To Know About ChatGPTEverything You Need To Know About ChatGPT
Everything You Need To Know About ChatGPTExpeed Software
 
Product Design Trends in 2024 | Teenage Engineerings
Product Design Trends in 2024 | Teenage EngineeringsProduct Design Trends in 2024 | Teenage Engineerings
Product Design Trends in 2024 | Teenage EngineeringsPixeldarts
 
How Race, Age and Gender Shape Attitudes Towards Mental Health
How Race, Age and Gender Shape Attitudes Towards Mental HealthHow Race, Age and Gender Shape Attitudes Towards Mental Health
How Race, Age and Gender Shape Attitudes Towards Mental HealthThinkNow
 
AI Trends in Creative Operations 2024 by Artwork Flow.pdf
AI Trends in Creative Operations 2024 by Artwork Flow.pdfAI Trends in Creative Operations 2024 by Artwork Flow.pdf
AI Trends in Creative Operations 2024 by Artwork Flow.pdfmarketingartwork
 
PEPSICO Presentation to CAGNY Conference Feb 2024
PEPSICO Presentation to CAGNY Conference Feb 2024PEPSICO Presentation to CAGNY Conference Feb 2024
PEPSICO Presentation to CAGNY Conference Feb 2024Neil Kimberley
 
Content Methodology: A Best Practices Report (Webinar)
Content Methodology: A Best Practices Report (Webinar)Content Methodology: A Best Practices Report (Webinar)
Content Methodology: A Best Practices Report (Webinar)contently
 
How to Prepare For a Successful Job Search for 2024
How to Prepare For a Successful Job Search for 2024How to Prepare For a Successful Job Search for 2024
How to Prepare For a Successful Job Search for 2024Albert Qian
 
Social Media Marketing Trends 2024 // The Global Indie Insights
Social Media Marketing Trends 2024 // The Global Indie InsightsSocial Media Marketing Trends 2024 // The Global Indie Insights
Social Media Marketing Trends 2024 // The Global Indie InsightsKurio // The Social Media Age(ncy)
 
Trends In Paid Search: Navigating The Digital Landscape In 2024
Trends In Paid Search: Navigating The Digital Landscape In 2024Trends In Paid Search: Navigating The Digital Landscape In 2024
Trends In Paid Search: Navigating The Digital Landscape In 2024Search Engine Journal
 
5 Public speaking tips from TED - Visualized summary
5 Public speaking tips from TED - Visualized summary5 Public speaking tips from TED - Visualized summary
5 Public speaking tips from TED - Visualized summarySpeakerHub
 
ChatGPT and the Future of Work - Clark Boyd
ChatGPT and the Future of Work - Clark Boyd ChatGPT and the Future of Work - Clark Boyd
ChatGPT and the Future of Work - Clark Boyd Clark Boyd
 
Getting into the tech field. what next
Getting into the tech field. what next Getting into the tech field. what next
Getting into the tech field. what next Tessa Mero
 
Google's Just Not That Into You: Understanding Core Updates & Search Intent
Google's Just Not That Into You: Understanding Core Updates & Search IntentGoogle's Just Not That Into You: Understanding Core Updates & Search Intent
Google's Just Not That Into You: Understanding Core Updates & Search IntentLily Ray
 
Time Management & Productivity - Best Practices
Time Management & Productivity -  Best PracticesTime Management & Productivity -  Best Practices
Time Management & Productivity - Best PracticesVit Horky
 
The six step guide to practical project management
The six step guide to practical project managementThe six step guide to practical project management
The six step guide to practical project managementMindGenius
 
Beginners Guide to TikTok for Search - Rachel Pearson - We are Tilt __ Bright...
Beginners Guide to TikTok for Search - Rachel Pearson - We are Tilt __ Bright...Beginners Guide to TikTok for Search - Rachel Pearson - We are Tilt __ Bright...
Beginners Guide to TikTok for Search - Rachel Pearson - We are Tilt __ Bright...RachelPearson36
 

En vedette (20)

2024 State of Marketing Report – by Hubspot
2024 State of Marketing Report – by Hubspot2024 State of Marketing Report – by Hubspot
2024 State of Marketing Report – by Hubspot
 
Everything You Need To Know About ChatGPT
Everything You Need To Know About ChatGPTEverything You Need To Know About ChatGPT
Everything You Need To Know About ChatGPT
 
Product Design Trends in 2024 | Teenage Engineerings
Product Design Trends in 2024 | Teenage EngineeringsProduct Design Trends in 2024 | Teenage Engineerings
Product Design Trends in 2024 | Teenage Engineerings
 
How Race, Age and Gender Shape Attitudes Towards Mental Health
How Race, Age and Gender Shape Attitudes Towards Mental HealthHow Race, Age and Gender Shape Attitudes Towards Mental Health
How Race, Age and Gender Shape Attitudes Towards Mental Health
 
AI Trends in Creative Operations 2024 by Artwork Flow.pdf
AI Trends in Creative Operations 2024 by Artwork Flow.pdfAI Trends in Creative Operations 2024 by Artwork Flow.pdf
AI Trends in Creative Operations 2024 by Artwork Flow.pdf
 
Skeleton Culture Code
Skeleton Culture CodeSkeleton Culture Code
Skeleton Culture Code
 
PEPSICO Presentation to CAGNY Conference Feb 2024
PEPSICO Presentation to CAGNY Conference Feb 2024PEPSICO Presentation to CAGNY Conference Feb 2024
PEPSICO Presentation to CAGNY Conference Feb 2024
 
Content Methodology: A Best Practices Report (Webinar)
Content Methodology: A Best Practices Report (Webinar)Content Methodology: A Best Practices Report (Webinar)
Content Methodology: A Best Practices Report (Webinar)
 
How to Prepare For a Successful Job Search for 2024
How to Prepare For a Successful Job Search for 2024How to Prepare For a Successful Job Search for 2024
How to Prepare For a Successful Job Search for 2024
 
Social Media Marketing Trends 2024 // The Global Indie Insights
Social Media Marketing Trends 2024 // The Global Indie InsightsSocial Media Marketing Trends 2024 // The Global Indie Insights
Social Media Marketing Trends 2024 // The Global Indie Insights
 
Trends In Paid Search: Navigating The Digital Landscape In 2024
Trends In Paid Search: Navigating The Digital Landscape In 2024Trends In Paid Search: Navigating The Digital Landscape In 2024
Trends In Paid Search: Navigating The Digital Landscape In 2024
 
5 Public speaking tips from TED - Visualized summary
5 Public speaking tips from TED - Visualized summary5 Public speaking tips from TED - Visualized summary
5 Public speaking tips from TED - Visualized summary
 
ChatGPT and the Future of Work - Clark Boyd
ChatGPT and the Future of Work - Clark Boyd ChatGPT and the Future of Work - Clark Boyd
ChatGPT and the Future of Work - Clark Boyd
 
Getting into the tech field. what next
Getting into the tech field. what next Getting into the tech field. what next
Getting into the tech field. what next
 
Google's Just Not That Into You: Understanding Core Updates & Search Intent
Google's Just Not That Into You: Understanding Core Updates & Search IntentGoogle's Just Not That Into You: Understanding Core Updates & Search Intent
Google's Just Not That Into You: Understanding Core Updates & Search Intent
 
How to have difficult conversations
How to have difficult conversations How to have difficult conversations
How to have difficult conversations
 
Introduction to Data Science
Introduction to Data ScienceIntroduction to Data Science
Introduction to Data Science
 
Time Management & Productivity - Best Practices
Time Management & Productivity -  Best PracticesTime Management & Productivity -  Best Practices
Time Management & Productivity - Best Practices
 
The six step guide to practical project management
The six step guide to practical project managementThe six step guide to practical project management
The six step guide to practical project management
 
Beginners Guide to TikTok for Search - Rachel Pearson - We are Tilt __ Bright...
Beginners Guide to TikTok for Search - Rachel Pearson - We are Tilt __ Bright...Beginners Guide to TikTok for Search - Rachel Pearson - We are Tilt __ Bright...
Beginners Guide to TikTok for Search - Rachel Pearson - We are Tilt __ Bright...
 

Perspectives agricoles de l'OCDE et de la FAO 2023-2032

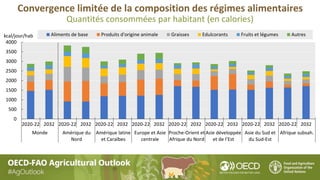
  • 1. Convergence limitée de la composition des régimes alimentaires Quantités consommées par habitant (en calories) 0 500 1000 1500 2000 2500 3000 3500 4000 2020-22 2032 2020-22 2032 2020-22 2032 2020-22 2032 2020-22 2032 2020-22 2032 2020-22 2032 2020-22 2032 Monde Amérique du Nord Amérique latine et Caraïbes Europe et Asie centrale Proche-Orient et Afrique du Nord Asie développée et de l’Est Asie du Sud et du Sud-Est Afrique subsah. kcal/jour/hab Aliments de base Produits d'origine animale Graisses Edulcorants Fruits et légumes Autres
  • 2. Différences persistantes entre les groupes de revenus dans la composition des sources de protéines pour la consommation alimentaire 0 10 20 30 40 50 60 70 0 20 40 60 80 100 120 2020-22 2032 2020-22 2032 2020-22 2032 2020-22 2032 Pays à revenu élevé Pays à revenu intermédiaire supérieur Pays à revenu intermédiaire de la tranche inférieure Pays à revenu faible % g/hab/jour Aliments de base Autres produits végétaux Viande Produits laitiers Oeuf Poisson % de protéines animales dans la disponibilité totale en protéines (axe de droite)
  • 3. 0.00 0.50 1.00 1.50 2.00 2.50 3.00 3.50 4.00 Pays à revenu élevé Pays à revenu intermédiaire de la tranche supérieure Pays à revenu intermédiaire de la tranche inférieure Pays à faible revenu % p.a. Non-ruminants Aquaculture Ruminants Lait Alim. animale L'augmentation de l'efficacité de la production se traduit par une croissance lente de l'utilisation d'aliments pour animaux Évolution annuelle de l'utilisation des aliments pour animaux et de la production animale, 2023-2032
  • 4. Des taux de mélange et des mandats plus élevés pour accroître l'utilisation des biocarburants dans les principaux pays consommateurs, alors que la demande de carburant pour les transports diminue et que les incitations politiques à la réduire sont réduites dans d'autres pays. 0 5 10 15 20 25 30 35 2010-12 à 2020-22 2020-22 à 2032 2010-12 à 2020-22 2020-22 à 2032 Ethanol Biodiesel Mrd L Brésil États-Unis Union européenne Chine Inde Indonésie Autres
  • 5. Les pays à revenu intermédiaire et à faible revenu continueront à tirer la croissance de la production agricole mondiale 0 5 10 15 20 25 30 35 0 100 200 300 400 500 600 700 800 2020-22 2032 2020-22 2032 2020-22 2032 2020-22 2032 2020-22 2032 2020-22 2032 2020-22 2032 2020-22 2032 Inde Chine Asie-Pacifique (hors Chine et Inde) Afrique subsah. Proche-Orient et Afrique du Nord Europe et Asie Centrale Amérique du Nord Amérique latine et Caraïbes % Milliards USD de 2014-16 Produits végétaux Bétail Poisson Croissance de la production, 2020-22 à 2032 (axe de droite)
  • 6. La production végétale doit être stimulée par des améliorations de la productivité plutôt que par l'expansion de l'utilisation des terres -100 0 100 200 300 400 500 600 -20 -10 0 10 20 30 40 50 2013-22 2023-32 2013-22 2023-32 2013-22 2023-32 2013-22 2023-32 2013-22 2023-32 2013-22 2023-32 Asie pacifique Afrique subsah. Proche-Orient et Afrique du Nord Europe et Asie Centrale Amérique du Nord Amérique latine et Caraïbes Mha % Croissance de l'utilisation des terres Croissance des terres à cultures multiples Croissance des rendements Superficie récoltée en 2032 (axe de droite)
  • 7. La flambée des prix des intrants agricoles suscite des inquiétudes quant à la sécurité alimentaire mondiale Une augmentation de 1 % des prix des engrais entraînerait une hausse de 0,2 % des prix des produits de base 0 2 4 6 8 10 12 Moyenne Moyenne Blé Maïs Autres céréales second. Riz Soja Autres oléagineux Huiles végétales Tourteaux protéiques Sucre Coton Viande de volaille Viande porcine Viande bovine Viande ovine Beurre Fromage Lait entier en poudre Céréales Oléagineux Viande Produits laitiers %
  • 8. L'intensité en carbone de la production agricole devrait diminuer Évolution annuelle de la production agricole et des émissions directes de GES, 2023 à 2032 0.0 0.5 1.0 1.5 2.0 2.5 Asie pacifique Afrique subsah. Proche-Orient et Afrique du Nord Europe et Asie Centrale Amérique du Nord Amérique latine et Caraïbes % p.a. Croissance de la production agricole Augmentation des émissions de GES
  • 9. Différenciation croissante entre les régions exportatrices nettes et les régions importatrices nettes Commerce net par région, en valeur constante -120 -70 -20 30 80 Amérique du Nord Amérique latine et Caraïbes Europe et Asie Centrale Asie du Sud et du Sud-Est Afrique subsaharienne Proche-Orient et Afrique du Nord Asie développée et de l’Est Mrd USD 2000-02 2010-12 2020-22 2032
  • 10. Les prix réels des produits de base agricoles devraient continuer à baisser en raison de l'augmentation de la productivité 0 50 100 150 200 250 300 350 400 450 500 1960 1962 1964 1966 1968 1970 1972 1974 1976 1978 1980 1982 1984 1986 1988 1990 1992 1994 1996 1998 2000 2002 2004 2006 2008 2010 2012 2014 2016 2018 2020 2022 2024 2026 2028 2030 2032 (2019=100) Soja Blé Maïs Viande bovine Viande porcine

Notes de l'éditeur

  1. Note: The population growth component is calculated assuming per capita demand remains constant at the level of the year preceding the decade. Growth rates refer to total demand (for food, feed and other uses).
  2. Staples include cereals, pulses, and roots and tubers.
  3. Note: Ruminants include beef and veal and sheepmeat. Non-ruminants include poultry and pigmeat. The bars show annual changes in production volumes for the different livestock products. The black line shows annual changes in feed use.
  4. Feed to production ratio Note: This ratio includes only feed prepared from cereals, oilseeds and a number of by-products, it therefore slightly overestimates the feed efficiency of the livestock and aquaculture sector. Pasture-based cattle and sheep convert feed that cannot be accessed directly by humans into meat and milk. Similarly, pigs and poultry are still being raised on organic residues in non-commercial operations. Simple forms of aquaculture rely solely on naturally available feed. Because the nutritional value of these feed sources is difficult to quantify, it is excluded from the above calculation.
  5. Note: Estimates are based on historical time series from the FAOSTAT Value of Agricultural Production domain which are extended with the Outlook database. Remaining products are trend-extended. The Net Value of Production uses own estimates for internal seed and feed use. Values are measured at constant USD of the period 2014-2016.
  6. Note: Figure shows the decomposition of total production growth (2012-21 and 2022-31) into growth in land use, land intensification through growth in multi-cropped land, and growth in yields. It covers the following crops: cotton, maize, other coarse grains, other oilseeds, pulses, rice, roots and tubers, soybean, sugarbeet, sugarcane, wheat and palm oil.
  7. This figure shows projected annual growth in direct GHG emissions from agriculture together with annual growth in the estimated net value of production of crop and livestock commodities covered in the Outlook (measured in constant USD 2014-16 prices). Estimates are based on historical time series from the FAOSTAT Emissions Agriculture databases which are extended with the Outlook database. CO2 equivalents are calculated using the global warming potential of each gas as reported in the IPCC Sixth Assessment Report (AR6). Emission types that are not related to any Outlook variable (organic soil cultivation and burning Savannahs) are kept constant at their latest available value. The category ''other'' includes direct GHG emissions from burning crop residues, burning savanna, crop residues, and cultivation of organic soils. The Net Value of Production uses own estimates for internal seed and feed use.
  8. Note: Net trade (exports minus imports) of commodities covered in the Agricultural Outlook, measured in constant 2014-16 USD. Net trade figures include intra regional trade but exclude intra-EU trade. The regions Developed and East Asia, and South and South East Asia are defined as in Chapter 2.
  9. Historical data for soybeans, maize and beef from World Bank, "World Commodity Price Data" (1960-1989). Historical data for pork from USDA QuickStats (1960-1989).