1. 2009 AACR abstract# 5211
Jiaqiang Huang*, Bo Song, Raymond K. Blanchard, Yan Xiang, Xiujing Gu, Siu Lan Lee, George Quellhorst, Xiao Zeng. SABiosciences Corporation. 6951 Executive Way, Suite 100, Frederick, MD 21703
Abstract
ChampionChIP-qPCR Array for Stem Cells Research
Reliability of the ChampionChIP System
25.0%
GAPDH
RPL30
ALDOA
20.0%
SAT2
Sata
IGX1A
MYOD1
SERPINA1
Active Gene
A
Heterochromatic
Region
Inactive Gene
B
Induction of P19 Differeciation
Day
Growth factor, Drug, Retinoic Acid (RA)
Somatic
Cells
Drug
(TSA/AzaC)
10.0%
RA (1µM)
µ
Oct4, Sox2, Nanog, Klf4
RA (1µM)
µ
0
Multiple transcription factor genes for coordinately modulating cell identity & fate
5.0%
2
Developmental & Differentiated
Genes
4
PluripotencyAssociated Genes
0.0%
H3ac
H3K4me3
H3K27me3
RT-qPCR Array
RT-qPCR Array
15.0%
Pluripotent
Cells
Epigenetic Alternation
H3K9me3
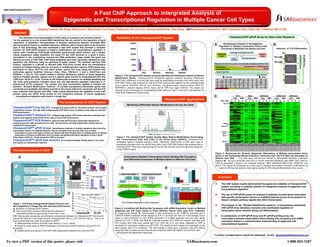
Figure 2. The ChampionChIP System Correctly Identifies the Distribution Pattern of Histone
Modification Marks. ChampionChIP Antibodies against modified histones (H3K4me3,
H3K27me3, H3K9me3) or control IgG were used for precipitating chromatin from HeLa cells. Each
ChIP DNA fraction was analyzed by real-time PCR using primers specific for the transcriptionally
active genes (GAPDH, RPL30 and ALDOA), transcriptionally inactive genes (MYO-D,
SERPINA1), silenced repeats (SAT2, Satα) and an ORF-free region (IGX1A). The results are
reported as the percentage of co-precipitating DNA relative to input (± one S.D.) and represent at
least three independent experiments.
6
Gene Expression
ChIP DNA
Abl1
Ar
Brca1
Cdx2
Fos
Foxa2
Foxc1
Foxp3
Hif1a
Hmga2
Hoxb1
Hoxb4
Msx2
Myb
Myc
Myf5
Pax4
Pax6
Pcna
Pml
Smad2
Smad3
Smad4
Sox1
Tcf3
Tcfe2a
Tead1
Tert
Conrol 1 Conrol 2 Conrol 3 Conrol 4
C
ChampionChIP Applications
RA+ Day
The Components of ChIP System
0
mRNA
Cebpa
Gata1
Irf6
Myst3
Pou5f1
Sox17
Trp53
Conrol 5
Dnmt3b
Egfr
Egr3
Gata2
Gata4
Gata6
Isl1
Jak2
Jun
Nanog Neurod1 Nfkb1
Pparg
Rac1
Rara
Sox2
Sox9
Sp1
Vdr
Wrn
Wt1
Conrol 6 Conrol 7 Conrol 8
Esr1
Gbx2
Lif
Nfya
Rb1
Stat1
Xpa
PPC
Ets1
Gcm1
Lig4
Nr2e1
Runx1
Stat3
Xpc
PPC
Ets2
Gli2
Mapk1
Nr2e3
Runx2
T
Zic3
PPC
Ezh2
Hand1
Mitf
Olig2
Sfpi1
Tbx5
Myod1
8
PPC
Pol 2
H3ac
H3K4me3
H3K27me3
H3K9me3
P19
MEF
P19
MEF
P19
MEF
P19
MEF
P19
MEF
4 8 0 0 4 8 0 0 4 8 0 0 4 8 0
0 4 8 0
DlX1
Monitoring Differential Histone Modifications Across Any Gene
ChampionChIPTM One-Day
Simultaneous Analysis of the Epigenetic
Regulation of Multiple Transcription Factors that
Coordinate to Modulate Cell Identity and Fate
ChIP-qPCR Array
The chromatin immunoprecipitation (ChIP) assay is a powerful and versatile method
for the analysis of in vivo protein/DNA interactions that are central to the regulation of gene
expression. A systematic characterization of dynamic interactions between chromatin DNA
and transcription factors or modified histones in different cells or tissue types is the long-term
goal of this technology. We have developed a fast ChIP system that provides a complete
solution for ChIP-qPCR analysis of histone modifications and transcriptional regulation in
cancer cells. Combining ChIP-Grade antibodies, genome-wide qPCR primers, and a simple,
robust preparation assay simplifies the usual 2-5 day ChIP protocol to a quick 6 hours.
Innovations in the crosslinking reversal and DNA purification steps enable the quick and
efficient recovery of ChIP DNA. ChIP-Grade antibodies have been rigorously validated for their
specificity and efficiency using an optimized IP buffer system. The validated real-time PCR
primers, organized in a 96-well or 384-well plate PCR Array format, allow the simultaneous
analysis of multiple binding sites on one gene or multiple genomic regions. ChIP assays were
performed on HeLa, HCT116, and other human cancer cell lines using this system with
antibodies against modified histones (H3ac, H4ac, H3K4me1, 2 and 3, H3K27me3 and
H3K9me1, 2 and 3). The results verified a distinct distribution pattern of these epigenetic
marks at multiple genomic regions and at a specific gene around its transcriptional start site
(TSS) from -20 kb to +10 kb. A study of p53 binding site occupancy on multiple apoptosis and
cell cycle gene promoters indicates tissue and cell type-specific regulated responses to 5fluorouracil (5-FU) treatment. The system was also successfully applied to analyze the
dynamic “Bivalent Modification Patterns” of multiple pluripotency-associated genes that
coordinate and modulate cell identity and fate in the mouse embryonic carcinoma cell line P19
upon induction with retinoic acid (RA). These results demonstrate the capability of this ChIP
system using the qPCR Array format for the integrative analysis of cancer epigenetic
transcriptional regulation performed in a single day.
Kit
A simple and robust ChIP kit. The entire protocol can be easily
completed in 6 hours. The high yield of high-quality ChIP DNA is free of inhibitors and ready for real-time
PCR quantification.
ChampionChIPTM Antibody Kit
Validated high-quality ChIP-Grade antibodies combined with
positive and negative control PCR primer sets to insure ChIP performance.
ChampionChIPTM PCR Primers
Genome-wide qPCR primers specifically designed for
analyzing genomic DNA enrichment from ChIP. The specificity and high amplification efficiencies are
validated and guaranteed.
Nanog
Neurod1
ChampionChIPTM qPCR Arrays
Simultaneous analysis of multiple regulatory sites bound by
transcription factors, or modified histones. The two available array formats allow you to study:
• Association of your transcription factors of interest with their binding sites on multiple genes of interest.
• Association of histone modification and chromatin remodelling with gene regulation across a 30-kb
tiling region (-20 kb to +10 kb) around the TSS of any gene
ChampionChIPTM qPCR Data Analysis
Excel-based template. Simply paste in your data,
and results are automatically reported.
The Improvements in ChIP
A
B
bp
Figure 3. The ChampionChIP System Quickly Maps Histone Modifications Surrounding
the Transcriptional Start Site (TSS) of the Active Gene CDKN1A. ChampionChIP
Antibodies against modified histones (H3Ac, H3K4me2, H3K27me3), or NIS were used to
precipitate chromatin from one million HeLa cells. Each ChIP DNA fraction was analyzed with a
ChampionChIP Tiling Array representing 30 one-kb tile intervals across the genomic sequence
of the CDKN1A gene.
Ct
29
GAPDH
CDKN1A
28
27
26
1,000
A
ChampionChIP
Gene
Symbol
Pou5f1
Nanog
Sox2
Neurod1
Dlx1
Zfpm2
B
Control: vehicle (DMSO)
Control IgG
E
Gene Expression Profiling
( p53 Pathway RT-qPCR Assay )
ChampionChIP
ChIP-qPCR Array profiling
( p53 Pathway )
EZ ChIP
C
p53 Occupancy
(ChIP-qPCR Array)
No.
p53 Regulated Genes
IP Pol 2
Input
Day 8
0.12%
0.03%
0.40%
0.13%
0.22%
0.46%
Mef
Day 0
0.08%
0.10%
0.05%
0.04%
0.33%
0.22%
Day 0
25.98%
8.37%
13.06%
1.61%
4.84%
10.60%
H3ac
P19
Day 4
Day 8
0.55%
0.88%
0.27%
0.50%
5.07%
8.15%
0.62%
0.60%
1.13%
2.98%
6.35% 16.78%
Mef
Day 0
0.12%
0.04%
0.06%
0.00%
1.01%
1.97%
H3K4me3
P19
Day 0
Day 4
Day 8
21.69% 0.26%
0.15%
11.13% 0.22%
0.17%
14.30% 8.68%
9.97%
3.44%
1.87%
1.56%
9.37%
5.76%
6.62%
17.60% 13.25% 19.82%
Mef
Day 0
0.07%
0.05%
0.04%
0.08%
4.42%
9.77%
Day 0
0.04%
0.02%
1.19%
5.02%
3.35%
1.17%
H3K27me3
P19
Day 4
Day 8
3.00%
3.98%
1.81%
1.49%
2.31%
2.25%
5.36%
4.27%
5.44%
3.22%
0.67%
0.20%
Mef
Day 0
0.12%
0.00%
0.01%
0.24%
0.14%
0.00%
Day 0
0.32%
0.09%
0.37%
0.18%
0.20%
0.21%
H3K9me3
P19
Day 4
Day 8
0.00%
0.97%
0.00%
0.75%
0.00%
0.58%
0.00%
0.60%
0.00%
0.35%
0.00%
0.31%
Mef
Day 0
0.01%
0.03%
1.18%
0.23%
-0.01%
0.03%
Biological
triplicates
Ct
36
2
Summary
{
3.5%
2.5%
1: 1kb ladder
2: Chromatin cells before sonication 1.5%
3: Chromatin after reversal
crosslinking and DNA extraction 0.5%
4: Chromatin before reversal
crosslinking and DNA extraction 0.5%
Pol
P19
Day 4
0.01%
0.02%
0.23%
0.21%
0.15%
0.20%
Treated: 300 µM 5-Fluorouracil
4.5%
Pol 2
Day 0
0.89%
0.29%
0.84%
0.22%
0.31%
0.24%
EZ ChIP
D
500
Zfpm2
Figure 5. Monitoring the Dynamic Epigenetic Alternations at Multiple transcription factor
Genes in the Pluripontent Mouse Embryonic Carcinoma Cell Line P19 Upon the Inducation of
Retinoic Acid (RA).
P19 cells were cutured and induced to differentiate following a standard
protocol (B). 20 µg of chromatin from P19 or mouse embryonic fibroblast cells (MEF) were used for
ChIP as described in Figure 2 for modified histones: H3ac, H3K4me3,H3K27me3, H3K9me3, and
poly 2. The results are presented as a heat map to compare the bivalent chromatin modifications on
a panel of 84 key transcription factor genes during the RA-induced differentiation time course.
Concordance Between Transcription Factor Binding Site Occupancy
and Differential Expression of Multiple Genes in Different Cell Lines
C
1 2 3 4
Pou5f1
/Oct4
Sox2
IP p53
p53 Targeted Genes
Control IgG
34
32
30
28
Figure 1: The Entire ChampionChIP System Protocol Can
Be Completed in A Single Day with Improved Performance. 26
24
A. Workflow of ChampionChIP System.
22
1
2
4
8
1
2
4
8
B. Fast cross-linking reversal method permits analysis of
ChampionChIP
EZ ChIP
sonicated samples by agraose gel in less than 1 hour.
C-E. Side-by-side consistency and efficiency comparisons between the ChampionChIP One-Day Kit
and the EZ ChIP Kit. Final eluted volume: ChampionChIP (200 µL), EZ ChIP Kit (100 µL). Two µL of
each purified DNA was used as template for qPCR.
C: Reproducibility of HeLa chromatin input fraction (1 %) Ct values.
D: Signal-to-noise ratios for RNA Polymerase II enrichment at GAPD promoter (20 µg HCT116
chromatin)
E. Relative purity and quality of the ChIP DNA preparations measured by real-time PCR.
The Correlated Regulation of Gene Expression
µL
Gene Symbol
TFBS
( kb )
Fold >2.5
1
2
4
5
6
7
8
9
BAX
CDKN1A
MDM2
PPM1D
SESN2
TNFRSF10B
BRCA1
PRKCA
+1
-2
+1
+1
+1
+1
+2
-2
4.77
3.16
4.34
2.10
4.41
4.44
1.02
1.12
Down
No Change
The ChIP system results demonstrate the speed and reliability of ChampionChIP
system, providing a complete solution for integrative analysis of epigenetic and
transcriptional regulation.
mRNA
(RT-qPCR Array)
P value
P value
Fold >1.5
< 0.1
<0.05
0.00
0.05
0.09
0.05
0.02
0.03
0.98
0.63
1.60
6.11
4.75
2.63
3.59
1.82
-1.63
-1.54
0.0017
0.0000
0.0000
0.0007
0.0000
0.0002
0.0002
0.0102
The use of ChIP-qPCR arrays for analysis of pathway-focused genes associated
with specific transcription factors or modified histones proves to be powerful to
dissect complex pathway signals that affect transcription.
UP
The analysis of the “Bivalent Modification patterns” of pluripotency-associated
ChIP-qPCR array indicates a dynamic and coordinated regulation of
transcription factor network during cell differentiation.
Figure 4. Correlating p53 Binding Site Occupancy with mRNA Expression Levels on Multiple
Apoptosis and Cell Cycle Genes in Three Different Cancer Cells upon 5-FU Treatment.
A. Experimental Design. B. Fold-changes in p53 enrichment on the CDNK1A promoter and in
CDKN1A mRNA expression levels induced by 5-FU in all three cell lines. C. Fold-changes and pvalues in p53 enrichment on and mRNA expression of multiple apoptosis and cell cycle genes
induced by 5-FU in A549 cells. B & C. Triplicate samples from A549 and HepG2 (wild-type p53)
PC3 (mutant p53) cells were treated with 5-FU (300 µM, 6 h), and either subjected to ChIP or
harvested for expression analysis by qRT-PCR. The results of both assays are expressed as the
fold-increase upon 5-FU treatment. The fold-changes in both gene expression and p53 binding
along with their p-values are summarized and compared. A549 and HepG2, but not PC3, cells
demonstrate p53-dependent responses.
In combination of ChIP-qPCR array and RT-qPCR profiling array, the
concordance between transcription factor binding site occupancy and mRNA
expression delivers a comprehensive understanding of epigenetic and
transcriptional regulation.
* To whom correspondence should be addressed. E-mail: jqhuang@sSAbiosciences.com
To view a PDF version of this poster, please visit http://SABiosciences.com/support_posters.php
SABiosciences.com
1-888-503-3187