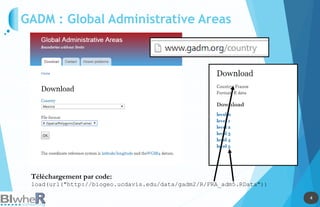
Le document traite de l'utilisation des outils cartographiques et de la statistique spatiale dans R, incluant des sources de données comme GADM et OpenStreetMap. Il explique les différentes représentations cartographiques, la création de données spatiales et les statistiques spatiales via diverses méthodes. Enfin, il aborde l'application de modèles spatiaux et des contraintes liées à l'analyse des données.


![17
17
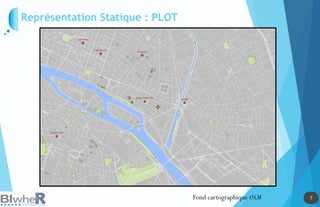
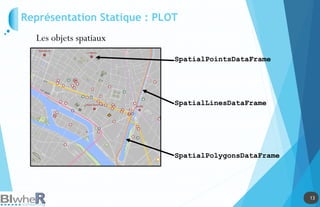
Représentation Statique : PLOT
Génération de SpatialPointsDataFrame La fonction pave [pgirmess]](https://image.slidesharecdn.com/20140618-raddictspdf-140722130022-phpapp02/85/Outils-cartographiques-et-en-statistique-spatiale-sur-R-17-320.jpg)
![18
18
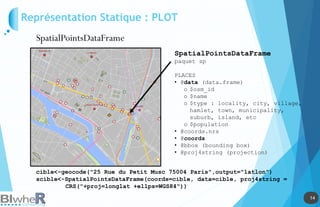
Représentation Statique : PLOT
Génération de SpatialPointsDataFrame La fonction pave [pgirmess]](https://image.slidesharecdn.com/20140618-raddictspdf-140722130022-phpapp02/85/Outils-cartographiques-et-en-statistique-spatiale-sur-R-18-320.jpg)
![19
19
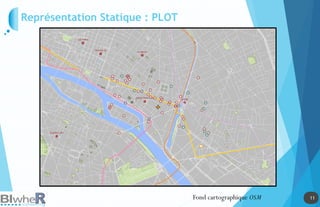
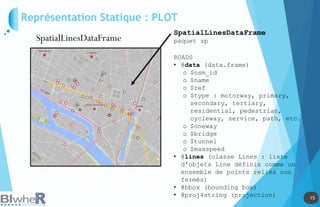
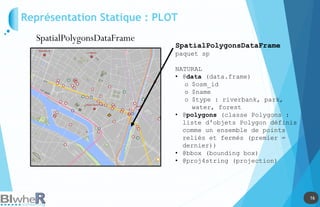
Représentation Statique : PLOT
Lien parmi SpatialPolygonsDataFrame, SpatialLinesDataFrame et
SpatialPointsDataFrame
Lien parmi les objets spatiaux La fonction over [sp]](https://image.slidesharecdn.com/20140618-raddictspdf-140722130022-phpapp02/85/Outils-cartographiques-et-en-statistique-spatiale-sur-R-19-320.jpg)