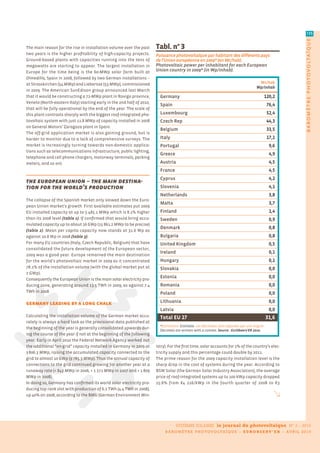
128
photovoltaic b arometer


                          Juwi


                                 Centrale terrestre de
                                 Mehringer Höhe (Allemagne),
                                 3,5 MWc de puissance.
                                   e r er ö e 3.5-  p
                                 c p c t ro  -b se po er
                                 p t Ger       .


 SYSTÈMES SOLAIRES               le journal du photovoltaïque          N° 3 – 2010
 P H O T OV O L T A I C B A R O M E T E R – E U R O B S E R V ’ E R – A P R I L 2 0 1 0
15 861,2 MWc/MWp                                                                                   129


                                                                                                                                           b aromètre photovoltaïque
                                                            dans l’UE/in the EU


BaroMètrE
PHotoVoLtaÏQUE
PHoToVoLTAIC
bAromETEr

Une étude réalisée par EurObserv’ER. st          c rr e o t b E rObser ’E .


   e marché mondial du photovoltaïque a                       heglobalphotovoltaicmarketexpanded
Lcontinuésaprogressionen2009.L’ondede Tagainin2009.Germanysetanewsystem
chocgénéréeparleverrouillagedumarchéibé-               installationrecordwhilethecapacitybuild-up
riqueapuêtrecontenuegrâceàunnouveau                   ofthemajorsolarphotovoltaicmarketscon-
record d’installation en allemagne et par la            tainedthefalloutgeneratedbytheIberian
montée en puissance des nouveaux grands                  marketderailment.TheEuropeanUnionhas
marchés du solaire photovoltaïque. L’Union                thehighestphotovoltaicplantcapacity,with
européenneresteleprincipallieud’implanta-                almost5.5GWpinstalledin2009.
tiondescentralesphotovoltaïques,avecprès
de5,5GWcinstallésdurantl’année2009.


 78,1 %
 de la puissance installée dans le monde
                                           +5485,1 MWc/MWp
                                           installés dans l’UE durant l’année 2009
                                                                                       +52,9 %
                                                                                             croissance du parc de l’UE
        en 2009 l’ont été dans l’UE             additional capacity installed                    entre 2008 et 2009
   of the 2009 world installed capacity             in the EU during 2009                 growth of the EU installed base
              was in the EU                                                                   between 2008 and 2009


                                                            SYSTÈMES SOLAIRES        le journal du photovoltaïque                N° 3 – 2010
                                                     B A R O M È T R E P H O T OV O L T A Ï Q U E – E U R O B S E R V ’ E R – A V R I L 2 0 1 0
130
photovoltaic b arometer


                                 es premières estimations des princi-       l’énergie (AIE PVPS) à celles récemment deux installations allemandes, celle de

                          L      paux marchés mondiaux du photo-
                                 voltaïque établissent une puissance
                          supplémentaire de l’ordre de 7 GWc, soit
                                                                            publiées par l’Epia (Association de l’in- Strasskirchen (54 MWc) et celle de Lieberose
                                                                            dustrie photovoltaïque européenne), le (53 MWc), mises en service en 2009. Le grou-
                                                                            marché japonais passerait de 225,3 à 484 pe américain SunEdison a même annoncé
                          une croissance de l’ordre de 16,6 % par rap-      MWc et celui des États-                                     en mars dernier la construc-
                          port à 2008 (6 GWc). Ce chiffre reste provi-      Unis de 338 à 475 MWc, soit Le marché chinois               tion d’une centrale de 72
                          soire et pourrait être consolidé à la hausse      respectivement les troisiè- devrait atteindre au            MWc dans la province ita-
                          dans les prochains mois. Pour cette même          me et quatrième marchés moins 500 MWc en 2010.              lienne de Rovigo en Vénétie
                          raison, le niveau d’installation de 2008 est      mondiaux. Le marché chi- The Chinese market                 (nord-est de l’Italie). La
                          nettement supérieur à celui annoncé dans          nois est également très should rise to at least             construction commencera
                          notre précédent baromètre (Systèmes               prometteur. Le CREIA (Chi- 500 MWp in 2010.                 au début du second se-
                          Solaires, Le Journal du Photovoltaïque n° 1).     nese Renewable Energy                                       mestre 2010 et sera pleine-
                          La plus forte consolidation vient d’Alle-         Industries Association, Association des ment opérationnelle en fin d’année. Par
                          magne, où l’Agence fédérale du réseau             industries chinoises des énergies renou- comparaison, la plus grande centrale pho-
                          (Bundesnetzagentur) a, pour la première           velables) estime ce marché à 215 MWc en tovoltaïque sur toiture, installée en 2008 sur
                          fois, publié un historique précis des rac-        2009. Il devrait, selon cette même source, l’usine de General Motors à Saragosse, en
                          cordements photovoltaïques bénéficiant            atteindre au moins 500 MWc en 2010, et Espagne, atteint 11,8 MWc de puissance.
                          de la loi énergies renouvelables (EEG).           peut-être même dépasser le GWc.               Le marché des applications non reliées au
                          La croissance mondiale enregistrée en             La forte augmentation du volume d’instal- réseau progresse également, mais il est
                          2009 sera cependant plus faible qu’en             lation réalisée ces deux dernières années plus difficile à mesurer faute d’études
                          2008, année où le marché avait plus que           s’explique principalement par une hausse exhaustives. Ce marché est de plus en plus
                          doublé par rapport à 2007. Hors Union             de la rentabilité financière des projets de tourné vers les applications non domes-
                          européenne (UE), les marchés américains           grande puissance. On commence même à tiques (infrastructure de télécommunica-
                          et japonais restent les plus importants. Si       voir apparaître des centrales terrestres de tion, éclairage public, chargeurs pour télé-
                          l’on compare les données d’installations          plusieurs dizaines de mégawatts. Actuelle- phone et portable, bornes autoroutières,
                          de 2008 des experts nationaux du Pro-             ment, la plus grande ferme solaire en Euro- parcmètres, etc.).
                          gramme des systèmes d’alimentation pho-           pe, construite en 2008, de 60 MWc, est située
                          tovoltaïques de l’Agence internationale de        à Olmedilla, en Espagne. Elle est suivie de


                                                                                                                   Installation d’un système photovoltaïque
                                                                                                                   intégré sur un hangar agricole.
                                                                                                                   I st    to o         te r te p oto o t c
                                                                                                                   s ste   o         rc t r b r .


                                                                                                                   Drachenbronn (Alsace, France).


                                                                                                                                                                 Ademe


 SYSTÈMES SOLAIRES             le journal du photovoltaïque               N° 3 – 2010
 P H O T OV O L T A I C B A R O M E T E R – E U R O B S E R V ’ E R – A P R I L 2 0 1 0
131


                                                                                                                                                                               b aromètre photovoltaïque
      irst estimates of the main global photovoltaic markets put                America and Japan are the biggest markets outside the European

F     additional capacity at around 7 GWp, equivalent to 16.6%
      growth over 2008 (6 GWp). However this is a provisional fig-
ure, which could be revised upwards in the coming months, in the
                                                                                Union. The Japanese market will rise from 225.3 to 484 MWp and
                                                                                the US market from 338 to 475 MWp, making them the number
                                                                                three and number four world markets respectively, if we compare
same way the 2008 installation level is much higher than we pre-                the 2008 installation data from the IEA PVPS national experts with
dicted in our previous barometer (Systèmes Solaires, Le Journal du              the recent EPIA (European Photovoltaic Industry Association)
Photovoltaïque n° 1). The highest consolidation was in Germany                  data. The Chinese market is also full of promise with CREIA (the
where for the first time the Federal Network Agency (Bundesnet-                 Chinese Renewable Energies Industry Association) putting this
zagentur) published an accurate log of photovoltaic system con-                 market at 215 MWp in 2009, reckoning that it should rise to at least
nections that were assisted by the renewable energies law (EEG).                500 MWp in 2010, and possibly pass the 1 GWp mark.
However world growth recorded for 2009 will fall short of its 2008
performance, when the market more than doubled its 2007 level.


Tabl. n° 1
Puissance photovoltaïque installée dans l’Union européenne durant l’année 2008 et 2009* (en MWc).
Photovoltaic capacity installed in the European Union during 2008 and 2009* (in MWp).

                                                        2008                                                             2009*
                                        Réseau            Hors réseau                                     Réseau           Hors réseau
                                                                                     Total                                                            Total
                                        On-grid              Off-grid                                     On-grid             Off-grid
  Germany                                   ,                     ,                  ,                       ,                      ,                  ,
  Italy                                     ,                     ,                  ,                       ,                      ,                  ,
  Czech Republic                            ,                     ,                  ,                       ,                      ,                  ,
  Belgium                                   ,                     ,                  ,                       ,                      ,                  ,
  France                                    ,                     ,                  ,                       ,                      ,                  ,
  Spain                                     ,                     ,                  ,                       ,                      ,                  ,
  Greece                                    ,                     ,                  ,                       ,                      ,                  ,
  Portugal                                  ,                     ,                  ,                       ,                      ,                  ,
  United Kingdom                            ,                     ,                  ,                       ,                      ,                  ,
  Netherlands                               ,                     ,                  ,                       ,                      ,                  ,
  Slovenia                                  ,                     ,                  ,                       ,                      ,                  ,
  Austria                                   ,                     ,                  ,                       ,                      ,                  ,
  Bulgaria                                  ,                     ,                  ,                       ,                      ,                  ,
  Finland                                   ,                     ,                  ,                       ,                      ,                  ,
  Luxembourg                                ,                     ,                  ,                       ,                      ,                  ,
  Denmark                                   ,                     ,                  ,                       ,                      ,                  ,
  Malta                                     ,                     ,                  ,                       ,                      ,                  ,
  Cyprus                                    ,                     ,                  ,                       ,                      ,                  ,
  Sweden                                    ,                     ,                  ,                       ,                      ,                  ,
  Hungary                                   ,                     ,                  ,                       ,                      ,                  ,
  Romania                                   ,                     ,                  ,                       ,                      ,                  ,
  Slovakia                                  ,                     ,                  ,                       ,                      ,                  ,
  Estonia                                   ,                     ,                  ,                       ,                      ,                  ,
  Poland                                    ,                     ,                  ,                       ,                      ,                  ,
  Lithuania                                 ,                     ,                  ,                       ,                      ,                  ,
  Ireland                                   ,                     ,                  ,                       ,                      ,                  ,
  Latvia                                    ,                     ,                  ,                       ,                      ,                  ,
  totalEU27                      5064,432                    9,696        5074,128               5474,867                 10,276          5485,143
  *Estimation. Est   te. – Les décimales sont séparées par une virgule. ec    s re   r tte     t   co     . Source : EurObserv'ER 2010.


                                                                                               SYSTÈMES SOLAIRES        le journal du photovoltaïque                 N° 3 – 2010
                                                                                         B A R O M È T R E P H O T OV O L T A Ï Q U E – E U R O B S E R V ’ E R – A V R I L 2 0 1 0
132
photovoltaic b arometer


                          Tabl. n° 2
                          Puissance photovoltaïque cumulée dans les pays de l’Union européenne en 2008 et 2009* (en MWc).
                          Cumulated photovoltaic capacity in the European Union countries at the end of 2008 and 2009* (in MWp).

                                                                                2008                                                               2009*
                                                                Réseau           Hors réseau                                       Réseau            Hors réseau
                                                                                                                 Total                                                   Total
                                                                On-grid             Off-grid                                       On-grid              Off-grid
                            Germany                                 ,                        ,                   ,                     ,                      ,          ,
                            Spain                                   ,                        ,                   ,                     ,                      ,          ,
                            Italy                                   ,                        ,                   ,                     ,                      ,          ,
                            Czech Republic                          ,                        ,                   ,                     ,                      ,          ,
                            Belgium                                 ,                        ,                   ,                     ,                      ,          ,
                            France                                  ,                        ,                   ,                     ,                      ,          ,
                            Portugal                                ,                        ,                   ,                     ,                      ,          ,
                            Netherlands                             ,                        ,                   ,                     ,                      ,          ,
                            Greece                                  ,                        ,                   ,                     ,                      ,          ,
                            Austria                                 ,                        ,                   ,                     ,                      ,          ,
                            United Kingdom                          ,                        ,                   ,                     ,                      ,          ,
                            Luxembourg                              ,                        ,                   ,                     ,                      ,          ,
                            Sweden                                  ,                        ,                   ,                     ,                      ,          ,
                            Slovenia                                ,                        ,                   ,                     ,                      ,          ,
                            Finland                                 ,                        ,                   ,                     ,                      ,          ,
                            Bulgaria                                ,                        ,                   ,                     ,                      ,          ,
                            Denmark                                 ,                        ,                   ,                     ,                      ,          ,
                            Cyprus                                  ,                        ,                   ,                     ,                      ,          ,
                            Malta                                   ,                        ,                   ,                     ,                      ,          ,
                            Poland                                  ,                        ,                   ,                     ,                      ,          ,
                            Hungary                                 ,                        ,                   ,                     ,                      ,          ,
                            Romania                                 ,                        ,                   ,                     ,                      ,          ,
                            Ireland                                 ,                        ,                   ,                     ,                      ,          ,
                            Slovakia                                ,                        ,                   ,                     ,                      ,          ,
                            Estonia                                 ,                        ,                   ,                     ,                      ,          ,
                            Lithuania                               ,                        ,                   ,                     ,                      ,          ,
                            Latvia                                  ,                        ,                   ,                     ,                      ,          ,
                            totalEU27                     10 249,931               126,130             10 376,061            15 724,798               136,406    15 861,204
                            *Estimation. Est   te. Les éc     es so t sép rées p r   e   r       e. ec    s re   r tte    t   co   . Source : EurObserv'ER 2010.


                                                                               exactement) (tableau 2). La puissance la principale destination du marché mon-
                          L’Union eUropéenne,                                  moyenne par habitant se situe désormais à dial du photo voltaïque, puisqu’elle a
                          principaLe destination                               31,6 Wc contre 20,8 Wc en                                   accueilli 78,1 % du volume d’ins-
                          de La prodUction mondiaLe                            2008 (tableau 3). L’année
                                                                               2009 est une bonne année                  31,6 Wc/Wp        tallation (avec un marché mon-
                                                                                                                                           dial estimé à 7 GWc).
                          L’effondrement du marché espagnol n’a pu             pour un grand nombre de         la puissance par habitant   L’Union européenne reste par
                          que ralentir la croissance de celui de l’Union       pays de l’Union (Italie,             dans l’UE fin 2009     conséquent la principale zone
                          européenne. Selon les premières estima-              République tchèque, Bel-         capacity per capita in the de production d’électricité so-
                          tions disponibles, la puissance installée de         gique…), consolidant le            EU at the end of 2009    laire. Celle-ci devrait tourner
                          l’UE durant l’année 2009 devrait atteindre           développement futur de la                                   autour de 13,5 TWh en 2009,
                          5 485,1 MWc, soit 8,1 % de plus qu’en 2008           filière européenne, qui sera moins dépen- contre 7,4 TWh en 2008.
                          (tableau 1). Sa puissance cumulée attein-            dant de la taille du marché allemand. Le
                          drait donc près de 16 GWc (15 861,2 MWc              vieux continent est d’ailleurs resté en 2009


 SYSTÈMES SOLAIRES             le journal du photovoltaïque                 N° 3 – 2010
 P H O T OV O L T A I C B A R O M E T E R – E U R O B S E R V ’ E R – A P R I L 2 0 1 0
135


                                                                                                                                                                  b aromètre photovoltaïque
The main reason for the rise in installation volume over the past      Tabl. n° 3
two years is the higher profitability of high-capacity projects.       Puissance photovoltaïque par habitant des différents pays
Ground-based plants with capacities running into the tens of           de l’Union européenne en 2009* (en Wc/hab).
megawatts are starting to appear. The largest installation in          Photovoltaic power per inhabitant for each European
Europe for the time being is the 60-MWp solar farm built at            Union country in 2009* (in Wp/inhab).
Olmedilla, Spain in 2008, followed by two German installations –
at Strasskirchen (54 MWp) and Lieberose (53 MWp), commissioned                                                                         Wc/hab
                                                                                                                                      Wp/inhab
in 2009. The American SunEdison group announced last March
that it would be constructing a 72-MWp plant in Rovigo province,         Germany                                                                ,
Veneto (North-eastern Italy) starting early in the 2nd half of 2010,
                                                                         Spain                                                                  ,
that will be fully operational by the end of the year. The scale of
this plant contrasts sharply with the biggest roof-integrated pho-       Luxembourg                                                             ,
tovoltaic system with just 11.8 MWp of capacity installed in 2008        Czech Rep                                                              ,
on General Motors’ Zaragoza plant in Spain.
                                                                         Belgium                                                                ,
The off-grid application market is also gaining ground, but is
harder to monitor due to a lack of comprehensive surveys. The            Italy                                                                  ,
market is increasingly turning towards non-domestic applica-             Portugal                                                               ,
tions such as telecommunications infrastructure, public lighting,
                                                                         Greece                                                                 ,
telephone and cell phone chargers, motorway terminals, parking
meters, and so on).                                                      Austria                                                                ,
                                                                         France                                                                 ,
                                                                         Cyprus                                                                 ,
the eUropean Union – the main destina-
tion for the worLd’s prodUction                                          Slovenia                                                               ,
                                                                         Netherlands                                                            ,
The collapse of the Spanish market only slowed down the Euro-
                                                                         Malta                                                                  ,
pean Union market’s growth. First available estimates put 2009
EU installed capacity at up to 5 485.1 MWp which is 8.1% higher          Finland                                                                ,
than its 2008 level (t b e 1). If confirmed that would bring accu-       Sweden                                                                 ,
mulated capacity up to about 16 GWp (15 861.2 MWp to be precise)
                                                                         Denmark                                                                ,
(t b e 2). Mean per capita capacity now stands at 31.6 Wp as
against 20.8 Wp in 2008 (t b e 3).                                       Bulgaria                                                               ,
For many EU countries (Italy, Czech Republic, Belgium) that have         United Kingdom                                                         ,
consolidated the future development of the European sector,
                                                                         Ireland                                                                ,
2009 was a good year. Europe remained the main destination
for the world’s photovoltaic market in 2009 as it concentrated           Hungary                                                                ,
78.1% of the installation volume (with the global market put at          Slovakia                                                               ,
7 GWp).
Consequently the European Union is the main solar electricity pro-
                                                                         Estonia                                                                ,
ducing zone, generating around 13.5 TWh in 2009, as against 7.4          Romania                                                                ,
TWh in 2008.                                                             Poland                                                                 ,

Germany leadinG by a lonG chalk                                          Lithuania                                                              ,
                                                                         Latvia                                                                 ,
Calculating the installation volume of the German market accu-           totalEU27                                                          31,6
rately is always a hard task as the provisional data published at
                                                                         *Estimation. Est  te. Les décimales sont séparées par une virgule.
the beginning of the year is generally consolidated upwards dur-           ec    s re r tte     t    co     . Source : EurObserv'ER 2010.
ing the course of the year if not at the beginning of the following
year. Early in April 2010 the Federal Network Agency worked out
the additional “on-grid” capacity installed in Germany in 2009 at      istry). For the first time, solar accounts for 1% of the country’s elec-
3 806.3 MWp, raising the accumulated capacity connected to the         tricity supply and this percentage could double by 2011.
grid to almost 10 GWp (9 785.3 MWp). Thus the annual capacity of       The prime reason for the 2009 capacity installation level is the
connections to the grid continued growing for another year at a        sharp drop in the cost of systems during the year. According to
runaway rate (+ 843 MWp in 2006, + 1 271 MWp in 2007 and + 1 809       BSW Solar (the German Solar Industry Association), the average
MWp in 2008).                                                          price of roof-integrated systems up to 100 kWp capacity dropped
In doing so, Germany has confirmed its world solar electricity pro-    25.6% from €4 216/kWp in the fourth quarter of 2008 to €3
ducing top rank slot with production of 6.2 TWh (4.4 TWh in 2008),
up 40% on 2008, according to the BMU (German Environment Min-


                                                                                   SYSTÈMES SOLAIRES        le journal du photovoltaïque                N° 3 – 2010
                                                                            B A R O M È T R E P H O T OV O L T A Ï Q U E – E U R O B S E R V ’ E R – A V R I L 2 0 1 0
136
photovoltaic b arometer


                                                                                                                                  Centrale terrestre de
                                                                                                                                  Waldalgesheim (Allemagne),
                                                                                                                                  2,5 MWc de puissance.
                                                                                                                                            es e 2.5-   p
                                                                                                                                  c p ct      ro  -b se
                                                                                                                                  po er p      t Ger     .
                           Juwi


                          l’allemaGne très loin devant                  Le niveau de puissance installée en 2009        c€/kWh selon la nature et la puissance des
                                                                        s’explique avant tout par une diminution        panneaux. Ces propositions sont cepen-
                          Définir précisément le volume d’installa- très importante du prix des systèmes au             dant susceptibles d’évoluer, aucune déci-
                          tion du marché allemand est toujours un cours de l’année. Selon BSW Solar (German             sion définitive n’ayant été prise à la fin du
                          exercice difficile. Les données provisoires Solar Industry Association), le prix moyen        mois de mars.
                          publiées en début d’année sont générale- des centrales installées sur toiture jusqu’à         Ce sujet est actuellement très polémique
                          ment consolidées nettement à la hausse en 100 kWc est passé outre-Rhin de 4 216               en Allemagne : souffrant d’un manque de
                          cours d’année, voire même au début de l’an- euros/kWc au quatrième trimestre 2008 à           compétitivité, l’industrie nationale a
                          née suivante. Début avril 2010, l’Agence 3 135 euros/kWc au quatrième 2009, soit              besoin de temps pour se restructurer et
                          fédérale du réseau a établi la puissance une baisse de 25,6 %. Sachant qu’au deuxiè-          réduire ses coûts. Une baisse trop impor-
                          supplémentaire “reliée réseau” installée en me trimestre 2006 ces installations étaient       tante du tarif d’achat pourrait mettre en
                          Allemagne à 3 806,3 MWc en 2009, portant vendues 5 000 euros/kWc, la baisse atteint           difficultés de nombreuses entreprises et se
                          ainsi la puissance cumulée reliée réseau à donc quelque 37,7 % en trois ans.                  traduire par de fortes réductions d’effec-
                          près de 10 GWc (9 785,3 MWc). Ce chiffre est Cette baisse sensible des prix est actuelle-     tifs. De nombreuses entreprises ont retar-
                          le résultat d’un rythme effréné de crois- ment bien supérieure à la dégressivité mise         dé leurs investissements ou encore annon-
                          sance depuis plusieurs années (+ 843 MWc en place dans le système actuel de tarif             cé des délocalisations partielles de leur
                          en 2006, + 1 271 MWc en 2007, + 1 809 MWc d’achat, fixé à 9 et 11 % au 1er janvier 2010.      production en Asie.
                          en 2008).                                     Cette inadéquation sera corrigée en cours
                          L’Allemagne a donc confirmé son rang de d’année par une hausse de la dégressivité.            l’italie, deuxième marché
                          premier producteur mon-                                         Des discussions sont en       mondial en 2009
                          dial d’électricité solaire                                      cours à ce sujet entre le
                          avec, selon le BMU (minis-
                          tère de l’environnement
                                                           +3811,3                       gouvernement et les pro-
                                                                                          fessionnels de la filière.
                                                                                                                        L’Italie, après l’Allemagne et l’Espagne, est
                                                                                                                        le troisième pays de l’Union européenne à
                          allemand), une production        MWc/MWp                        L’exécutif allemand a déjà    franchir le cap symbolique des 1 000 MWc
                          de 6,2 TWh (4,4 TWh en installés en Allemagne en 2009 proposé une réduction                   installés. Selon des données de l’ENEA
                          2008), en croissance de       installed in Germany in 2009      supplémentaire du tarif       (Agence nationale des nouvelles technolo-
                          40 % par rapport à 2008. Le                                     d’achat de l’ordre de 16 %    gies, de l’énergie et du développement éco-
                          solaire représente pour la première fois 1 % à partir du 1er juillet pour les panneaux ins-   nomique durable), le pays a connecté au
                          de l’approvisionnement en électricité du tallés sur les toits, et de 15 % pour les pan-       réseau une puissance additionnelle de 574
                          pays, et ce pourcentage pourrait doubler neaux en surface libre. Le prix d’achat
                          d’ici 2011.                                   s’échelonnerait entre 32,9 c€/kWh et 25,3


 SYSTÈMES SOLAIRES                le journal du photovoltaïque         N° 3 – 2010
 P H O T OV O L T A I C B A R O M E T E R – E U R O B S E R V ’ E R – A P R I L 2 0 1 0
137


                                                                                                                                                                                         b aromètre photovoltaïque
Puissance photovoltaïque installée dans l’Union européenne fin 2009*.
Photovoltaic power capacity installed in the European Union at the end of 2009*.


      N
      N             km
                    km


                                                                                                                       Finland n
                                                                                                                               n°
                                                                                                                                           ,
                                                                                   Sweden n
                                                                                          n°                                               ,
                                                                                                 ,
                                                                                                 ,


                                                                                            n°                                         ,
                                                                               ,                                                       ,
                                                                               ,
              Ireland
                        ,                                                                                                                      ,
                        ,                                                                                   Lithuania                          ,
                                                               The Netherlands n°
                                                                 ,                                                            ,
                 United Kingdom                                  ,                                                            ,
                                                      ,
                                       ,
                                       ,
                                                                                                                                                           TOTAL EU
                                             Belgium n°                                                  Poland n°
                                                               Germany n
                                                                   any n°
                                                                                                                 ,
                                                                                                                                                                  ,
                                                                         ,
                                                                         ,
                                                                                                                ,                                                 ,
                                           Luxembourg n
                                                      n°
                                                           ,
                                                           ,                       Czech Rep.
                                                                                                     ,                            n°
                                                                                                     ,             ,
                                                                                                                   ,
                               France1 n°
                                         ,                                    ,
                                         ,                                    ,
                                                                                        ,                      ,
Portuga
Portugal n°
     g                                                                                                                                                 ,
                                                                                                               ,
   ,                                                                                                                                                   ,
                                                                        Slovenia n°
   ,

       Spain n
        pain n°
                                                                                                                          Bulgaria
               ,                                                      Italy n
                                                                        aly n°
               ,                                                                                                                                   ,
                                                                              ,                                                                    ,
                                                                              ,


                                                                                                                          ,
                                                                                                                          ,
                                                                                                                                                                             ,
                                                                                                                                                                             ,
                                                                                      Malta n
                                                                                            n°
                                                                                                                                                                 Cyprus n°
                                                                                                     ,
                                                                                                     ,
Légende/Key

     Puissance cumulée installée                      Puissance installée durant l’année                           *Estimation. Est     te.
     dans les pays de l’Union                         2009 dans les pays de l’Union                                1. DOM-COM inclus./French overseas Departments
     européenne fin 2009* (en MWc)                    européenne* (en MWc)                                         and Territories included. Source : EurObserv'ER 2010.
     Cumulated installed capacity                     Installed capacity in the
     in the European Union countries                  European Union countries
     at the end of 2009* (in MWp)                     during 2009* (in MWp)


                                                                                             SYSTÈMES SOLAIRES                     le journal du photovoltaïque                  N° 3 – 2010
                                                                                      B A R O M È T R E P H O T OV O L T A Ï Q U E – E U R O B S E R V ’ E R – A V R I L 2 0 1 0
138
photovoltaic b arometer


                          MWc en 2009, portant la puissance totale            centrale de 3 kWc parfaitement intégrée au Cette rapide montée en puissance est
                          connectée à 1 019 MWc (non compris 13,4             bâti pourrait être, jusqu’à la fin de 2011, de cependant problématique, car elle repose
                          MWc pour des applications hors réseau).             57 c€/kWh (sur 20 ans), non inclus le bonus sur un système d’incitation qui n’avait pas
                          Cette bonne année, l’Italie la doit à la plei-      en cas d’autoconsommation sur site. La prévu que les coûts d’installations des cen-
                          ne opérationnalité des mesures d’incita-            rémunération de base devrait être beau- trales de grande puissance chuteraient de
                          tion contenues dans le “Nuovo Conto Ener-           coup plus faible pour les                                         près de 40 % durant l’année
                          gia”. Ce programme, qui valide un système           centrales de plus de 1 MWc.                                       2009. La législation tchèque
                                                                                                               La République tchèque
                          de tarif d’achat pour une puissance plafon-         Le tarif actuel de 34,6                                           a en effet la particularité de
                                                                                                               a installé 411 MWc en
                          née à 1 200 MWc (non inclus les 165 MWc             c€/kWh devrait diminuer                                           très peu différencier le
                                                                                                               une seule année.
                          installés dans le cadre du plan précédent           en trois temps durant l’an-                                       niveau d’incitation en fonc-
                          “Primo Conto Energia”), va bientôt arriver          née 2011, passant de 31,3 The Czech Republic                      tion de la puissance. L’in-
                          à échéance, certainement avant la fin du            c€/kWh à 26,4 c€/kWh. Ces installed 411 MWp in a                  vestisseur a le choix entre
                          premier semestre 2010. Le gouvernement              tarifs baisseraient ensuite single year.                          un tarif d’achat classique
                          n’avait pas, à la fin du mois de mars, enco-        de 6 % par an en 2012 et                                          ou un bonus écologique qui
                          re dévoilé la version définitive du nouveau         2013. Dans l’attente de l’adoption définiti- s’ajoute au prix de marché. Dans ce cas, le
                          système d’incitation. Les premiers projets          ve du nouveau programme, ces informa- producteur vend son électricité à un cour-
                          publiés début février montrent une forte            tions restent à confirmer.                      tier qui la revend sur le marché de gros.
                          volonté de différenciation des tarifs (42 au                                                        L’Office de régulation de l’énergie (ERU)
                          total !), variant selon la puissance et le type     un marché de plus de 400 mWc                    définit le tarif et le bonus chaque année
                          de système. La nouvelle législation prendra         en république tchèque                           avec une année d’avance, les prix ne pou-
                          également en compte la baisse du prix des                                                           vant pas représenter moins de 95 % du prix
                          modules photovoltaïques, qui a fortement            La République tchèque a, selon le minis- de l’année précédente. Pour 2010, le régu-
                          réduit les coûts d’investissements des cen-         tère de l’Industrie et du Commerce, instal- lateur a logiquement choisi de réduire le
                          trales de grande puissance. Il est aussi pré-       lé 411 MWc en une seule année. Ce niveau tarif d’achat de 5 %. Le tarif est donc porté
                          vu d’augmenter les tarifs standards en cas          d’installation place le pays à la troisième pour les systèmes inférieurs à 30 kWc à
                          d’augmentation de la performance énergé-            place en termes de puissance nouvelle- 12,25 CZK/kWh (48,2 c€/kWh) et le bonus
                          tique d’un bâtiment (jusqu’à 12 c€/kWh sup-         ment installée (7e rang en 2008) et à la qua- écologique à 11,28 CZK/kWh (44,3 c€/kWh).
                          plémentaires), ou si les centrales terrestres       trième en puissance cumulée (8 e rang en Pour les systèmes de puissance supérieure
                          sont construites sur des sites pollués ou           2008). Les perspectives de croissance pour à 30 kWc, le tarif d’achat est fixé à 12,15
                          d’enfouissement (jusqu’à 8 c€/kWh supplé-           2010 sont encore plus favorables : plus de CZK/kWh (47,8 c€/kWh) et le bonus écolo-
                          mentaires). Selon une des dernières propo-          1 GWc pourrait être installé au cours de gique à 11,18 CZK/kWh (44 c€/kWh).
                          sitions, le tarif d’achat standard pour une         l’année.                                        Le gouvernement prévoit de réduire forte-
                                                                                                                              ment les conditions de rémunération de
                                                                                                                              l’électricité solaire à partir du 1er janvier
                                                                                                                              2011. Le Parlement a déjà fait trois propo-
                                      Toiture équipée de                                                                      sitions qui sont actuellement débattues. La
                                 tuiles photovoltaïques.                                                                      première consiste à porter la réduction du
                                       oo co ere    t                                                                         tarif d’achat à 25 % par an. La deuxième,
                                      p oto o t c t es.                                                                       plus difficile à appliquer, consiste à donner
                                                                                                                              le droit au régulateur de recalculer le tarif
                                                                                                                              d’achat au cas où le temps de retour sur
                                                                                                                              investissement  serait inférieur à 11 ans,
                                                                                                                              pour ramener ce dernier à 15 ans. La der-
                                                                                                                              nière proposition consiste à mettre en pla-
                                                                                                                              ce, à partir du 1er mai 2011, des restrictions
                                                                                                                              pour les centrales de plus de 20 MWc.

                                                                                                                               la belGique confirme
                                                                                                                               ses ambitions

                                                                                                                               La Belgique est une nouvelle fois sur le
                                                                                                                               devant de la scène. Selon les premières esti-
                                                                                                                               mations communiquées par l’APERE (Asso-
                                                                                                                               ciation pour la promotion des énergies
                                                                                                                               renouvelables), le pays aurait installé 292,1
                                                                                                                               MWc en 2009, dont 251 MWc en Région fla-
                                                                                                                        Juwi


 SYSTÈMES SOLAIRES             le journal du photovoltaïque                 N° 3 – 2010
 P H O T OV O L T A I C B A R O M E T E R – E U R O B S E R V ’ E R – A P R I L 2 0 1 0
141


                                                                                                                                                                        b aromètre photovoltaïque
135/kWp in the same quarter in 2009. Looking back to the second
quarter of 2006 when the systems sold for €5 000/kWp, this drop
is as much as 37.7%.                                                          Trackers photovoltaïques à
For the time being this price cut more than compensates for the            Montesquieu (Gironde, France).
sliding scale set in the current feed-in tariff scheme, fixed at 9 and            oto o t c tr c ers t
11% on 1st January 2010. This anomaly will be corrected during              o tesq e (G ro e, Fr ce).
the year by an increase in the sliding scale. Discussions are now
under way between the government and the industry’s players.
The government has already proposed to cut the feed-in tariff by
an additional 16% from 1st July for roof-integrated panels and by
15% for free-standing panels. The buyback price would be stag-
gered between €0.329/kWh and €0.253/kWh depending on panel
type and capacity. However, these proposals are likely to change,
as no final decision had been made by the end of March.
This is a highly controversial subject in Germany as its industry is
currently hit by competitiveness issues and needs time to restruc-
ture and reduce costs. A too big reduction in the feed-in tariff
could land many firms in difficulty and jeopardise many jobs.
Most companies have postponed investments or even announced
to partially shift production to Asia.

italy, the World number tWo market in 2009

Italy is the third European Union country to pass the symbolic 1000


                                                                                                                                              Géraldine Houot
MWp installed mark, following Germany and Spain. According to
ENEA (the Italian National Agency for New Technologies, Energy
and Sustainable Economic Development), the country connected
574 MWp of additional capacity to the grid in 2009, bringing total
connected capacity to 1 019 MWp (excluding 13.4 MWp of off-grid
applications). Italy owes this good year to the full implementation
of its Nuovo Conto Energia incentive programme which validates over 400 mWp in the czech republic
a feed-in tariff system for capacity capped at 1 200 MWp (not
including the 165 MWp installed under the previous Primo Conto According to the Czech Ministry of Industry and Trade, the Repub-
Energia programme). The programme will shortly end, almost cer- lic installed 411 MWp in a single year. This installation rate cata-
tainly before the end of the first half of 2010. By the end of March pults the country to third place in terms of newly installed capaci-
the government had yet to unveil the final version of the new ty (7th place in 2008) and fourth place in terms of accumulated
incentive scheme. The first drafts published early in February capacity (8th place in 2008). As there is a good chance that over 1
demonstrate its strong determination to differentiate the tariffs GWp will be installed by the end of this year, the growth prospects
– 42 in all – that vary in line with system capacity                                for 2010 are even more encouraging.
and type. The new incentive system will also make                                   However this rapid rise is offset by the fact that it
                                                          At the end of 2009 Italy
allowance for the drop in the price of photovoltaic                                 is based on an incentive system that had not antic-
                                                          passed the symbolic
modules that has dramatically reduced the invest-                                   ipated that high-capacity plant installation costs
                                                          one GWp barrier.
ment costs of high-capacity plants. This new legis-                                 would plummet by almost 40% in 2009. This is
lation provides for increasing standard tariffs when- L’Italie a franchi fin        because the Czech system makes almost no dis-
ever measures are taken to increase the building 2009 le cap symbolique             tinction for capacity in its incentive levels.
energy performance level (up to an additional du GWc installé.                      Investors can choose between a conventional
€0.12/kWh) or if the ground-based plants are con-                                   feed-in tariff system and an environmental bonus
structed on polluted or landfill sites (up to an additional €0.8/kWh). added to the market price. In the latter case, the producer sells
One of the latest proposals suggests that the standard feed-in tar- his electricity to a trader who sells it on the wholesale market.
iff for a 3-kWp plant perfectly integrated into a building could be Every year the Energy Regulatory Office (ERU) defines the tariff
€0.57/kWh (for 20 years) up to the end of 2011, not excluding the and bonus a whole year in advance, the new prices cannot be less
bonus in the event of self-consumption on site. The basic remu- than 95% of the previous year’s rate. For 2010, the regulator nat-
neration should be much lower for plants with over 1 MWp of urally reduced the feed-in tariff by 5%. Therefore the tariff is
capacity. The current tariff of €0.346/kWh should drop three times reduced to CZK 12.25/kWh (€0.482/kWh) for systems up to 30 kWp
in 2011, to €0.313/kWh and then to €0.264/kWh. These tariffs will and the environmental bonus to CZK 11.28/kWh (€0.443/kWh). The
then drop by 6% per annum in 2012 and 2013. While we await the feed-in tariff for systems with a capacity in excess of 30 kWp is
adoption of the new programme in its finalised form, this should
be taken as guideline data.


                                                                                 SYSTÈMES SOLAIRES        le journal du photovoltaïque                          N° 3 – 2010
                                                                           B A R O M È T R E P H O T OV O L T A Ï Q U E – E U R O B S E R V ’ E R – A V R I L 2 0 1 0
142
photovoltaic b arometer


                           Ademe


                          mande, 38 MWc en Région wallonne et 3,1 d’installation. Ce système a naturellement               apprécier la rentabilité de ce type d’instal-
                          MWc en Région bruxelloise.                         bénéficié aux centrales de grande puissan-    lation, le gouvernement a préféré lancer en
                          Le chiffre d’installation de la partie fla- ce, lesquelles ont aussi le plus profité de la       2009 un appel d’offres, portant sur un total
                          mande a été communiqué par BelPV (Fédé- baisse du prix des modules. Un ajustement                de 300 MWc répartis en 27 tranches sur 4
                          ration belge des entreprises photovol- a été opéré. À partir du 1er janvier 2010, le             zones géographiques représentant autant
                          taïques). Il devrait prochainement être prix d’un certificat vert photovoltaïque est             de niveaux d’ensoleillement. À la date limi-
                          consolidé par le VREG, le régulateur du mar- fixé à 350 euros.                                   te de remise des offres, le 25 janvier dernier,
                          ché de l’électricité et du gaz en région fla-                                                    119 dossiers avaient été reçus représentant
                          mande. Les données d’installation des la france, loin des leaders                                une puissance cumulée de 867 MWc.
                          régions wallonne et bruxelloise provien-                                                         Le niveau de puissance installée est surtout
                          nent respectivement de la CWAPE (Com- Avec 185,2 MWc raccordés au réseau élec-                   très faible comparé à l’ampleur des
                          mission wallonne pour l’énergie) et de Bru- trique au cours de l’année 2009 (dont 46,7           demandes de raccordement. En effet, selon
                          gel (Bruxelles gaz électricité). Ces différents MWc dans les départements d'outre-mer ou         le SOeS, la puissance des installations en
                          apports porteraient la                                             DOM), le parc photovol-       attente de raccordement au 31 décembre


                                                           + 292,1
                          puissance totale instal-                                           taïque a, selon le SOeS       2009 a atteint 3 438 MWc pour 58 544
                          lée dans le pays à 363                                             (Service de l’observation     demandes déposées (2 789 MWc en métro-
                          MWc, soit le 5e rang de                                            et des statistiques), plus    pole et 650 MWc dans les DOM), contre 1886
                          l’Union européenne.              MWc/MWp                           que triplé depuis la fin de   MWc au 30 juin de la même année pour
                          La forte progression                                               l’année 2008. La puissance    24 470 demandes. Les longs délais d’atten-
                                                           La puissance supplémentaire
                          constatée en région fla-                                           cumulée raccordée en          te s’expliquent à la fois par un afflux mas-
                                                           installée en Belgique en 2009
                          mande s’explique par un             The additional capacity        France atteint fin 2009       sif de demandes de raccordement en fin
                          système de certificats            installed in Belgium in 2009     268,2 MWc (200,7 MWc en       d’année, mais également par le manque de
                          verts régional particuliè-                                         métropole et 67,5 MWc         techniciens pour raccorder les installations
                          rement attractif. Dans ce mécanisme, le dans les DOM). Ce niveau d’installation plus             au réseau national.
                          prix minimum d’un certificat vert d’origine limité que chez les autres pays leader du            Cet afflux de demandes a conduit le gou-
                          photovoltaïque (équivalent à une produc- marché s’explique en partie par le choix de             vernement à modifier les conditions
                          tion de 1 MWh) avait été fixé dans un pre- ne pas favoriser le développement des cen-            d’achat de l’électricité solaire en adoptant
                          mier temps à 450 euros (soit 0,45 c€/kWh) et trales au sol en leur attribuant un tarif
                          ce, quels que soient la puissance et le type d’achat relativement faible. Afin de mieux


 SYSTÈMES SOLAIRES                 le journal du photovoltaïque         N° 3 – 2010
 P H O T OV O L T A I C B A R O M E T E R – E U R O B S E R V ’ E R – A P R I L 2 0 1 0
143


                                                                                                                                                                  b aromètre photovoltaïque
                                                                       to 363 MWp, taking it to fifth place in the European Union.
                                                                       The reason for the sharp rise in installed capacity in the Flemish
                                                                       region is that it operates a particularly attractive regional green
                                                                       certificate system which offers a minimum price of 450 euros (or
                                                                       €0.0045/kWh) for a photovoltaic green certificate (equivalent to
                                                                       a production of 1 MWh) regardless of installation capacity or
                                                                       type. This system has naturally been a boon to high-capacity
                                                                       installations that have gained the most from the drop in the
                                                                       price of modules. An adjustment has set the price of a photo-
                                                                       voltaic green certificate at 350 euros from 1st January 2010.

                                                                       france trailinG behind the leaders

                                                                        According to SOeS (the Observation and Statistics Office), 185.2
                                                                        MWp were connected to the grid during the course of 2009
                                                                        (including 46.7 MWp in the Overseas Departments), increasing
                                                                        the photovoltaic base more than threefold since the end of 2008.
                                                                        The accumulated capacity connected in France rose at the end
                                                                        of 2009 to 268.2 MWp, 200.7 MWp thereof in mainland France and
                                                                        67.5 MWp overseas. Part of the reason why this installation lev-
                                                                        el is lower than that of the other leading countries in the EU mar-
                                                                        ket, is the French government’s decision not to promote the
                                                                        development of ground-based plants, but to set a relatively low
                                                                        feed-in tariff. The government preferred to call a tender in 2009
                                                                        to get a better grip on the profitability of this type of installa-
                                                                        tion. The target capacity is 300 MWp spread over 27 phases and
                                                                        over 4 geographical zones with 4 different sunshine levels. By
                                                                        the application expiry date, 25 January, 119 applications had
                                                                        been submitted for an accumulated capacity of 867 MWp.
set at CZK 12.15/kWh (€0.478/kWh) and the environmental bonus However the installed capacity level seems low when compared
at CZK 11.18/kWh (€0.44/kWh).                                           against connection applications. This is because according to
The government intends to slash the solar                                                        the SOeS, the capacity of installations


                                                     58544
electricity remuneration terms starting on                                                       awaiting connection as of 31 December
1st January 2011. Parliament has already                                                         2009 had risen to 3 438 MWp for 58 544
tabled three proposals for debate. The first                                                     applications submitted (2 789 MWp in
entails reducing the feed-in tariff by 25%                                                       mainland France and 650 MWp overseas),
                                                    the number of pending applications
per annum. The second, which is harder to                                                        as against 1 886 MWp on 30 June of the
                                                        for grid connection in France
apply, consists of authorising the regulator                                                     same year for 24 470 applications. The
                                                 le nombre de demandes de raccordement
to recalculate the feed-in tariff when the        au réseau électrique français en attente       massive influx of connection applications
payback time is less than 11 years, to raise                                                     at the end of the year compounded by the
it to 15 years. The third proposal would                                                         dearth of engineers to connect the instal-
introduce restrictions for plants with over 20 MWp of capacity start- lations to the national grid have caused the long lead times.
ing from 1st May 2011.                                                  The rush to submit applications prompted the government to
                                                                        change the solar electricity purchase terms by adopting a new
belGium bolsters its ambitions                                          order on 12 January, which like the previous order favours build-
                                                                        ing-integrated installations this time distinguishing three types
Once again Belgium is in the spotlight. According to APERE’s first of tarification depending on the type of building, its usage (hous-
estimates, Belgium installed 292.1 MWp in 2009 of which 251 ing, health, teaching and others) and the type of integration.
MWp is spread over the Flemish region; 38 MWp over the Wal- A higher integration to the frame premium is awarded for sys-
loon region… and 3.1 MWp over the Brussels Capital region.              tems installed on the roof of a closed building (all side walls
The installation figure for the Flemish region was supplied by closed) replacing the building elements that provide the roofing
BelPV (the Belgian photovoltaic companies’ federation). It or closure (side wall), as well as the waterproofing function. A
should be consolidated shortly by the VREG (Flemish Regulation lower simplified integration premium is also allocated for sys-
Entity for the Electricity and Gas market). The installation data tems installed on open-sided buildings, if the system replaces
for the Walloon and Brussels Capital regions come from CWAPE building elements that provide the walls and roofing as well as
(the Walloon Commission for Energy) and Brugel (Brussels gas the waterproofing function.
electricity) respectively.
This capacity would raise the total installed capacity in Belgium


                                                                                  SYSTÈMES SOLAIRES        le journal du photovoltaïque                 N° 3 – 2010
                                                                            B A R O M È T R E P H O T OV O L T A Ï Q U E – E U R O B S E R V ’ E R – A V R I L 2 0 1 0
144
photovoltaic b arometer


                          le 12 janvier dernier un nouvel arrêté. Com- L’ajustement intervient après plusieurs                beaucoup plus problématique si, dans un
                          me le précédent, ce dernier favorise les ins- années (2006 à 2008) pendant lesquelles les           avenir proche, certains acteurs asiatiques
                          tallations intégrées au bâti en distinguant prix avaient peu diminué, malgré d’impor-               décidaient d’écouler provisoirement leur
                          cette fois trois types de tarification selon tants gains de compétitivité industrielle              marchandise à des prix inférieurs à leur
                          la nature du bâtiment, son usage (habita- réalisée grâce aux économies d’échelle et                 coût réel de production. Ce qui ne semble
                          tion, santé, enseignement et autres) et le aux innovations technologiques. La raison                pas être le cas à l’heure actuelle.
                          type d’intégration.                                 en était le coût élevé de la matière premiè-    La diminution des prix a renforcé la crédi-
                          La “prime d’intégration au bâti” est la plus re, le silicium, en raison d’un manque de dis-         bilité de l’industrie photovoltaïque sur le
                          élevée. Elle est octroyée aux systèmes ins- ponibilité, mais surtout par une demande                plan de sa capacité à réduire ses coûts de
                          tallés sur la toiture d’un bâtiment clos (sur continuellement supérieure à l’offre. Cette           production. Elle va permettre à la techno-
                          toutes les faces latérales)                                           situation a permis aux        logie, à l’image de l’éolien, de renforcer son
                          et qui remplacent des                                                 industriels (en particulier   assise dans les grands pays consomma-
                          éléments du bâtiment
                          assurant la couverture ou
                          la fermeture (face laté-
                          rale), ainsi que la fonc-
                                                              80 %
                                                               la diminution du prix
                                                                                                ceux qui avaient sécurisé
                                                                                                leur approvisionnement
                                                                                                en silicium) de maintenir
                                                                                                une forte rentabilité de
                                                                                                                              teurs d’électricité (États-Unis, Chine, Japon,
                                                                                                                              Corée du Sud, Italie, France, etc.), réduisant
                                                                                                                              sa dépendance actuelle vis-à-vis de l’Alle-
                                                                                                                              magne. Cette dépendance commençait à
                                                                du silicium en 2009
                          tion d’étanchéité. Vient                                              leurs investissements tout    être dangereuse pour l’industrie mondiale,
                                                             the decrease in the price
                          ensuite la “prime d’inté-                                             en augmentant significa-      car ce marché pourrait rapidement arriver
                                                                  of silicon in 2009
                          gration simplifiée”. Elle                                             tivement leurs capacités      à saturation. Cette situation va cependant
                          est allouée aux systèmes installés sur des de production. Parallèlement, ce niveau éle-             amener l’industrie mondiale photovol-
                          bâtiments non fermés, si le système rem- vé et continu des prix sur plusieurs années                taïque à se restructurer au profit des
                          place des éléments du bâti qui assurent le a permis de remettre sur le devant de la                 acteurs les mieux armés en termes de
                          clos et le couvert, ainsi que la fonction scène certaines technologies couches                      réduction des coûts.
                          d’étanchéité.                                       minces qui ont pu démontrer leurs possibi-
                          Les installations entrant dans le cadre de la lités de réduction significative des coûts de         une industrie européenne
                          prime d’intégration et qui sont situées sur production.                                             au pied du mur
                          un bâtiment à usage principal d’habitation, Il a également permis d’accélérer l’essor
                          d’enseignement ou de santé bénéficient industriel et technologique des fabricants                   Dans ce contexte, le challenge sera plus dif-
                          d’un tarif de 58 c€/kWh, et de 50 c€/kWh sur asiatiques (chinois en particulier). Ces der-          ficile pour certains acteurs européens, qui
                          les autres bâtiments. La prime d’intégra- niers ont, depuis plusieurs années, investi               devront faire face à la diminution des aides
                          tion simplifiée au bâti s’élève à 42 c€/kWh. massivement dans de nouvelles capacités                à la production sur leur propre marché. Les
                          Pour les autres installations, le tarif appli- de production, et ce, sur toute la chaîne de         industriels européens qui parviendront à
                          cable en métropole continentale est fixé à valeur de l’industrie photovoltaïque. Les                conforter leur avance technologique en
                          31,4 c€/kWh pour les installations égales ou plus importants d’entre eux se sont appuyés            réduisant sensiblement leurs coûts de pro-
                          inférieures à 250 kWc, et entre 31,4 et 37,7 sur des technologies et des process de poin-           duction, en acceptant de délocaliser une
                          c€/kWh pour les installations de plus de 250 te (notamment développés en Europe et en               partie de leur production, devraient pou-
                          kWc, selon un indice d’ensoleillement défi- Australie), qui leur permettent de proposer             voir passer ce cap, et participer à la crois-
                          ni pour chaque département. Le tarif appli- des modules de bonne qualité à des prix                 sance future du marché mondial. Une des
                          cable en Corse et dans les DOM s’élève à 40 extrêmement compétitifs.                                clés de la survie de l’industrie européenne
                          c€/kWh. Une dégressivité de 10 % sera éga-                                                          passera également par un développement
                          lement appliquée chaque année à partir du l’ère de la surproduction                                 plus important des technologies couches
                          1er janvier 2012.                                                                                   minces, là où les possibilités de réduction
                                                                              L’augmentation considérable de la produc-       de coûts de production sont les plus impor-
                                                                              tion de modules (lire plus loin), libérée par   tantes. De nombreux producteurs euro-
                          L’indUstrie face à Une crise un afflux de silicium sur le marché (175 000                           péens développent actuellement des tech-
                          de matUrité                                         tonnes attendues en 2010 contre 70 000 en       nologies et des process nouveaux qui
                                                                              2008, selon Photon International), a pour la    pourraient renverser la suprématie du sili-
                          des prix à la baisse                                première fois fait entrer l’industrie photo-    cium cristallin.
                                                                              voltaïque dans une ère de surproduction.        L’industrie européenne est actuellement
                          Le prix du silicium, des wafers et des Ce choc a été d’autant plus important que                    dans une mauvaise passe et continue à
                          modules polycristallins a connu une baisse la croissance mondiale a été altérée en 2009             perdre des parts de marché (lire plus loin).
                          sans précédent durant l’année 2009. Selon par l’effondrement espagnol, premier mar-                 L’industrie photovoltaïque allemande a
                          une étude de iSuppli (cabinet de consultants ché de la planète en 2009.                             peu profité de la croissance du marché
                          américain), le prix des modules cristallins a La baisse, même importante, du prix des               mondial en 2009 et de celle de son marché
                          chuté en moyenne de 37,8 %, le prix des modules n’est pas nécessairement une                        domestique. L’industrie espagnole a terri-
                          wafers de 50 % et le prix du silicium de 80 %. mauvaise chose pour l’industrie, dans la             blement souffert de l’effondrement de son
                          Le rapport prévoit de nouvelles baisses en mesure où les prix restent au-dessus des
                          2010, mais nettement moins sensibles.               coûts de production. La situation serait


 SYSTÈMES SOLAIRES             le journal du photovoltaïque              N° 3 – 2010
 P H O T OV O L T A I C B A R O M E T E R – E U R O B S E R V ’ E R – A P R I L 2 0 1 0
147


                                                                                                                                                                b aromètre photovoltaïque
A tariff of €0.58/kWh is allocated to installations that benefit      return to centre-stage as they were put through their paces to
from the integration premium on a building whose primary use          prune manufacturing costs radically.
is housing, teaching or health care. A tariff of €0.50/kWh is allo-   The high prices also opened up opportunities for Asian manu-
cated to installations that have an integration premium on oth-       facturers to accelerate their industrial and technological expan-
er buildings, while a tariff of €0.42/kWh applies to buildings        sion (the Chinese in particular). For a number of years the Chi-
awarded the simplified integration premium.                           nese market players have invested massively in new
The applicable mainland tariff is €0.314/kWh for installations of     manufacturing capacity throughout the photovoltaic industry
250 kWp and less, and €0.314 to €0.377/kWh for installations of       value chain. The biggest concerns have relied on leading-edge
over 250 kWp, applying a sunshine exposure index set for each         technologies and processes (primarily developed in Europe and
department. The tariff applicable in Corsica and the French over-     Australia) that have enabled them to offer good quality modules
seas territories is €0.40/kWh. A 10% degression will also be          at extremely keen prices.
applied every year starting from 1st January 2012.
                                                                      the overproduction era

the indUstry is facing a coming-of-age                              For the first time the photovoltaic industry has entered an era
crisis                                                              of overproduction with a huge increase in module production
                                                                    (see be o ), set off by silicon flooding the market (175 000 tonnes
prices fallinG                                                      expected in 2010 as against 70 000 in 2008, according to oto
                                                                    I ter t o      ). The shock is all the sharper because world mar-
Silicon, wafer and polycrystalline module prices dropped by ket growth was knocked sideways in 2009 by the collapse of its
unprecedented levels in 2009. According to the American con- leading market, Spain, in 2009.
sultancy, iSuppli, the price of crystalline                                               As long as prices outstrip production costs,
modules fell by an average of 37.8%, wafers For the first time in its history,            even a slash in the price of modules, will do
by 50% and silicon by 80% and it predicts fur- the photovoltaic industry has              the industry no harm. The situation would be
ther, but much smaller price drops in 2010.      entered an era of overproduction. much more of a problem if a number of Asian
There are a number of reasons for this dra- L’industrie photovoltaïque est                players were to decide to dump their goods
matic price realignment. This huge drop part- entrée pour la première fois de             on the market by undercutting real manu-
ly makes up for the slender reduction in mod- son histoire dans une ère                   facturing cost prices – which is not the case
ule prices between 2006 and 2008, despite de surproduction.                               as it stands.
the industry’s considerable gains in compet-                                              The credibility of the photovoltaic industry
itive strength achieved through economies of scale and techno- has been boosted by lowering of prices as regards its manu-
logical innovations. The reason why prices were kept at high lev- facturing cost-cutting capacity. It will enable the technology
els is partly because of silicon scarcity and particularly because to strengthen its foothold in the major electricity-consuming
demand continually outpaced supply. The manufacturers (espe- countries (United States, China, Japan, South Korea, Italy,
cially those who had secured their silicon supplies) exploited France, etc.), as wind power has done, reducing its current
this situation to maintain high profit margins on their invest- dependency on the German market. As the German producers
ments while significantly increasing their manufacturing capac- could soon reach saturation point, this dependency is begin-
ities. At the same time, the new high pricing level kept up over
several years enabled a number of thin film technologies to


                                                                         Mise en service fin 2009, Montalto di Castro est,
                                                                         avec 24 MWc de puissance, la plus grande centrale
                                                                         photovoltaïque italienne connectée au réseau.

                                                                         Connected at the end of 2009, Montalto di Castro
                                                                         (24 MWp) is the largest Italian on-grid photovoltaic plant.
 SunRay Renewable


                                                                                SYSTÈMES SOLAIRES        le journal du photovoltaïque                 N° 3 – 2010
                                                                          B A R O M È T R E P H O T OV O L T A Ï Q U E – E U R O B S E R V ’ E R – A V R I L 2 0 1 0
148
photovoltaic b arometer


                          Graph. n° 1
                          Évolution de la production de cellules de 2000 à 2009. Solar cell production 2000 to 2009.
                          Source : Photon International (mars 2010/March 2010).


                                        2000 2001 2002 2003 2004 2005 2006 2007 2008 2009


                          marché national. Comme un symbole, cet-                 comparés aux 7,9 GWc calculés en 2008 (gra-      ment s’expliquer par le délai nécessaire
                          te mauvaise année aura été fatale aux                   phique 1), soit une croissance de 56 %. La       entre la vente d’un module et son raccor-
                          usines madrilènes du groupe BP Solar,                   technologie polycristalline représenterait       dement. En effet, si une centrale est en
                          pourtant présent depuis plus de 25 ans                  46,9 % de la production totale (47,7 % en        cours d’installation, ou qu’elle est installée
                          dans le pays, l’industriel ayant choisi de              2008), le monocristallin 34,1 % (38,3 %          mais en attente de raccordement, la puis-
                          concentrer sa production sur les usines les             en 2008), les couches minces (CdTe, CIS,         sance des modules vendus ne sera pas
                          plus compétitives du groupe.                            a-Si/microcristalline et autres) 17,7 %          prise en compte dans les statistiques
                                                                                  (12,5 % en 2008) et le silicium ruban 1,4 %      nationales d’installation. L’augmentation
                          plus de 10 GWc produits dans                            (1,5 % en 2008).                                 de la taille du marché entraîne nécessaire-
                          le monde ?                                              Selon cette enquête, les principaux pays         ment une augmentation de l’écart entre le
                                                                                  producteurs de cellules sont la Chine avec       nombre des modules produits et celui des
                          La forte diminution des prix des systèmes               38 % (32,7 % en 2008), devant l’Allemagne        modules raccordés. Enfin, une partie de la
                          photovoltaïque montre que nous sommes                   15 % (18,5 % en 2008), le Japon 12,5 % (16 %     puissance installée peut échapper aux
                          clairement entrés dans une ère de surpro-               en 2008), Taïwan 12,2 % (11,6 % en 2008) et la   observateurs nationaux et ne pas être
                          duction. Reste à en mesurer l’ampleur.                  Malaisie 6,4 % (2,1 % en 2008) (graphique 2).    comptabilisée.
                          Deux organismes, le site Internet Solar-                Les principales régions de production sont
                          buzz, d’une part, et le magazine Photon                 l’Asie avec 76,1 % (68,3 % en 2008), l’Europe    actualités des principaux
                          International, d’autre part, ont établi leurs           19,4 % (25,5 % en 2008), l’Amérique 4,4 %        fabricants
                          propres estimations suite à des enquêtes                (5,5 % en 2008), enfin l’Afrique et le Moyen-
                          auprès des fabricants.                                  Orient 0,1 % (0,2 % en 2008). La production      L’industrie photovoltaïque de la produc-
                          Selon Solarbuzz, la production mondiale de              provenant d’Océanie n’est plus référencée        tion de cellules est très hétérogène. Elle se
                          cellules solaires a atteint un total de 9,34            en 2009 (0,5 % en 2008).                         compose d’acteurs de différentes tailles
                          GWc en 2009, comparée à une production                                                                   disposant de capacités de production de
                          de 6,85 GWc en 2008. Les cellules solaires en           L’estimation de Photon International est         plus d’un GWc à quelques MWc. Dans son
                          couches minces représenteraient 18 % de                 plus préoccupante pour l’industrie que cel-      enquête, Photon International a recensé la
                          la production totale, et les fabricants chi-            le de Solarbuzz, car elle indiquerait qu’une     production de 170 fabricants, les dix pre-
                          nois et taïwanais auraient porté leur part              part beaucoup plus importante que prévue         miers d’entre eux représentant moins de la
                          de marché mondial à 49 % toutes techno-                 de la production mondiale est actuelle-          moitié de la production mondiale (soit près
                          logies confondues. Les estimations de Pho-              ment stockée en usine, en attente de trou-       de 46 %). Le classement, en termes de puis-
                          ton International, également publiées en                ver acquéreur. Une partie de la différence       sance de cellules produites, des principaux
                          mars dernier, établissent la production                 entre les chiffres des capacités installées
                          mondiale de cellules à 12,3 GWc en 2009                 et les chiffres de production peut égale-


 SYSTÈMES SOLAIRES             le journal du photovoltaïque                  N° 3 – 2010
 P H O T OV O L T A I C B A R O M E T E R – E U R O B S E R V ’ E R – A P R I L 2 0 1 0
149


                                                                                                                                                                                      b aromètre photovoltaïque
ning to look dangerous for the global industry The situation                            ter. The Spanish market suffered a great blow from the collapse
will force the global photovoltaic industry to restructure and                          of its national market in a bad year, and as if to symbolise this,
benefit those players who are best armed to reduce costs.                               BP Solar, which has been in the country for over 25 years, is clos-
                                                                                        ing its Madrid plants and chosen to concentrate its manufac-
the european industry With its back to the Wall                                         turing in the group’s most competitive plants.

Against this background, the challenge will be harder for some over 10 GWp produced in the World?
European actors as they cope with the reductions in aid with
manufacturing in their own markets. European industrialists, The sharp drop in photovoltaic system prices demonstrates that
who succeed in consolidating their technological advance by we have clearly entered an era of overproduction, although its
significantly reducing manufacturing                                                       scale has yet to be gauged. Two organisa-
costs, should be able to weather the                                                       tions, the Solarbuzz website and oto
storm by accepting to relocate part of
their production and thus take part in
the future growth of the global market.
One of the keys to the survival of the
European industry will be to accentuate
the development of thin film technolo-
                                                            17,7 %
                                                       market share of thin
                                                                                           I ter t o

                                                                                           veys.
                                                                                                            magazine have made their
                                                                                           own estimates based on manufacturer sur-

                                                                                           According to Solarbuzz, global production
                                                                                           of solar cells came to a total of 9.34 GWp in
                                                                                           2009, as against 6.85 GWp in 2008. Appar-
                                                         films cells in 2009
gies, where the greatest potential for            la part de marché des cellules           ently thin film solar cell production
lean manufacturing lies. Many European                couches minces en 2009               accounts for 18% of all production and the
producers are currently developing new                                                     Chinese and Taiwanese manufacturers
technologies and processes that could overturn crystalline sil- now hold a 49% market share. oto I ter t o ’s estimates,
icon’s stronghold.                                                   also published last March put global cell production at 12.3 GWp
The European industry is going through a bad phase and is con- in 2009 as against its figure of 7.9 GWp in 2008 ( r p 1), which is
tinuing to lose market shares (see be o ). The German photo- up 56%. According to the magazine, polycrystalline technology
voltaic industry has not really capitalised on the global market
growth in 2009 or that of its own domestic market for that mat-


Tabl. n° 4
Les 10 premiers fabricants de cellules photovoltaïques (en MWc). The top 10 PV cell manufacturers (in MWp).

                  Entreprises                    Pays       Technologie des cellules*                          Production                   Production capacity
                  Companies                   Country              Cell technology*                                                                                     **

  First Solar                                     USA             Thin film (CdTe)                                              ,
                                                                        Crystalline
  Suntech Power                                China                (mono, multi)/
                                                             Thin film (a-Si, mc-Si)
                                                                        Crystalline
  Sharp                                         Japan               (mono, multi)/
                                                             Thin film (a-Si, mc-Si)
                                                                        Crystalline
  Q-Cells***                               Germany                  (mono, multi)/                         ,
                                                             Thin film (CIGS,CdTe)
  Yingli Green Energy                          China           Crystalline (multi)                         ,                    ,
                                                                          Crystalline
  JA Solar                                     China                    (mono, multi)
  Kyocera                                       Japan            Crystalline (multi)                                                                                 n.a.
                                                                          Crystalline
  Trina Solar                                  China                    (mono, multi)
  SunPower                       USA, Philippines               Crystalline (mono)
                                                                          Crystalline
  Gintech                                    Taiwan                     (mono, multi)
  * C e : te r re e c          (Cadmium teluride), -S : s c        orp e (amorphous silicon), c-S : s c      crocr st      (microcrystalline silicon),
  CIGS : c re                sé é     (copper indium galium diselenide), s c     o ocr st     (monocrystalline silicon), s c     po cr st       (multicrystalline silicon),
  ** Estimation. Est   te. Les décimales sont séparées par une virgule. ec      s re r tte        t    co    . Source : EurObserv'ER 2010.
  *** I c s s       eC     o G b et s         e co        e So bro G b . Included its subsidiary Calyxo GmbH and its joint venture Solibro GmbH.


                                                                                                      SYSTÈMES SOLAIRES             le journal du photovoltaïque              N° 3 – 2010
                                                                                               B A R O M È T R E P H O T OV O L T A Ï Q U E – E U R O B S E R V ’ E R – A V R I L 2 0 1 0
150
photovoltaic b arometer


                          fabricants a évolué par rapport à l’an der-                                                   ment mondial avec une production supé-                              Yingly 5e, Ja Solar 6e et Trina Solar 8e). Le
                          nier. Pour autant, comme en 2009, les                                                         rieure à 1 GWc (tableau 4). C’est la premiè-                        Japon ne compte plus que deux représen-
                          mêmes cinq nationalités (États-Unis, Chine,                                                   re fois qu’un fabricant uniquement spécia-                          tants (Sharp 3e et Kyocera 7e), Sanyo sortant
                          Japon, Allemagne et Taïwan) trustent les 10                                                   lisé dans les couches minces prend la tête                          du classement. Taïwan garde un représen-
                          premières places.                                                                             du classement mondial. Un autre acteur                              tant avec Gintech (10e) ainsi que l’Alle-
                          Le leadership échappe une nouvelle fois à                                                     américain, Sunpower, dont les capacités de                          magne avec Q-Cells (4e).
                          l’Asie. Le fabricant américain First Solar,                                                   production sont situées aux Philippines,
                          avec sa technologie couches minces au                                                         occupe la 9e place. Ce classement confirme                          First Solar n° 1
                          CdTe à moins d’un dollar le Wc, s’empare                                                      la montée en puissance des acteurs chinois                          First Solar peut être considéré comme le
                          pour la première fois de la tête du classe-                                                   avec 4 acteurs dans le “top ten” (Suntech 2e,                       mouton noir de l’industrie photovoltaïque.
                                                                                                                                                                                            Évoluant à contre-courant des principaux
                                                                                                                                                                                            fabricants de modules, il a démontré que le
                          Graph. n° 2                                                                                                                                                       tellurure de cadmium avait un avenir
                          Répartition géographique de la production en MWc de cellules photovoltaïque en                                                                                    radieux face au silicium cristallin. Ce choix
                          2008 et 2009. Geographic distribution of PV cells production MWp in 2008 and 2009.                                                                                lui permet aujourd’hui de briguer la pre-
                          Les décimales sont séparées par une virgule. ec    s re r tte                                                   t       co               .                        mière place des producteurs de cellules
                          Source : Photon International (mars 2010/March 2010).
                                                                                                                                                                                            photovoltaïques, en devenant le premier
                                                                                                                                                                                            fabricant mondial à dépasser le seuil du
                          Année/year                                                                                                                                                        GW produit en une année. L’entreprise a
                                                                                                             ,     –         , MWc/p                                                        annoncé une production de 1 112,6 MWc en
                                                                           ,       –           MWc/p             er c                                                                       2009, soit plus du double qu’en 2008 (504
                                                                                                 s                                                                                          MWc). 69,5 % de sa production proviennent
                                                                                                                                ,        –        MWc/p
                                                                                                                                    rc                         e E st                       de Malaisie, 17,5 % d’Allemagne et 13 % des
                                                                  ,         –    MWc/p
                                                                                                                                                                                            États-Unis. First Solar a annoncé au qua-
                                                                           est o E rope
                                                                                                                                                       ,           –            MWc/p       trième trimestre un coût de production de
                                                                                                                                                           str
                                  ,               –               , MWc/p                                                                                                                   ses modules de 0,84 $/Wc pour une effica-
                                                                  Ger                                                                                                                       cité de ces modules de 11,1 %, ce qui peut
                                                                                                                                                               ,            –       MWc/p
                                                                                                                                                           C
                                                                                                                                                                                            laisser rêveur un bon nombre de ses
                                          ,           –          MWc/p
                                                                                                                                                                                            concurrents.
                                                              est o s                                                                                                                       Après avoir nettement augmenté ses capa-
                                                                                                                                                                                            cités de production en 2009 (de 716 à 1 228
                                                                                                                                                                                            MWc), First Solar prévoit de faire une pau-
                                              ,           –           , MWc/p
                                                                         I                                                                                                                  se en 2010 à 1 282 MWc (854 MWc en Malai-
                                                                                                                                                               –                 MWc/p
                                                                                                                                                       p                                    sie, 214 MWc en Allemagne et 214 MWc en
                                                                                       ,       –    , MWc/p                                                                                 Ohio). De nouveaux investissements seront
                                                                                                                                                                                            ensuite réalisés en Malaisie (+ 428 MWc)
                                                                                                                                                                                            puis en France (+ 107 MWc), portant la capa-
                                                                                                                                                                                            cité à 1 816 MWc. L’usine française, dont la
                          Année/year                                                                                                                                                        construction devrait débuter durant la
                                                                                                                  ,     –      , MWc/p                                                      seconde moitié de l’année, sera située à
                                                                                                                      er c                                                                  Blanquefort, près de Bordeaux. Cette usine
                                                                       ,           –           , MWc/p
                                                                                                                                                                                            sera cofinancée par EDF Énergies Nou-
                                                                                                   s
                                                                                                                                     ,        –    MWc/p                                    velles, qui bénéficiera de la vente intégrale
                                                                                                                                         rc                                e E st
                                                              ,            –    , MWc/p                                                                                                     de la production durant les 10 premières
                                                                            est o E rope                                                                                                    années d’exploitation.
                                                                                                                                                                       –          , MWc/p   Sur le plan financier, First Solar a réalisé un
                                                  –                   , MWc/p                                                                              C                                chiffre d’affaires (“revenues” en anglais) en
                                                                      Ger
                                                                                                                                                                                            2009 à hauteur de 2 066,2 millions de dollars
                                                                                                                                                                                            comparés aux 1 246,3 millions de dollars
                                      ,               –            , MWc/p
                                                                                                                                                                                            générés en 2008. Son résultat net (“net inco-
                                                                  est o s
                                                                                                                                                                                            me”) a augmenté à 640,1 millions de dollars
                                                                                                                                                                                            en 2009 contre 348,3 millions de dollars en
                                      ,               –               , MWc/p
                                                                         I
                                                                                                                                                                                            2008. Pour cette année, l’Américain prévoit
                                                                                                                                                           ,           –          , MWc/p   des ventes nettes (“net sales”) de 2,7 et 2,9
                                                                               ,           –       , MWc/p                                                 p                                milliards de dollars et prévoit de consacrer
                                                                                                                                                                                            entre 500 et 550 millions de dollars en


 SYSTÈMES SOLAIRES             le journal du photovoltaïque                                                           N° 3 – 2010
 P H O T OV O L T A I C B A R O M E T E R – E U R O B S E R V ’ E R – A P R I L 2 0 1 0
153


                                                                                                                                                                      b aromètre photovoltaïque
 First Solar


                                                                                                               Opérateurs de l’usine de
                                                                                                               Francfort (Allemagne) du
                                                                                                               groupe First Solar
                                                                                                               Oper tors t t e F rst So r
                                                                                                                ro p’s Fr    rt ctor
                                                                                                               (Ger      )


accounts for 46.9% of total production (47.7% in 2008), monocrys- neWs from the main manufacturers
talline for 34.1% (38.3% in 2008), thin films (CdTe, CIS, a-Si/micro-
crystalline and others) for 17.7% (12.5% in 2008) and silicon ribbon The photovoltaic cell manufacturing industry is highly diversified
for 1.4% (1.5% in 2008).                                                  with players of different sizes with manufacturing capacities
According to their survey, the main cell producing countries are ranging from over one GWp down to a few MWp. oto I ter -
China with 38% (32.7% in 2008), ahead of Germany with 15% (18.5% t o ’s survey covered the production of 170 manufacturers. The
in 2008), Japan with 12.5% (16% in 2008), Taiwan with 12.2% (11.6% top ten account for less than half of worldwide production
in 2008) and Malaysia with 6.4% (2.1% in 2008) ( r p 2). The main (around 46%). The ranking of the main manufacturers in terms of
manufacturing regions are Asia with 76.1% (68.3% in 2008), Europe capacity of cells produced, has changed over the last 12 months
with 19.4% (25.5% in 2008), America with 4.4% (5.5% in 2008) and although, the same five nationalities monopolise the top 10 slots
Africa and the Middle-East with 0.1% (0.2%                                                         as in 2009 (the United States, China, Japan,
in 2008). Australasian manufacturing is no Most of the major cell manufacturers                    Germany and Taiwan).
longer listed in 2009 (0.5% in 2008).              are located in Asia. The European               Yet again leadership has evaded Asia. Amer-
    oto I ter t o ’s estimate gives more industry is still well represented                        ican manufacturer First Solar goes to the top
cause for concern for the industry than the with Q-Cells, the leading cell                         of the world ranks for the first time with over
Solarbuzz estimate because it indicates manufacturer, in addition to many                          one GWp of production (t b e 4) and its thin
that much more of global production than hefty industry players.                                   film CdTe technology achieved production
intended is currently held in stock awaiting La plupart des grands fabricants                      costs at under one dollar per Wp. This is also
purchasers to turn up. Part of the difference de cellules se situent en Asie.                      the first time that a manufacturer specialis-
between the installed capacity figures and L’industrie européenne reste bien                       ing exclusively in thin films takes the lead.
manufacturing figures may also be explai- représentée avec la présence de                          Another American player, Sunpower, whose
ned by the time lag between selling a mod- Q-Cells, premier fabricant mondial                      manufacturing facilities are located in the
ule and its connection to the grid. This is de cellules, et de nombreux acteurs                    Philippines, is in 9th place. This ranking con-
because the capacity of the modules sold de taille significative.                                  firms the build-up of Chinese manufacturing
will not be taken into account in the nation-                                                      capacity with 4 concerns in the top ten (Sun-
al installation statistics if a plant installation is underway, or if the tech –2nd, Yingly –5th, Ja Solar –6th and Trina Solar –8th). As Sanyo
plant is installed but awaiting connection to the grid. The increase has dropped out of the ranks, Japan only has two flag bearers left
in the size of the market evidently increases the gap between the (Sharp –3rd and Kyocera – 7th). Taiwan has one representative with
number of modules actually connected. Lastly, part of the installed Gintech (10th) and Germany one with Q-Cells (4th).
capacity may escape national observers and thus be left out of the
figures.


                                                                                      SYSTÈMES SOLAIRES        le journal du photovoltaïque                 N° 3 – 2010
                                                                                B A R O M È T R E P H O T OV O L T A Ï Q U E – E U R O B S E R V ’ E R – A V R I L 2 0 1 0
154
photovoltaic b arometer


                                                                                                                                                                        Suntech
                                        Département RD d’une usine
                                          chinoise du groupe Suntech
                                        ep rt e t o C ese p t
                                        o e b t e S tec ro p


                          dépenses de capital, en grande partie pour        (Nagano), a décidé de construire une nou-         nu net (“net income”) augmente légère-
                          financer son expansion en Malaisie.               velle unité de production de modules aux          ment à 91,5 millions de dollars (88,2 millions
                                                                            États-Unis, dans la ville de Goodyear en Ari-     de dollars en 2008).
                          Suntech ou le high-tech “made in                  zona. Cette usine, d’une capacité de pro-
                          China”                                            duction initiale de 30 MWc, pourra être           Sharp, toujours présent
                          L’industriel chinois s’est confortablement        étendue à 120 MWc. Elle devrait permettre         Sharp est, avec Kyocera, un des rares
                          installé à la deuxième place du classement        à Suntech de conforter son positionnement         acteurs historiques qui a su se maintenir
                          mondial avec une production de 704 MWc            sur le marché nord-américain.                     parmi les principaux producteurs. Selon
                          en 2009, contre 495 MWc en 2008. En 2009,         D’un point de vue technologique, Suntech          Photon international, le leader nippon
                          41 % de sa production ont été expédiés en         a démontré qu’une entreprise chinoise             gagne une place dans le classement mon-
                          Allemagne, 33 % dans le reste de l’Europe,        était capable de produire des cellules à          dial avec une production de 595 MWc (473
                          12 % en Asie, 10 % en Amérique du Nord, et        haut rendement. Le fabricant a en effet           MWc en 2008). Bien que la production de
                          4 % dans le reste du monde. Pour 2010, l’en-      annoncé avoir une nouvelle fois augmenté          Sharp soit majoritairement tournée vers les
                          treprise prévoit une augmentation de              le taux de rendement de ses cellules pro-         cellules mono et polycristallines (501 MWc
                          77,6 % de ses ventes (soit 1 250 MWc). Selon      duites avec la technologie Pluto. Celui           produits en 2009, + 15 % d’augmentation),
                          Suntech, 37 % de ses modules devraient            atteint désormais 19 % en monocristallin et       le fabricant a davantage développé son
                          être expédiés en Allemagne, 31 % dans le          17 % en polycristallin. La société prévoit        activité couches minces (94 MWc, + 147 %
                          reste de l’Europe, 16 % en Asie, 12 % en Amé-     d’en expédier 30 MWc durant la première           d’augmentation). Dans ce domaine, sa tech-
                          rique du Nord et 4 % dans le reste du mon-        moitié de l’année et 150 MWc dans la              nologie consiste en une triple jonction
                          de. Ce niveau de production lui permettrait       deuxième moitié de l’année. Cette techno-         constituée de 2 couches de silicium amor-
                          de devenir le nouveau leader mondial dès          logie a été développée dès l’origine par Sun-     phe et d’une couche de silicium microcris-
                          cette année. La capacité de production            tech en collaboration avec l’université de        tallin. Sharp est resté discret sur ses capa-
                          devrait être augmentée à 1,4 GWc dès la mi-       Nouvelle-Galles du Sud, située à Sydney en        cités de production. La dernière annonce a
                          2010 contre 1,1 GWc à la fin de l’année 2009.     Australie.                                        été faite en mars 2008 quand l’entreprise a
                          450 MWc seront consacrés à sa technologie         Enfin, sur le plan financier, la baisse du prix   annoncé l’ouverture d’une nouvelle usine
                          Pluto à haut rendement (lire plus loin).          de vente des cellules explique la diminu-         de fabrication de couches minces à Sakai
                          L’entreprise, qui dispose de 5 sites de pro-      tion du chiffre d’affaires de l’entreprise        (Japon) en mars 2010, d’une capacité initiale
                          duction, dont quatre en Chine (Wuxi,              (1 693,3 millions de dollars en 2009 contre
                          Luoyang, Qinghai, Shanghai) et un au Japon        1 923,5 millions de dollars en 2008). Le reve-


 SYSTÈMES SOLAIRES             le journal du photovoltaïque               N° 3 – 2010
 P H O T OV O L T A I C B A R O M E T E R – E U R O B S E R V ’ E R – A P R I L 2 0 1 0
157


                                                                                                                                                                     b aromètre photovoltaïque
First Solar no. 1                                                         Pluto technology for its monocrystalline cells and 17% for its poly-
First Solar is akin to the black sheep of the photovoltaic industry. crystalline cells. It is planning to ship 30 MWp of these cells over the
It has demonstrated that cadmium telluride has a glorious future first half of the year and 150 MWp in the second half of the year. This
ahead of it as opposed to crystalline silicon by developing against technology was developed from the outset by Suntech in conjunc-
the tide of the main module manufacturers. Opting for this choice tion with the University of New South Wales in Sydney, Australia.
now enables it to run for the top PV cell producer slot, by becom- Turning to finance, the reason for the company’s lower sales figures
ing the first world manufacturer to pass the one GWp manufac- (1 693.3 million dollars in 2009 as against 1 923.5 million dollars in
tured mark in a single year. The manufacturer’s declared produc- 2008) is the drop in cell sales prices. Net income rose slightly to 91.5
tion figure of 1 112.6 MWp in 2009, more than doubles its 2008 million dollars (88.2 million dollars in 2008).
output (504 MWp). Of this, 69.5% was produced in Malaysia, 17.5%
in Germany and 13% in the United States. In the fourth quarter, the Sharp, still in the running
industrialist announced the production cost of its modules at Sharp, together with Kyocera, is one of the few historical actors that
$0.84/Wp for a 11.1% module efficiency, which is beyond many of have been able to stay up in the top producer ranks. According to
its competitors’ wildest dreams.                                              oto      ter t o , the Japanese leader moved up one place in
Having boosted its manufacturing capacities in 2009 (from 716 the world ranks with output of 595 MWp (473 MWp in 2008).
to 1 228 MWp), First Solar is intending to take a breather in 2010 Although Sharp’s manufacturing is primarily geared to mono and
at 1 282 MWp (854 MWp in Malaysia, 214 MWp in Germany and polycrystalline cells (501 MWp produced in 2009, a 15% increase),
214 MWp in Ohio). New investments will then be made in the Japanese manufacturer has developed its thin film business fur-
Malaysia (a further 428 MWp) then in France (a further 107 MWp), ther (94 MWp, a 147% increase).
increasing capacity to 1 816 MWp. Con-                                                             Sharp’s thin film technology consists of a
struction work should start in the second                                                          triple-junction made up of 2 amorphous sili-
half of the year on the French factory at
Blanquefort near Bordeaux. This plant will
                                                  1 250                         p/MWc              con films and a microcrystalline silicon film.
                                                                                                   Sharp is guarded about disclosing its manu-
be co-financed by EDF Énergies Nouvelles               Suntech’s expected sales in 2010            facturing capacities. The latest announce-
which will benefit from all the production Ventes attendues de Suntech en 2010 ment was made in March 2008 when the
sold for the first decade’s operation.                                                             manufacturer announced it would be open-
First Solar’s revenues for 2009 were 2 066.2 million dollars as ing a new thin film manufacturing plant at Sakai in March 2010,
against 1 246.3 million dollars generated in 2008. Its net income with an initial capacity of 480 MWp, which should rise to 1 GWp over
increased to 640.1 million dollars in 2009 as against 348.3 million the year.
dollars in 2008. The American manufacturer is forecasting sales More recently Sharp announced that it had entered an agreement
revenues of between 2.7 and 2.9 billion dollars and is intending to with Italian power company Enel Green Power and STMicroelec-
earmark 500 to 550 million dollars in capital expenditure, largely tronics (STM) to set up a common subsidiary to manufacture thin
to finance its expansion in Malaysia.                                     film cells. Construction work on the factory should start at the
                                                                          beginning of 2011 in STM’s current Italian plant at Catania in Sicily.
Suntech or high tech made in China                                      Its initial production capacity will be 160 MWp per year, which could
The Chinese industrialist is sitting comfortably in second place in the be increased to 460 MWp.
world rankings with output of 704 MWp in 2009, as against 495 MWp
in 2008. In 2009, 41% of its production was shipped to Germany, 33% Q-Cells “reloaded”
to the rest of Europe, 12% to Asia, 10% to North America, and 4% to Q-Cells was the top world manufacturer in 2008 but only increased
the rest of the world. The company expects its sales to increase by its output by 5 MWp to 586 MWp, hence it tumbled to fourth place
77.6% in 2010, (namely 1 250 MWp). According to Suntech, 37% of its in the world ranks, just behind Sharp. This production figure breaks
modules will be shipped to Germany, 31% to the rest of Europe, 16% down into 511 MWp from its main German plant at Thalheim, and
to Asia, 12% to North America and 4% to the rest of the world. This also includes 20 MWp from its Malaysian plant, 14 MWp from Soli-
output level should let it sail past the other manufacturers as of this bro, a German subsidiary specialised in CIGS (Copper indium gal-
year. Its manufacturing capacity should rise to 1.4 GWp by the midd- lium diselenide) thin film technology and 1 MWp from Calyxo
le of the year as against 1.1 GWp at the end of 2009. Of this capacity GmbH, its other German subsidiary specialised in CdTe technology.
450 MWp will be devoted to its high yield Pluto technology (see The year was very hard for the leading German manufacturer
be o ).                                                                   which was badly hit by the slump in module prices. In 2009 Q-Cells
The company, which has 5 manufacturing sites – four in China (Wuxi, recorded a loss of 1.36 billion euros, while its sales contracted by
Luoyang, Qinghai and Shanghai) and one in Japan (Nagano), has deci- 35% to 801 million euros. Q-Cells embarked on a recovery plan (dub-
ded to construct a new module manufacturing plant in the United bed “Q-Cells reloaded”) combined with the strategic reorientation
States, in the city of Goodyear, Arizona. This plant will have an initial of its businesses. The company primarily envisages closing four pro-
manufacturing capacity of 30 MWp that may be extended to 120 duction lines in its Thalheim plant that corresponds to a capacity
MWp. It should allow Suntech to strengthen its market positioning of 360 MWp (of the plant’s 760-MWp capacity). It is also planning to
in North America.                                                         invest a sum of 150 to 200 million euros, primarily to develop the
Suntech has proven that a Chinese firm is technically capable of capacities of its new manufacturing plant in Malaysia, which
manufacturing high-yield cells. The manufacturer has announced
that it has increased the yield rate of its cells yet again by using 19%


                                                                                     SYSTÈMES SOLAIRES        le journal du photovoltaïque                 N° 3 – 2010
                                                                               B A R O M È T R E P H O T OV O L T A Ï Q U E – E U R O B S E R V ’ E R – A V R I L 2 0 1 0
158
photovoltaic b arometer


                          de 480 MWc, qui devait être portée à 1 GWc        modules. Q-Cells a enregistré en 2009 une       d’euros et sur une amélioration significati-
                          durant l’année. Plus récemment, Sharp a           perte de 1,36 milliard d’euros, tandis que      ve du résultat d’exploitation.
                          annoncé la signature d’un accord avec             son chiffre d’affaires a chuté de 35 % à 801
                          l’électricien italien Enel Green Power et ST      millions d’euros. Q-Cells a entamé un plan      SolarWorld, nouveau milliardaire
                          Microelectronics (STM) visant l’établisse-        de redressement (nommé “Q-Cells reloa-          européen
                          ment d’une filiale commune ayant pour             ded”) associé à une réorientation straté-       Tous les acteurs européens ne sont pas en
                          objet de produire des cellules couches            gique de ses activités. L’entreprise prévoit    difficulté. Certains tirent leur épingle du
                          minces. Cette usine, dont la construction         notamment de supprimer quatre lignes de         jeu, à l’image de SolarWorld. Bien que le
                          devrait débuter au début de l’année 2011          production dans son usine de Thalheim,          fabricant allemand ne fasse pas partie du
                          dans l’actuelle usine italienne de STM            soit une puissance de 360 MWc sur les 760       top ten des principaux producteurs de cel-
                          (située à Catane, en Sicile), disposera d’une     MWc de capacité de l’usine. Elle compte         lules photovoltaïques, il est tout de même
                          capacité initiale de 160 MWc qui pourra           également investir entre 150 et 200 millions    un leader au plan mondial. L’entreprise a
                          être étendue à 460 MWc.                           d’euros, notamment pour développer les          fait un choix différent, celui de disposer des
                                                                            capacités de sa nouvelle usine de produc-       capacités de production tout au long de la
                          Q-Cells “reloaded”                                tion en Malaisie, qui devrait atteindre 600     chaîne de valeur (des plaquettes de silicium
                          Premier fabricant mondial en 2008, Q-Cells        MWc fin 2010. Le nouveau patron du groupe,      jusqu’aux modules). Elle possédait ainsi, à
                          n’a augmenté sa production que de 5 MWc           Nedim Cen, a annoncé que la restructura-        la fin de l’année 2009, une capacité de pro-
                          à 586 MWc le reléguant ainsi à la quatrième       tion allait se poursuivre. Le groupe a déjà     duction de 900 MWc de wafers, de 450 MWc
                          place du classement mondial, juste derrière       supprimé 500 emplois sur 2 600 en 2009.         de cellules et de 500 MWc de modules. La
                          Sharp. Cette production provient à 511            Q-Cells a également annoncé avoir résolu        pleine utilisation de ses capacités de pro-
                          MWc de sa principale usine allemande de           son différend avec son fournisseur chinois      duction, malgré la conjoncture difficile qui
                          Thalheim. Elle comprend également 20              de wafers LDK Solar et décidé de pour-          a marqué l’année 2009, a permis à l’entre-
                          MWc de son usine malaisienne, 14 MWc pro-         suivre leur collaboration. Les deux sociétés    prise de dépasser ses objectifs en matière
                          venant de Solibro, une filiale allemande          ont convenu d’assouplir le calendrier de        de chiffre d’affaires et de réaliser un résul-
                          spécialisée dans la technologie couches           livraisons des produits et d’instaurer un       tat satisfaisant au niveau global. Solar-
                          minces CIGS (cuivre, indium, gallium, sélé-       prix flexible basé sur le prix du marché. Les   World AG a réalisé en 2009 un chiffre d’af-
                          nium) et 1 MWc provenant de Calyxo GmbH,          prix préalablement négociés avec LDK            faires de 1  012,6 millions d’euros contre
                          son autre filiale allemande spécialisée dans      Solar étaient devenus beaucoup plus éle-        900,3 millions en 2008, soit une progression
                          la technologie CdTe.                              vés que le prix de marché, grevant un peu       de 12,5 %. Le résultat d’exploitation avant
                          L’année aura été très difficile pour le pre-      plus la compétitivité du fabricant allemand.    intérêt et impôt est marqué par une forte
                          mier fabricant allemand, qui a fortement          Pour 2010, l’entreprise mise sur un chiffre
                          souffert de la diminution du prix des             d’affaires compris entre 1 et 1,2 milliard


                                                                                                                                                                       SolarWorld


                                                                                                                      Blocs de polysilicium prêts à être
                                                                                                                      transformés en lingot de silicium cristallin,
                                                                                                                      usine du groupe SolarWorld
                                                                                                                        oc s o      er s co re    to be
                                                                                                                      co erte      to cr st   e s co          ots,
                                                                                                                      So r or       ro p pro ct o


 SYSTÈMES SOLAIRES             le journal du photovoltaïque               N° 3 – 2010
 P H O T OV O L T A I C B A R O M E T E R – E U R O B S E R V ’ E R – A P R I L 2 0 1 0
159


                                                                                                                                                                                     b aromètre photovoltaïque
Graph. n° 3                                                                               ning to use this capital base to increase its wafer and module manu-
Comparaison de la tendance actuelle avec les objectifs                                    facturing capacities by the end of the year to 1 250 MWp, by concen-
du Livre blanc (en MWc). Comparison of the present trend                                  trating production at its Freiberg (Germany) and Hillsboro (United
with the White paper objectives (in MWp)                                                  States) sites. As SolarWorld prefers to increase demand from its cell
Les décimales sont séparées par une virgule. Decimals are written with a
                                                                                          suppliers, its cell manufacturing capacities will increase less rapidly
comma. Source : EurObserv'ER 2010.                                                        to 750 MWp. The company also plans to rely on its own raw materials
                                                                                          production. In March 2010, SolarWorld announced the setting up of
                                                                                          an agreement for the creation of a common subsidiary with Qatar
                                                                                          Solar Technologies and Qatar Foundation. All in all 500 million doll-
                                                                                          ars should be invested in the construction of a silicon production site
                                                                                          in Qatar.
                                             ,


                                                                                          2010, a record-breaking year
                             ,
                                                                                          Everybody agrees that European market growth will again be at
                                                                                          the heart of world growth in 2010. The question is how far the
            ,                                                                             European Union countries can go, in the knowledge that this
                                                                                          growth will not be fettered by the availability of modules. All eyes
                                                                               ite aper
                                                                           Livre blanc


                                                                                          will be trained on the German market and its capacity to absorb
                                                                                          a major share of world production yet again. The more penalizing
                                                                                          feed-in tariff sliding scale will not come into force before July,
                                                                                          which if what happened in Spain is anything to go by, should lead
       2007           2008            2009                 2010
                                                                                          to a rush for installations. Another market-friendly element is that
                                                                                          the generalised overproduction should once again lead manu-
                                                                                          facturers to reduce their profit margins, even if this reduction will
should be producing 600 MWp by the end of 2010. The group’s new                           be much smaller than in 2009. European markets have shown that
boss, Nedim Cen, announced that the restructuring would go ahead                          they are sensitive to this price elasticity and so a drop in prices
and 500 of its 2 600 jobs were shed in 2009.                                              will by force enhance the market.
Q-Cells also announced that it had resolved its dispute with its Chi-                     A recent Barclays Bank study revealed its estimates of the German
nese wafer supplier LDK Solar and has decided to continue wor-                            market 2010 as being 35% up at 4 093 MWp. It could turn out to be
king together. The two companies have agreed to relax the product                         much higher, closer to 4 500 MWp, or even 5 000 MWp. Elsewhere
delivery schedule and introduce a flexible price schemes based on                         in Europe, new installation records are awaited in the Czech
market price. The prices previously negotiated with LDK Solar had                         Republic (1 150 MWp more expected according to the Ministry of
risen much higher than the market price, harming the German                               Industry and Trade), Italy (1 000 MWp more according to ENEA) and
manufacturer's competitiveness even more. The company is bank-                            France (500 MWp more according to Observ’ER). There are some
ing on sales figures of 1 to 1.2 billion euros for 2010, and a signifi-                   doubts about the capacity approved by the Spanish authorities
cant improvement in its operating results.                                                (theoretically capped at 502 MWp in 2010) and Belgium’s capaci-
                                                                                          ties to maintain its high installation level (200 MWp more expect-
SolarWorld, the new European billionaire                                                  ed according to EDORA).
Not all the European actors are in difficulty. Some of them, like Solar-                  EurObserv’ER has revised its 2010 market forecast quite dramati-
World, are pulling through. Although the German manufacturer is                           cally in the light of these new estimates. Our new estimate is
not one of the top ten photovoltaic cell producers, it is still a leader                  totalised at 23 700 MWp at the end of 2010 ( r p 3), which is
on a world level. The company has gone down a different route,                            almost eight times more than the 1997 European Commission
having manufacturing capacities all along the value chain (from sili-                     White Paper targets for renewable energies. It is true that every
con wafers to modules). Thus it had a wafer production capacity of                        year the solar electricity market dynamics surprise even the sec-
900 MWp, 450 MWp of cells and 500 MWp of modules at the end of                            tor’s professionals. The proven capacity of manufacturers to
2009. The company exceeded its sales targets and achieved an ove-                         reduce their production costs, while achieving increasingly high
rall satisfactory result by harnessing its manufacturing capacities to                    yields, opens up new horizons to the sector and a much sunnier
the full despite the tight situation that characterised 2009. In 2009                     outlook for future generations. 
SolarWorld AG’s sales figure was 1 012.6 million euros as against 900.3
million in 2008, rising by 12.5%. Earnings before interest and taxes
were marked by a sharp drop in module prices, shrinking from 263.3
million euros in 2008 to 151.8 million euros, with a net annual profit
of 91.4 million euros in 2009 as against 135.2 million euros in 2008.                                                      The next barometer will be
The company issued a bond for the sum of 400 million euros in Janua-                                                       about the solar thermal sector
ry, to cover its short- and medium-term growth targets, thereby                                                            Le prochain baromètre traitera
increasing its cash assets to 900 million euros. The company is plan-                                                      du solaire thermique


                                                                                                     SYSTÈMES SOLAIRES        le journal du photovoltaïque                 N° 3 – 2010
                                                                                               B A R O M È T R E P H O T OV O L T A Ï Q U E – E U R O B S E R V ’ E R – A V R I L 2 0 1 0
160
photovoltaic b arometer


                          Télécharger/Download                                                                             ché de l’électricité solaire étonne même les
                                                                                                                           professionnels de la filière. La capacité
                           EurObserv’ER met à disposition sur             EurObserv’ER is posting an interactive           démontrée des fabricants à réduire leurs
                           www.energies-renouvelables.org (langue         database of the barometer indicators on          coûts de production, tout en affichant des
                           française) et www.eurobserver.org              the www.energies-renouvelables.org               rendements de plus en plus élevés, ouvre
                           (langue anglaise) une base de donnée           (French-language) and                            des horizons nouveaux à la filière et un ave-
                           interactive des indicateurs du baromètre.      www.eurobserv-er.org (English-                   nir beaucoup plus ensoleillé pour les géné-
                           Disponible en cliquant sur le bandeau          language) sites. Click the “Interactive          rations futures. 
                           “Interactive EurObserv’ER Database”,           EurObserv’ER Database” banner to
                           cet outil vous permet de télécharger les       download the barometer data in Excel
                           données du baromètre sous format Excel.        format.                                          Sources : IDAE (Spain), ZSW (Germany), ENEA (Italy),
                                                                                                                           SOeS (France), ADEME (France), EDP (Portugal), APE-
                                                                                                                           RE (Belgium), Ministry of industry and trade (Czech
                          baisse du prix des modules. Il diminue à mand et sur sa capacité à absorber une fois             Rep.), Helapco (Greece), Oemag (Austria), CertiQ
                          151,8 millions d’euros contre 263,3 millions de plus une part importante de la produc-           (Netherlands), Angstrom Solar (Sweden), CL SENES
                          en 2008. Le bénéfice net annuel s’élève à tion mondiale. La dégressivité accrue du               BAS (Bulgaria), IJS (Slovenia), Cyprus Energy Institu-
                          91,4 millions d’euros contre 135,2 millions tarif d’achat n’interviendra pas avant le            te, EPIA, Enovos (Luxembourg), PA Energy (Den-
                          d’euros en 2008.                               mois de juillet, ce qui devrait, à l’image de     mark), ICPE (Romania), MRA (Malta), Solart System
                          Afin d’assurer ses objectifs de croissance à ce qui s’est passé en Espagne en 2008,              (Hungary), Energy Center Bratislava (Slovakia), IPE
                          court et à moyen terme, l’entreprise a émis déboucher sur une course à l’installation.           (Latvia), TTU (Estonia), EPIA. Special thanks to the PV
                          en janvier une obligation d’un montant de Autre élément favorable pour les marchés,              Centre of Warsaw University of Technology for their
                          400 millions d’euros, augmentant ses li- la surproduction généralisée devrait une                contribution to the EurObserv’ER project by sharing
                          quidités disponibles à 900 millions d’euros. nouvelle fois conduire les fabricants à rédui-      their data collection from several new member
                          Avec cette assise financière, l’entreprise re leur marge, même si cette réduction de-            countries.
                          prévoit d’augmenter d’ici la fin de l’année vrait être beaucoup plus mesurée qu’en
                          ses capacités de production de wafers et de 2009. Les marchés européens ont montré
                          modules à 1250 MWc, concen-                                   qu’ils étaient sensibles à cette
                          trant sa production sur ses                                   élasticité des prix, une dimi-


                                                            1 012,6
                          sites de Freiberg (Allemagne)                                 nution des prix accroissant         Ce baromètre a été réalisé par Observ’ER
                                                                                                                            dans le cadre du projet “EurObserv’ER”
                          et de Hillsboro (États-Unis).                                 nécessairement le marché.
                                                                                                                            regroupant Observ’ER (FR), ECN (NL),
                          Les capacités de production                                   Une étude récente de la ban-        Eclareon (DE), Institute for Renewable
                                                            millions€/million €
                          de cellules augmenteront                                      que Barclays a relevé ses esti-     Energy (EC BREC I.E.O, PL), Jozef Stefan
                          moins rapidement à 750 MWc, le chiffre d’affaires de mations du marché allemand                   Institute (SL), avec le soutien financier
                                                              SolarWorld en 2009                                            de l’Ademe et de la DG Tren (programme
                          SolarWorld préférant sollici-                                 2010 de 35 % à 4 093 MWc. La        “Énergie Intelligente-Europe”), et publié
                          ter davantage ses fournis-            the SolarWorld          réalité pourrait être bien          par Systèmes Solaires – Le Journal
                          seurs de cellules. L’entreprise      revenues in 2009         supérieure, davantage proche        des Énergies Renouvelables. Le contenu
                          prévoit également de s’ap-                                    des 4 500 MWc, voire même           de cette publication n’engage que
                                                                                                                            la responsabilité de son auteur
                          puyer sur sa propre production de matières des 5000 MWc. Ailleurs en Europe, on attend            et ne représente pas l’opinion
                          premières. En mars dernier, elle a annoncé de nouveaux records d’installation, en                 de la Communauté européenne.
                          la mise en place d’un accord pour la création République tchèque (+ 1 150 MWc attendus            La Commission européenne n’est pas
                          d’une filiale commune avec Qatar Solar selon le ministère de l’Industrie et du Com-               responsable de l’usage qui pourrait être
                                                                                                                            fait des informations qui y figurent.
                          Technologies et Qatar Foundation. Au total, merce), en Italie (+ 1 000 MWc selon l’ENEA)
                          500 millions de dollars devront être investis et en France (+ 500 MWc selon l’association         This barometer was prepared by
                          dans la construction d’un site de production Observ’ER). Quelques interrogations demeu-           Observ’ER in the scope of the
                                                                                                                            “EurObserv’ER” Project which groups
                          de silicium dans l’émirat du Qatar.            rent sur la puissance qui sera validée par les
                                                                                                                            together Observ’ER (FR), ECN (NL),
                                                                         autorités espagnoles (théoriquement pla-           Eclareon (DE), Institute for Renewable
                                                                         fonnée à 502 MWc en 2010) et sur les capa-         Energy (EC BREC I.E.O, PL), Jozef Stefan
                          2010, année de toUs                            cités de la Belgique à maintenir un haut           Institute (SL), with the financial support
                                                                                                                            of Ademe and DG Tren (“Intelligent
                          Les records                                    niveau d’installation (+ 200 MWc attendus
                                                                                                                            Energy-Europe” programme), and
                                                                         selon EDORA).                                      published by S stè es So res –
                          De l’avis de tous, la croissance du marché Ces nouvelles estimations ont conduit                  Le o r       es É er es e o e b es.
                          européen de l’année 2010 sera une fois de EurObserv’ER à augmenter nettement sa                   The sole responsibility for the content
                                                                                                                            of this publication lies with the authors.
                          plus au cœur de la croissance mondiale. La prévision du marché 2010. Nous prévoyons
                                                                                                                            It does not represent the opinion
                          question est de savoir jusqu’où les pays de 23 700 MWc cumulés à la fin de l’année 2010           of the European Communities.
                          l’Union européenne pourront aller, sachant (graphique 3), soit près de huit fois les objec-       The European Commission is not
                          que cette croissance ne sera pas contrain- tifs définis par le Livre blanc européen des           responsible for any use that may be
                                                                                                                            made of the information contained
                          te par la disponibilité de modules. Tous les énergies renouvelables de 1997. Il est vrai
                                                                                                                            therein.
                          regards se porteront sur le marché alle- que, chaque année, la dynamique du mar-


 SYSTÈMES SOLAIRES             le journal du photovoltaïque             N° 3 – 2010
 P H O T OV O L T A I C B A R O M E T E R – E U R O B S E R V ’ E R – A P R I L 2 0 1 0

Eurobserver Pv Barometer 2009

  • 1.
    128 photovoltaic b arometer Juwi Centrale terrestre de Mehringer Höhe (Allemagne), 3,5 MWc de puissance. e r er ö e 3.5- p c p c t ro -b se po er p t Ger . SYSTÈMES SOLAIRES le journal du photovoltaïque N° 3 – 2010 P H O T OV O L T A I C B A R O M E T E R – E U R O B S E R V ’ E R – A P R I L 2 0 1 0
  • 2.
    15 861,2 MWc/MWp 129 b aromètre photovoltaïque dans l’UE/in the EU BaroMètrE PHotoVoLtaÏQUE PHoToVoLTAIC bAromETEr Une étude réalisée par EurObserv’ER. st c rr e o t b E rObser ’E . e marché mondial du photovoltaïque a heglobalphotovoltaicmarketexpanded Lcontinuésaprogressionen2009.L’ondede Tagainin2009.Germanysetanewsystem chocgénéréeparleverrouillagedumarchéibé- installationrecordwhilethecapacitybuild-up riqueapuêtrecontenuegrâceàunnouveau ofthemajorsolarphotovoltaicmarketscon- record d’installation en allemagne et par la tainedthefalloutgeneratedbytheIberian montée en puissance des nouveaux grands marketderailment.TheEuropeanUnionhas marchés du solaire photovoltaïque. L’Union thehighestphotovoltaicplantcapacity,with européenneresteleprincipallieud’implanta- almost5.5GWpinstalledin2009. tiondescentralesphotovoltaïques,avecprès de5,5GWcinstallésdurantl’année2009. 78,1 % de la puissance installée dans le monde +5485,1 MWc/MWp installés dans l’UE durant l’année 2009 +52,9 % croissance du parc de l’UE en 2009 l’ont été dans l’UE additional capacity installed entre 2008 et 2009 of the 2009 world installed capacity in the EU during 2009 growth of the EU installed base was in the EU between 2008 and 2009 SYSTÈMES SOLAIRES le journal du photovoltaïque N° 3 – 2010 B A R O M È T R E P H O T OV O L T A Ï Q U E – E U R O B S E R V ’ E R – A V R I L 2 0 1 0
  • 3.
    130 photovoltaic b arometer es premières estimations des princi- l’énergie (AIE PVPS) à celles récemment deux installations allemandes, celle de L paux marchés mondiaux du photo- voltaïque établissent une puissance supplémentaire de l’ordre de 7 GWc, soit publiées par l’Epia (Association de l’in- Strasskirchen (54 MWc) et celle de Lieberose dustrie photovoltaïque européenne), le (53 MWc), mises en service en 2009. Le grou- marché japonais passerait de 225,3 à 484 pe américain SunEdison a même annoncé une croissance de l’ordre de 16,6 % par rap- MWc et celui des États- en mars dernier la construc- port à 2008 (6 GWc). Ce chiffre reste provi- Unis de 338 à 475 MWc, soit Le marché chinois tion d’une centrale de 72 soire et pourrait être consolidé à la hausse respectivement les troisiè- devrait atteindre au MWc dans la province ita- dans les prochains mois. Pour cette même me et quatrième marchés moins 500 MWc en 2010. lienne de Rovigo en Vénétie raison, le niveau d’installation de 2008 est mondiaux. Le marché chi- The Chinese market (nord-est de l’Italie). La nettement supérieur à celui annoncé dans nois est également très should rise to at least construction commencera notre précédent baromètre (Systèmes prometteur. Le CREIA (Chi- 500 MWp in 2010. au début du second se- Solaires, Le Journal du Photovoltaïque n° 1). nese Renewable Energy mestre 2010 et sera pleine- La plus forte consolidation vient d’Alle- Industries Association, Association des ment opérationnelle en fin d’année. Par magne, où l’Agence fédérale du réseau industries chinoises des énergies renou- comparaison, la plus grande centrale pho- (Bundesnetzagentur) a, pour la première velables) estime ce marché à 215 MWc en tovoltaïque sur toiture, installée en 2008 sur fois, publié un historique précis des rac- 2009. Il devrait, selon cette même source, l’usine de General Motors à Saragosse, en cordements photovoltaïques bénéficiant atteindre au moins 500 MWc en 2010, et Espagne, atteint 11,8 MWc de puissance. de la loi énergies renouvelables (EEG). peut-être même dépasser le GWc. Le marché des applications non reliées au La croissance mondiale enregistrée en La forte augmentation du volume d’instal- réseau progresse également, mais il est 2009 sera cependant plus faible qu’en lation réalisée ces deux dernières années plus difficile à mesurer faute d’études 2008, année où le marché avait plus que s’explique principalement par une hausse exhaustives. Ce marché est de plus en plus doublé par rapport à 2007. Hors Union de la rentabilité financière des projets de tourné vers les applications non domes- européenne (UE), les marchés américains grande puissance. On commence même à tiques (infrastructure de télécommunica- et japonais restent les plus importants. Si voir apparaître des centrales terrestres de tion, éclairage public, chargeurs pour télé- l’on compare les données d’installations plusieurs dizaines de mégawatts. Actuelle- phone et portable, bornes autoroutières, de 2008 des experts nationaux du Pro- ment, la plus grande ferme solaire en Euro- parcmètres, etc.). gramme des systèmes d’alimentation pho- pe, construite en 2008, de 60 MWc, est située tovoltaïques de l’Agence internationale de à Olmedilla, en Espagne. Elle est suivie de Installation d’un système photovoltaïque intégré sur un hangar agricole. I st to o te r te p oto o t c s ste o rc t r b r . Drachenbronn (Alsace, France). Ademe SYSTÈMES SOLAIRES le journal du photovoltaïque N° 3 – 2010 P H O T OV O L T A I C B A R O M E T E R – E U R O B S E R V ’ E R – A P R I L 2 0 1 0
  • 4.
    131 b aromètre photovoltaïque irst estimates of the main global photovoltaic markets put America and Japan are the biggest markets outside the European F additional capacity at around 7 GWp, equivalent to 16.6% growth over 2008 (6 GWp). However this is a provisional fig- ure, which could be revised upwards in the coming months, in the Union. The Japanese market will rise from 225.3 to 484 MWp and the US market from 338 to 475 MWp, making them the number three and number four world markets respectively, if we compare same way the 2008 installation level is much higher than we pre- the 2008 installation data from the IEA PVPS national experts with dicted in our previous barometer (Systèmes Solaires, Le Journal du the recent EPIA (European Photovoltaic Industry Association) Photovoltaïque n° 1). The highest consolidation was in Germany data. The Chinese market is also full of promise with CREIA (the where for the first time the Federal Network Agency (Bundesnet- Chinese Renewable Energies Industry Association) putting this zagentur) published an accurate log of photovoltaic system con- market at 215 MWp in 2009, reckoning that it should rise to at least nections that were assisted by the renewable energies law (EEG). 500 MWp in 2010, and possibly pass the 1 GWp mark. However world growth recorded for 2009 will fall short of its 2008 performance, when the market more than doubled its 2007 level. Tabl. n° 1 Puissance photovoltaïque installée dans l’Union européenne durant l’année 2008 et 2009* (en MWc). Photovoltaic capacity installed in the European Union during 2008 and 2009* (in MWp). 2008 2009* Réseau Hors réseau Réseau Hors réseau Total Total On-grid Off-grid On-grid Off-grid Germany , , , , , , Italy , , , , , , Czech Republic , , , , , , Belgium , , , , , , France , , , , , , Spain , , , , , , Greece , , , , , , Portugal , , , , , , United Kingdom , , , , , , Netherlands , , , , , , Slovenia , , , , , , Austria , , , , , , Bulgaria , , , , , , Finland , , , , , , Luxembourg , , , , , , Denmark , , , , , , Malta , , , , , , Cyprus , , , , , , Sweden , , , , , , Hungary , , , , , , Romania , , , , , , Slovakia , , , , , , Estonia , , , , , , Poland , , , , , , Lithuania , , , , , , Ireland , , , , , , Latvia , , , , , , totalEU27 5064,432 9,696 5074,128 5474,867 10,276 5485,143 *Estimation. Est te. – Les décimales sont séparées par une virgule. ec s re r tte t co . Source : EurObserv'ER 2010. SYSTÈMES SOLAIRES le journal du photovoltaïque N° 3 – 2010 B A R O M È T R E P H O T OV O L T A Ï Q U E – E U R O B S E R V ’ E R – A V R I L 2 0 1 0
  • 5.
    132 photovoltaic b arometer Tabl. n° 2 Puissance photovoltaïque cumulée dans les pays de l’Union européenne en 2008 et 2009* (en MWc). Cumulated photovoltaic capacity in the European Union countries at the end of 2008 and 2009* (in MWp). 2008 2009* Réseau Hors réseau Réseau Hors réseau Total Total On-grid Off-grid On-grid Off-grid Germany , , , , , , Spain , , , , , , Italy , , , , , , Czech Republic , , , , , , Belgium , , , , , , France , , , , , , Portugal , , , , , , Netherlands , , , , , , Greece , , , , , , Austria , , , , , , United Kingdom , , , , , , Luxembourg , , , , , , Sweden , , , , , , Slovenia , , , , , , Finland , , , , , , Bulgaria , , , , , , Denmark , , , , , , Cyprus , , , , , , Malta , , , , , , Poland , , , , , , Hungary , , , , , , Romania , , , , , , Ireland , , , , , , Slovakia , , , , , , Estonia , , , , , , Lithuania , , , , , , Latvia , , , , , , totalEU27 10 249,931 126,130 10 376,061 15 724,798 136,406 15 861,204 *Estimation. Est te. Les éc es so t sép rées p r e r e. ec s re r tte t co . Source : EurObserv'ER 2010. exactement) (tableau 2). La puissance la principale destination du marché mon- L’Union eUropéenne, moyenne par habitant se situe désormais à dial du photo voltaïque, puisqu’elle a principaLe destination 31,6 Wc contre 20,8 Wc en accueilli 78,1 % du volume d’ins- de La prodUction mondiaLe 2008 (tableau 3). L’année 2009 est une bonne année 31,6 Wc/Wp tallation (avec un marché mon- dial estimé à 7 GWc). L’effondrement du marché espagnol n’a pu pour un grand nombre de la puissance par habitant L’Union européenne reste par que ralentir la croissance de celui de l’Union pays de l’Union (Italie, dans l’UE fin 2009 conséquent la principale zone européenne. Selon les premières estima- République tchèque, Bel- capacity per capita in the de production d’électricité so- tions disponibles, la puissance installée de gique…), consolidant le EU at the end of 2009 laire. Celle-ci devrait tourner l’UE durant l’année 2009 devrait atteindre développement futur de la autour de 13,5 TWh en 2009, 5 485,1 MWc, soit 8,1 % de plus qu’en 2008 filière européenne, qui sera moins dépen- contre 7,4 TWh en 2008. (tableau 1). Sa puissance cumulée attein- dant de la taille du marché allemand. Le drait donc près de 16 GWc (15 861,2 MWc vieux continent est d’ailleurs resté en 2009 SYSTÈMES SOLAIRES le journal du photovoltaïque N° 3 – 2010 P H O T OV O L T A I C B A R O M E T E R – E U R O B S E R V ’ E R – A P R I L 2 0 1 0
  • 6.
    135 b aromètre photovoltaïque The main reason for the rise in installation volume over the past Tabl. n° 3 two years is the higher profitability of high-capacity projects. Puissance photovoltaïque par habitant des différents pays Ground-based plants with capacities running into the tens of de l’Union européenne en 2009* (en Wc/hab). megawatts are starting to appear. The largest installation in Photovoltaic power per inhabitant for each European Europe for the time being is the 60-MWp solar farm built at Union country in 2009* (in Wp/inhab). Olmedilla, Spain in 2008, followed by two German installations – at Strasskirchen (54 MWp) and Lieberose (53 MWp), commissioned Wc/hab Wp/inhab in 2009. The American SunEdison group announced last March that it would be constructing a 72-MWp plant in Rovigo province, Germany , Veneto (North-eastern Italy) starting early in the 2nd half of 2010, Spain , that will be fully operational by the end of the year. The scale of this plant contrasts sharply with the biggest roof-integrated pho- Luxembourg , tovoltaic system with just 11.8 MWp of capacity installed in 2008 Czech Rep , on General Motors’ Zaragoza plant in Spain. Belgium , The off-grid application market is also gaining ground, but is harder to monitor due to a lack of comprehensive surveys. The Italy , market is increasingly turning towards non-domestic applica- Portugal , tions such as telecommunications infrastructure, public lighting, Greece , telephone and cell phone chargers, motorway terminals, parking meters, and so on). Austria , France , Cyprus , the eUropean Union – the main destina- tion for the worLd’s prodUction Slovenia , Netherlands , The collapse of the Spanish market only slowed down the Euro- Malta , pean Union market’s growth. First available estimates put 2009 EU installed capacity at up to 5 485.1 MWp which is 8.1% higher Finland , than its 2008 level (t b e 1). If confirmed that would bring accu- Sweden , mulated capacity up to about 16 GWp (15 861.2 MWp to be precise) Denmark , (t b e 2). Mean per capita capacity now stands at 31.6 Wp as against 20.8 Wp in 2008 (t b e 3). Bulgaria , For many EU countries (Italy, Czech Republic, Belgium) that have United Kingdom , consolidated the future development of the European sector, Ireland , 2009 was a good year. Europe remained the main destination for the world’s photovoltaic market in 2009 as it concentrated Hungary , 78.1% of the installation volume (with the global market put at Slovakia , 7 GWp). Consequently the European Union is the main solar electricity pro- Estonia , ducing zone, generating around 13.5 TWh in 2009, as against 7.4 Romania , TWh in 2008. Poland , Germany leadinG by a lonG chalk Lithuania , Latvia , Calculating the installation volume of the German market accu- totalEU27 31,6 rately is always a hard task as the provisional data published at *Estimation. Est te. Les décimales sont séparées par une virgule. the beginning of the year is generally consolidated upwards dur- ec s re r tte t co . Source : EurObserv'ER 2010. ing the course of the year if not at the beginning of the following year. Early in April 2010 the Federal Network Agency worked out the additional “on-grid” capacity installed in Germany in 2009 at istry). For the first time, solar accounts for 1% of the country’s elec- 3 806.3 MWp, raising the accumulated capacity connected to the tricity supply and this percentage could double by 2011. grid to almost 10 GWp (9 785.3 MWp). Thus the annual capacity of The prime reason for the 2009 capacity installation level is the connections to the grid continued growing for another year at a sharp drop in the cost of systems during the year. According to runaway rate (+ 843 MWp in 2006, + 1 271 MWp in 2007 and + 1 809 BSW Solar (the German Solar Industry Association), the average MWp in 2008). price of roof-integrated systems up to 100 kWp capacity dropped In doing so, Germany has confirmed its world solar electricity pro- 25.6% from €4 216/kWp in the fourth quarter of 2008 to €3 ducing top rank slot with production of 6.2 TWh (4.4 TWh in 2008), up 40% on 2008, according to the BMU (German Environment Min- SYSTÈMES SOLAIRES le journal du photovoltaïque N° 3 – 2010 B A R O M È T R E P H O T OV O L T A Ï Q U E – E U R O B S E R V ’ E R – A V R I L 2 0 1 0
  • 7.
    136 photovoltaic b arometer Centrale terrestre de Waldalgesheim (Allemagne), 2,5 MWc de puissance. es e 2.5- p c p ct ro -b se po er p t Ger . Juwi l’allemaGne très loin devant Le niveau de puissance installée en 2009 c€/kWh selon la nature et la puissance des s’explique avant tout par une diminution panneaux. Ces propositions sont cepen- Définir précisément le volume d’installa- très importante du prix des systèmes au dant susceptibles d’évoluer, aucune déci- tion du marché allemand est toujours un cours de l’année. Selon BSW Solar (German sion définitive n’ayant été prise à la fin du exercice difficile. Les données provisoires Solar Industry Association), le prix moyen mois de mars. publiées en début d’année sont générale- des centrales installées sur toiture jusqu’à Ce sujet est actuellement très polémique ment consolidées nettement à la hausse en 100 kWc est passé outre-Rhin de 4 216 en Allemagne : souffrant d’un manque de cours d’année, voire même au début de l’an- euros/kWc au quatrième trimestre 2008 à compétitivité, l’industrie nationale a née suivante. Début avril 2010, l’Agence 3 135 euros/kWc au quatrième 2009, soit besoin de temps pour se restructurer et fédérale du réseau a établi la puissance une baisse de 25,6 %. Sachant qu’au deuxiè- réduire ses coûts. Une baisse trop impor- supplémentaire “reliée réseau” installée en me trimestre 2006 ces installations étaient tante du tarif d’achat pourrait mettre en Allemagne à 3 806,3 MWc en 2009, portant vendues 5 000 euros/kWc, la baisse atteint difficultés de nombreuses entreprises et se ainsi la puissance cumulée reliée réseau à donc quelque 37,7 % en trois ans. traduire par de fortes réductions d’effec- près de 10 GWc (9 785,3 MWc). Ce chiffre est Cette baisse sensible des prix est actuelle- tifs. De nombreuses entreprises ont retar- le résultat d’un rythme effréné de crois- ment bien supérieure à la dégressivité mise dé leurs investissements ou encore annon- sance depuis plusieurs années (+ 843 MWc en place dans le système actuel de tarif cé des délocalisations partielles de leur en 2006, + 1 271 MWc en 2007, + 1 809 MWc d’achat, fixé à 9 et 11 % au 1er janvier 2010. production en Asie. en 2008). Cette inadéquation sera corrigée en cours L’Allemagne a donc confirmé son rang de d’année par une hausse de la dégressivité. l’italie, deuxième marché premier producteur mon- Des discussions sont en mondial en 2009 dial d’électricité solaire cours à ce sujet entre le avec, selon le BMU (minis- tère de l’environnement +3811,3 gouvernement et les pro- fessionnels de la filière. L’Italie, après l’Allemagne et l’Espagne, est le troisième pays de l’Union européenne à allemand), une production MWc/MWp L’exécutif allemand a déjà franchir le cap symbolique des 1 000 MWc de 6,2 TWh (4,4 TWh en installés en Allemagne en 2009 proposé une réduction installés. Selon des données de l’ENEA 2008), en croissance de installed in Germany in 2009 supplémentaire du tarif (Agence nationale des nouvelles technolo- 40 % par rapport à 2008. Le d’achat de l’ordre de 16 % gies, de l’énergie et du développement éco- solaire représente pour la première fois 1 % à partir du 1er juillet pour les panneaux ins- nomique durable), le pays a connecté au de l’approvisionnement en électricité du tallés sur les toits, et de 15 % pour les pan- réseau une puissance additionnelle de 574 pays, et ce pourcentage pourrait doubler neaux en surface libre. Le prix d’achat d’ici 2011. s’échelonnerait entre 32,9 c€/kWh et 25,3 SYSTÈMES SOLAIRES le journal du photovoltaïque N° 3 – 2010 P H O T OV O L T A I C B A R O M E T E R – E U R O B S E R V ’ E R – A P R I L 2 0 1 0
  • 8.
    137 b aromètre photovoltaïque Puissance photovoltaïque installée dans l’Union européenne fin 2009*. Photovoltaic power capacity installed in the European Union at the end of 2009*. N N km km Finland n n° , Sweden n n° , , , n° , , , , Ireland , , , Lithuania , The Netherlands n° , , United Kingdom , , , , , TOTAL EU Belgium n° Poland n° Germany n any n° , , , , , , Luxembourg n n° , , Czech Rep. , n° , , , France1 n° , , , , , , Portuga Portugal n° g , , , , Slovenia n° , Spain n pain n° Bulgaria , Italy n aly n° , , , , , , , , , Malta n n° Cyprus n° , , Légende/Key Puissance cumulée installée Puissance installée durant l’année *Estimation. Est te. dans les pays de l’Union 2009 dans les pays de l’Union 1. DOM-COM inclus./French overseas Departments européenne fin 2009* (en MWc) européenne* (en MWc) and Territories included. Source : EurObserv'ER 2010. Cumulated installed capacity Installed capacity in the in the European Union countries European Union countries at the end of 2009* (in MWp) during 2009* (in MWp) SYSTÈMES SOLAIRES le journal du photovoltaïque N° 3 – 2010 B A R O M È T R E P H O T OV O L T A Ï Q U E – E U R O B S E R V ’ E R – A V R I L 2 0 1 0
  • 9.
    138 photovoltaic b arometer MWc en 2009, portant la puissance totale centrale de 3 kWc parfaitement intégrée au Cette rapide montée en puissance est connectée à 1 019 MWc (non compris 13,4 bâti pourrait être, jusqu’à la fin de 2011, de cependant problématique, car elle repose MWc pour des applications hors réseau). 57 c€/kWh (sur 20 ans), non inclus le bonus sur un système d’incitation qui n’avait pas Cette bonne année, l’Italie la doit à la plei- en cas d’autoconsommation sur site. La prévu que les coûts d’installations des cen- ne opérationnalité des mesures d’incita- rémunération de base devrait être beau- trales de grande puissance chuteraient de tion contenues dans le “Nuovo Conto Ener- coup plus faible pour les près de 40 % durant l’année gia”. Ce programme, qui valide un système centrales de plus de 1 MWc. 2009. La législation tchèque La République tchèque de tarif d’achat pour une puissance plafon- Le tarif actuel de 34,6 a en effet la particularité de a installé 411 MWc en née à 1 200 MWc (non inclus les 165 MWc c€/kWh devrait diminuer très peu différencier le une seule année. installés dans le cadre du plan précédent en trois temps durant l’an- niveau d’incitation en fonc- “Primo Conto Energia”), va bientôt arriver née 2011, passant de 31,3 The Czech Republic tion de la puissance. L’in- à échéance, certainement avant la fin du c€/kWh à 26,4 c€/kWh. Ces installed 411 MWp in a vestisseur a le choix entre premier semestre 2010. Le gouvernement tarifs baisseraient ensuite single year. un tarif d’achat classique n’avait pas, à la fin du mois de mars, enco- de 6 % par an en 2012 et ou un bonus écologique qui re dévoilé la version définitive du nouveau 2013. Dans l’attente de l’adoption définiti- s’ajoute au prix de marché. Dans ce cas, le système d’incitation. Les premiers projets ve du nouveau programme, ces informa- producteur vend son électricité à un cour- publiés début février montrent une forte tions restent à confirmer. tier qui la revend sur le marché de gros. volonté de différenciation des tarifs (42 au L’Office de régulation de l’énergie (ERU) total !), variant selon la puissance et le type un marché de plus de 400 mWc définit le tarif et le bonus chaque année de système. La nouvelle législation prendra en république tchèque avec une année d’avance, les prix ne pou- également en compte la baisse du prix des vant pas représenter moins de 95 % du prix modules photovoltaïques, qui a fortement La République tchèque a, selon le minis- de l’année précédente. Pour 2010, le régu- réduit les coûts d’investissements des cen- tère de l’Industrie et du Commerce, instal- lateur a logiquement choisi de réduire le trales de grande puissance. Il est aussi pré- lé 411 MWc en une seule année. Ce niveau tarif d’achat de 5 %. Le tarif est donc porté vu d’augmenter les tarifs standards en cas d’installation place le pays à la troisième pour les systèmes inférieurs à 30 kWc à d’augmentation de la performance énergé- place en termes de puissance nouvelle- 12,25 CZK/kWh (48,2 c€/kWh) et le bonus tique d’un bâtiment (jusqu’à 12 c€/kWh sup- ment installée (7e rang en 2008) et à la qua- écologique à 11,28 CZK/kWh (44,3 c€/kWh). plémentaires), ou si les centrales terrestres trième en puissance cumulée (8 e rang en Pour les systèmes de puissance supérieure sont construites sur des sites pollués ou 2008). Les perspectives de croissance pour à 30 kWc, le tarif d’achat est fixé à 12,15 d’enfouissement (jusqu’à 8 c€/kWh supplé- 2010 sont encore plus favorables : plus de CZK/kWh (47,8 c€/kWh) et le bonus écolo- mentaires). Selon une des dernières propo- 1 GWc pourrait être installé au cours de gique à 11,18 CZK/kWh (44 c€/kWh). sitions, le tarif d’achat standard pour une l’année. Le gouvernement prévoit de réduire forte- ment les conditions de rémunération de l’électricité solaire à partir du 1er janvier 2011. Le Parlement a déjà fait trois propo- Toiture équipée de sitions qui sont actuellement débattues. La tuiles photovoltaïques. première consiste à porter la réduction du oo co ere t tarif d’achat à 25 % par an. La deuxième, p oto o t c t es. plus difficile à appliquer, consiste à donner le droit au régulateur de recalculer le tarif d’achat au cas où le temps de retour sur investissement  serait inférieur à 11 ans, pour ramener ce dernier à 15 ans. La der- nière proposition consiste à mettre en pla- ce, à partir du 1er mai 2011, des restrictions pour les centrales de plus de 20 MWc. la belGique confirme ses ambitions La Belgique est une nouvelle fois sur le devant de la scène. Selon les premières esti- mations communiquées par l’APERE (Asso- ciation pour la promotion des énergies renouvelables), le pays aurait installé 292,1 MWc en 2009, dont 251 MWc en Région fla- Juwi SYSTÈMES SOLAIRES le journal du photovoltaïque N° 3 – 2010 P H O T OV O L T A I C B A R O M E T E R – E U R O B S E R V ’ E R – A P R I L 2 0 1 0
  • 10.
    141 b aromètre photovoltaïque 135/kWp in the same quarter in 2009. Looking back to the second quarter of 2006 when the systems sold for €5 000/kWp, this drop is as much as 37.7%. Trackers photovoltaïques à For the time being this price cut more than compensates for the Montesquieu (Gironde, France). sliding scale set in the current feed-in tariff scheme, fixed at 9 and oto o t c tr c ers t 11% on 1st January 2010. This anomaly will be corrected during o tesq e (G ro e, Fr ce). the year by an increase in the sliding scale. Discussions are now under way between the government and the industry’s players. The government has already proposed to cut the feed-in tariff by an additional 16% from 1st July for roof-integrated panels and by 15% for free-standing panels. The buyback price would be stag- gered between €0.329/kWh and €0.253/kWh depending on panel type and capacity. However, these proposals are likely to change, as no final decision had been made by the end of March. This is a highly controversial subject in Germany as its industry is currently hit by competitiveness issues and needs time to restruc- ture and reduce costs. A too big reduction in the feed-in tariff could land many firms in difficulty and jeopardise many jobs. Most companies have postponed investments or even announced to partially shift production to Asia. italy, the World number tWo market in 2009 Italy is the third European Union country to pass the symbolic 1000 Géraldine Houot MWp installed mark, following Germany and Spain. According to ENEA (the Italian National Agency for New Technologies, Energy and Sustainable Economic Development), the country connected 574 MWp of additional capacity to the grid in 2009, bringing total connected capacity to 1 019 MWp (excluding 13.4 MWp of off-grid applications). Italy owes this good year to the full implementation of its Nuovo Conto Energia incentive programme which validates over 400 mWp in the czech republic a feed-in tariff system for capacity capped at 1 200 MWp (not including the 165 MWp installed under the previous Primo Conto According to the Czech Ministry of Industry and Trade, the Repub- Energia programme). The programme will shortly end, almost cer- lic installed 411 MWp in a single year. This installation rate cata- tainly before the end of the first half of 2010. By the end of March pults the country to third place in terms of newly installed capaci- the government had yet to unveil the final version of the new ty (7th place in 2008) and fourth place in terms of accumulated incentive scheme. The first drafts published early in February capacity (8th place in 2008). As there is a good chance that over 1 demonstrate its strong determination to differentiate the tariffs GWp will be installed by the end of this year, the growth prospects – 42 in all – that vary in line with system capacity for 2010 are even more encouraging. and type. The new incentive system will also make However this rapid rise is offset by the fact that it At the end of 2009 Italy allowance for the drop in the price of photovoltaic is based on an incentive system that had not antic- passed the symbolic modules that has dramatically reduced the invest- ipated that high-capacity plant installation costs one GWp barrier. ment costs of high-capacity plants. This new legis- would plummet by almost 40% in 2009. This is lation provides for increasing standard tariffs when- L’Italie a franchi fin because the Czech system makes almost no dis- ever measures are taken to increase the building 2009 le cap symbolique tinction for capacity in its incentive levels. energy performance level (up to an additional du GWc installé. Investors can choose between a conventional €0.12/kWh) or if the ground-based plants are con- feed-in tariff system and an environmental bonus structed on polluted or landfill sites (up to an additional €0.8/kWh). added to the market price. In the latter case, the producer sells One of the latest proposals suggests that the standard feed-in tar- his electricity to a trader who sells it on the wholesale market. iff for a 3-kWp plant perfectly integrated into a building could be Every year the Energy Regulatory Office (ERU) defines the tariff €0.57/kWh (for 20 years) up to the end of 2011, not excluding the and bonus a whole year in advance, the new prices cannot be less bonus in the event of self-consumption on site. The basic remu- than 95% of the previous year’s rate. For 2010, the regulator nat- neration should be much lower for plants with over 1 MWp of urally reduced the feed-in tariff by 5%. Therefore the tariff is capacity. The current tariff of €0.346/kWh should drop three times reduced to CZK 12.25/kWh (€0.482/kWh) for systems up to 30 kWp in 2011, to €0.313/kWh and then to €0.264/kWh. These tariffs will and the environmental bonus to CZK 11.28/kWh (€0.443/kWh). The then drop by 6% per annum in 2012 and 2013. While we await the feed-in tariff for systems with a capacity in excess of 30 kWp is adoption of the new programme in its finalised form, this should be taken as guideline data. SYSTÈMES SOLAIRES le journal du photovoltaïque N° 3 – 2010 B A R O M È T R E P H O T OV O L T A Ï Q U E – E U R O B S E R V ’ E R – A V R I L 2 0 1 0
  • 11.
    142 photovoltaic b arometer Ademe mande, 38 MWc en Région wallonne et 3,1 d’installation. Ce système a naturellement apprécier la rentabilité de ce type d’instal- MWc en Région bruxelloise. bénéficié aux centrales de grande puissan- lation, le gouvernement a préféré lancer en Le chiffre d’installation de la partie fla- ce, lesquelles ont aussi le plus profité de la 2009 un appel d’offres, portant sur un total mande a été communiqué par BelPV (Fédé- baisse du prix des modules. Un ajustement de 300 MWc répartis en 27 tranches sur 4 ration belge des entreprises photovol- a été opéré. À partir du 1er janvier 2010, le zones géographiques représentant autant taïques). Il devrait prochainement être prix d’un certificat vert photovoltaïque est de niveaux d’ensoleillement. À la date limi- consolidé par le VREG, le régulateur du mar- fixé à 350 euros. te de remise des offres, le 25 janvier dernier, ché de l’électricité et du gaz en région fla- 119 dossiers avaient été reçus représentant mande. Les données d’installation des la france, loin des leaders une puissance cumulée de 867 MWc. régions wallonne et bruxelloise provien- Le niveau de puissance installée est surtout nent respectivement de la CWAPE (Com- Avec 185,2 MWc raccordés au réseau élec- très faible comparé à l’ampleur des mission wallonne pour l’énergie) et de Bru- trique au cours de l’année 2009 (dont 46,7 demandes de raccordement. En effet, selon gel (Bruxelles gaz électricité). Ces différents MWc dans les départements d'outre-mer ou le SOeS, la puissance des installations en apports porteraient la DOM), le parc photovol- attente de raccordement au 31 décembre + 292,1 puissance totale instal- taïque a, selon le SOeS 2009 a atteint 3 438 MWc pour 58 544 lée dans le pays à 363 (Service de l’observation demandes déposées (2 789 MWc en métro- MWc, soit le 5e rang de et des statistiques), plus pole et 650 MWc dans les DOM), contre 1886 l’Union européenne. MWc/MWp que triplé depuis la fin de MWc au 30 juin de la même année pour La forte progression l’année 2008. La puissance 24 470 demandes. Les longs délais d’atten- La puissance supplémentaire constatée en région fla- cumulée raccordée en te s’expliquent à la fois par un afflux mas- installée en Belgique en 2009 mande s’explique par un The additional capacity France atteint fin 2009 sif de demandes de raccordement en fin système de certificats installed in Belgium in 2009 268,2 MWc (200,7 MWc en d’année, mais également par le manque de verts régional particuliè- métropole et 67,5 MWc techniciens pour raccorder les installations rement attractif. Dans ce mécanisme, le dans les DOM). Ce niveau d’installation plus au réseau national. prix minimum d’un certificat vert d’origine limité que chez les autres pays leader du Cet afflux de demandes a conduit le gou- photovoltaïque (équivalent à une produc- marché s’explique en partie par le choix de vernement à modifier les conditions tion de 1 MWh) avait été fixé dans un pre- ne pas favoriser le développement des cen- d’achat de l’électricité solaire en adoptant mier temps à 450 euros (soit 0,45 c€/kWh) et trales au sol en leur attribuant un tarif ce, quels que soient la puissance et le type d’achat relativement faible. Afin de mieux SYSTÈMES SOLAIRES le journal du photovoltaïque N° 3 – 2010 P H O T OV O L T A I C B A R O M E T E R – E U R O B S E R V ’ E R – A P R I L 2 0 1 0
  • 12.
    143 b aromètre photovoltaïque to 363 MWp, taking it to fifth place in the European Union. The reason for the sharp rise in installed capacity in the Flemish region is that it operates a particularly attractive regional green certificate system which offers a minimum price of 450 euros (or €0.0045/kWh) for a photovoltaic green certificate (equivalent to a production of 1 MWh) regardless of installation capacity or type. This system has naturally been a boon to high-capacity installations that have gained the most from the drop in the price of modules. An adjustment has set the price of a photo- voltaic green certificate at 350 euros from 1st January 2010. france trailinG behind the leaders According to SOeS (the Observation and Statistics Office), 185.2 MWp were connected to the grid during the course of 2009 (including 46.7 MWp in the Overseas Departments), increasing the photovoltaic base more than threefold since the end of 2008. The accumulated capacity connected in France rose at the end of 2009 to 268.2 MWp, 200.7 MWp thereof in mainland France and 67.5 MWp overseas. Part of the reason why this installation lev- el is lower than that of the other leading countries in the EU mar- ket, is the French government’s decision not to promote the development of ground-based plants, but to set a relatively low feed-in tariff. The government preferred to call a tender in 2009 to get a better grip on the profitability of this type of installa- tion. The target capacity is 300 MWp spread over 27 phases and over 4 geographical zones with 4 different sunshine levels. By the application expiry date, 25 January, 119 applications had been submitted for an accumulated capacity of 867 MWp. set at CZK 12.15/kWh (€0.478/kWh) and the environmental bonus However the installed capacity level seems low when compared at CZK 11.18/kWh (€0.44/kWh). against connection applications. This is because according to The government intends to slash the solar the SOeS, the capacity of installations 58544 electricity remuneration terms starting on awaiting connection as of 31 December 1st January 2011. Parliament has already 2009 had risen to 3 438 MWp for 58 544 tabled three proposals for debate. The first applications submitted (2 789 MWp in entails reducing the feed-in tariff by 25% mainland France and 650 MWp overseas), the number of pending applications per annum. The second, which is harder to as against 1 886 MWp on 30 June of the for grid connection in France apply, consists of authorising the regulator same year for 24 470 applications. The le nombre de demandes de raccordement to recalculate the feed-in tariff when the au réseau électrique français en attente massive influx of connection applications payback time is less than 11 years, to raise at the end of the year compounded by the it to 15 years. The third proposal would dearth of engineers to connect the instal- introduce restrictions for plants with over 20 MWp of capacity start- lations to the national grid have caused the long lead times. ing from 1st May 2011. The rush to submit applications prompted the government to change the solar electricity purchase terms by adopting a new belGium bolsters its ambitions order on 12 January, which like the previous order favours build- ing-integrated installations this time distinguishing three types Once again Belgium is in the spotlight. According to APERE’s first of tarification depending on the type of building, its usage (hous- estimates, Belgium installed 292.1 MWp in 2009 of which 251 ing, health, teaching and others) and the type of integration. MWp is spread over the Flemish region; 38 MWp over the Wal- A higher integration to the frame premium is awarded for sys- loon region… and 3.1 MWp over the Brussels Capital region. tems installed on the roof of a closed building (all side walls The installation figure for the Flemish region was supplied by closed) replacing the building elements that provide the roofing BelPV (the Belgian photovoltaic companies’ federation). It or closure (side wall), as well as the waterproofing function. A should be consolidated shortly by the VREG (Flemish Regulation lower simplified integration premium is also allocated for sys- Entity for the Electricity and Gas market). The installation data tems installed on open-sided buildings, if the system replaces for the Walloon and Brussels Capital regions come from CWAPE building elements that provide the walls and roofing as well as (the Walloon Commission for Energy) and Brugel (Brussels gas the waterproofing function. electricity) respectively. This capacity would raise the total installed capacity in Belgium SYSTÈMES SOLAIRES le journal du photovoltaïque N° 3 – 2010 B A R O M È T R E P H O T OV O L T A Ï Q U E – E U R O B S E R V ’ E R – A V R I L 2 0 1 0
  • 13.
    144 photovoltaic b arometer le 12 janvier dernier un nouvel arrêté. Com- L’ajustement intervient après plusieurs beaucoup plus problématique si, dans un me le précédent, ce dernier favorise les ins- années (2006 à 2008) pendant lesquelles les avenir proche, certains acteurs asiatiques tallations intégrées au bâti en distinguant prix avaient peu diminué, malgré d’impor- décidaient d’écouler provisoirement leur cette fois trois types de tarification selon tants gains de compétitivité industrielle marchandise à des prix inférieurs à leur la nature du bâtiment, son usage (habita- réalisée grâce aux économies d’échelle et coût réel de production. Ce qui ne semble tion, santé, enseignement et autres) et le aux innovations technologiques. La raison pas être le cas à l’heure actuelle. type d’intégration. en était le coût élevé de la matière premiè- La diminution des prix a renforcé la crédi- La “prime d’intégration au bâti” est la plus re, le silicium, en raison d’un manque de dis- bilité de l’industrie photovoltaïque sur le élevée. Elle est octroyée aux systèmes ins- ponibilité, mais surtout par une demande plan de sa capacité à réduire ses coûts de tallés sur la toiture d’un bâtiment clos (sur continuellement supérieure à l’offre. Cette production. Elle va permettre à la techno- toutes les faces latérales) situation a permis aux logie, à l’image de l’éolien, de renforcer son et qui remplacent des industriels (en particulier assise dans les grands pays consomma- éléments du bâtiment assurant la couverture ou la fermeture (face laté- rale), ainsi que la fonc- 80 % la diminution du prix ceux qui avaient sécurisé leur approvisionnement en silicium) de maintenir une forte rentabilité de teurs d’électricité (États-Unis, Chine, Japon, Corée du Sud, Italie, France, etc.), réduisant sa dépendance actuelle vis-à-vis de l’Alle- magne. Cette dépendance commençait à du silicium en 2009 tion d’étanchéité. Vient leurs investissements tout être dangereuse pour l’industrie mondiale, the decrease in the price ensuite la “prime d’inté- en augmentant significa- car ce marché pourrait rapidement arriver of silicon in 2009 gration simplifiée”. Elle tivement leurs capacités à saturation. Cette situation va cependant est allouée aux systèmes installés sur des de production. Parallèlement, ce niveau éle- amener l’industrie mondiale photovol- bâtiments non fermés, si le système rem- vé et continu des prix sur plusieurs années taïque à se restructurer au profit des place des éléments du bâti qui assurent le a permis de remettre sur le devant de la acteurs les mieux armés en termes de clos et le couvert, ainsi que la fonction scène certaines technologies couches réduction des coûts. d’étanchéité. minces qui ont pu démontrer leurs possibi- Les installations entrant dans le cadre de la lités de réduction significative des coûts de une industrie européenne prime d’intégration et qui sont situées sur production. au pied du mur un bâtiment à usage principal d’habitation, Il a également permis d’accélérer l’essor d’enseignement ou de santé bénéficient industriel et technologique des fabricants Dans ce contexte, le challenge sera plus dif- d’un tarif de 58 c€/kWh, et de 50 c€/kWh sur asiatiques (chinois en particulier). Ces der- ficile pour certains acteurs européens, qui les autres bâtiments. La prime d’intégra- niers ont, depuis plusieurs années, investi devront faire face à la diminution des aides tion simplifiée au bâti s’élève à 42 c€/kWh. massivement dans de nouvelles capacités à la production sur leur propre marché. Les Pour les autres installations, le tarif appli- de production, et ce, sur toute la chaîne de industriels européens qui parviendront à cable en métropole continentale est fixé à valeur de l’industrie photovoltaïque. Les conforter leur avance technologique en 31,4 c€/kWh pour les installations égales ou plus importants d’entre eux se sont appuyés réduisant sensiblement leurs coûts de pro- inférieures à 250 kWc, et entre 31,4 et 37,7 sur des technologies et des process de poin- duction, en acceptant de délocaliser une c€/kWh pour les installations de plus de 250 te (notamment développés en Europe et en partie de leur production, devraient pou- kWc, selon un indice d’ensoleillement défi- Australie), qui leur permettent de proposer voir passer ce cap, et participer à la crois- ni pour chaque département. Le tarif appli- des modules de bonne qualité à des prix sance future du marché mondial. Une des cable en Corse et dans les DOM s’élève à 40 extrêmement compétitifs. clés de la survie de l’industrie européenne c€/kWh. Une dégressivité de 10 % sera éga- passera également par un développement lement appliquée chaque année à partir du l’ère de la surproduction plus important des technologies couches 1er janvier 2012. minces, là où les possibilités de réduction L’augmentation considérable de la produc- de coûts de production sont les plus impor- tion de modules (lire plus loin), libérée par tantes. De nombreux producteurs euro- L’indUstrie face à Une crise un afflux de silicium sur le marché (175 000 péens développent actuellement des tech- de matUrité tonnes attendues en 2010 contre 70 000 en nologies et des process nouveaux qui 2008, selon Photon International), a pour la pourraient renverser la suprématie du sili- des prix à la baisse première fois fait entrer l’industrie photo- cium cristallin. voltaïque dans une ère de surproduction. L’industrie européenne est actuellement Le prix du silicium, des wafers et des Ce choc a été d’autant plus important que dans une mauvaise passe et continue à modules polycristallins a connu une baisse la croissance mondiale a été altérée en 2009 perdre des parts de marché (lire plus loin). sans précédent durant l’année 2009. Selon par l’effondrement espagnol, premier mar- L’industrie photovoltaïque allemande a une étude de iSuppli (cabinet de consultants ché de la planète en 2009. peu profité de la croissance du marché américain), le prix des modules cristallins a La baisse, même importante, du prix des mondial en 2009 et de celle de son marché chuté en moyenne de 37,8 %, le prix des modules n’est pas nécessairement une domestique. L’industrie espagnole a terri- wafers de 50 % et le prix du silicium de 80 %. mauvaise chose pour l’industrie, dans la blement souffert de l’effondrement de son Le rapport prévoit de nouvelles baisses en mesure où les prix restent au-dessus des 2010, mais nettement moins sensibles. coûts de production. La situation serait SYSTÈMES SOLAIRES le journal du photovoltaïque N° 3 – 2010 P H O T OV O L T A I C B A R O M E T E R – E U R O B S E R V ’ E R – A P R I L 2 0 1 0
  • 14.
    147 b aromètre photovoltaïque A tariff of €0.58/kWh is allocated to installations that benefit return to centre-stage as they were put through their paces to from the integration premium on a building whose primary use prune manufacturing costs radically. is housing, teaching or health care. A tariff of €0.50/kWh is allo- The high prices also opened up opportunities for Asian manu- cated to installations that have an integration premium on oth- facturers to accelerate their industrial and technological expan- er buildings, while a tariff of €0.42/kWh applies to buildings sion (the Chinese in particular). For a number of years the Chi- awarded the simplified integration premium. nese market players have invested massively in new The applicable mainland tariff is €0.314/kWh for installations of manufacturing capacity throughout the photovoltaic industry 250 kWp and less, and €0.314 to €0.377/kWh for installations of value chain. The biggest concerns have relied on leading-edge over 250 kWp, applying a sunshine exposure index set for each technologies and processes (primarily developed in Europe and department. The tariff applicable in Corsica and the French over- Australia) that have enabled them to offer good quality modules seas territories is €0.40/kWh. A 10% degression will also be at extremely keen prices. applied every year starting from 1st January 2012. the overproduction era the indUstry is facing a coming-of-age For the first time the photovoltaic industry has entered an era crisis of overproduction with a huge increase in module production (see be o ), set off by silicon flooding the market (175 000 tonnes prices fallinG expected in 2010 as against 70 000 in 2008, according to oto I ter t o ). The shock is all the sharper because world mar- Silicon, wafer and polycrystalline module prices dropped by ket growth was knocked sideways in 2009 by the collapse of its unprecedented levels in 2009. According to the American con- leading market, Spain, in 2009. sultancy, iSuppli, the price of crystalline As long as prices outstrip production costs, modules fell by an average of 37.8%, wafers For the first time in its history, even a slash in the price of modules, will do by 50% and silicon by 80% and it predicts fur- the photovoltaic industry has the industry no harm. The situation would be ther, but much smaller price drops in 2010. entered an era of overproduction. much more of a problem if a number of Asian There are a number of reasons for this dra- L’industrie photovoltaïque est players were to decide to dump their goods matic price realignment. This huge drop part- entrée pour la première fois de on the market by undercutting real manu- ly makes up for the slender reduction in mod- son histoire dans une ère facturing cost prices – which is not the case ule prices between 2006 and 2008, despite de surproduction. as it stands. the industry’s considerable gains in compet- The credibility of the photovoltaic industry itive strength achieved through economies of scale and techno- has been boosted by lowering of prices as regards its manu- logical innovations. The reason why prices were kept at high lev- facturing cost-cutting capacity. It will enable the technology els is partly because of silicon scarcity and particularly because to strengthen its foothold in the major electricity-consuming demand continually outpaced supply. The manufacturers (espe- countries (United States, China, Japan, South Korea, Italy, cially those who had secured their silicon supplies) exploited France, etc.), as wind power has done, reducing its current this situation to maintain high profit margins on their invest- dependency on the German market. As the German producers ments while significantly increasing their manufacturing capac- could soon reach saturation point, this dependency is begin- ities. At the same time, the new high pricing level kept up over several years enabled a number of thin film technologies to Mise en service fin 2009, Montalto di Castro est, avec 24 MWc de puissance, la plus grande centrale photovoltaïque italienne connectée au réseau. Connected at the end of 2009, Montalto di Castro (24 MWp) is the largest Italian on-grid photovoltaic plant. SunRay Renewable SYSTÈMES SOLAIRES le journal du photovoltaïque N° 3 – 2010 B A R O M È T R E P H O T OV O L T A Ï Q U E – E U R O B S E R V ’ E R – A V R I L 2 0 1 0
  • 15.
    148 photovoltaic b arometer Graph. n° 1 Évolution de la production de cellules de 2000 à 2009. Solar cell production 2000 to 2009. Source : Photon International (mars 2010/March 2010). 2000 2001 2002 2003 2004 2005 2006 2007 2008 2009 marché national. Comme un symbole, cet- comparés aux 7,9 GWc calculés en 2008 (gra- ment s’expliquer par le délai nécessaire te mauvaise année aura été fatale aux phique 1), soit une croissance de 56 %. La entre la vente d’un module et son raccor- usines madrilènes du groupe BP Solar, technologie polycristalline représenterait dement. En effet, si une centrale est en pourtant présent depuis plus de 25 ans 46,9 % de la production totale (47,7 % en cours d’installation, ou qu’elle est installée dans le pays, l’industriel ayant choisi de 2008), le monocristallin 34,1 % (38,3 % mais en attente de raccordement, la puis- concentrer sa production sur les usines les en 2008), les couches minces (CdTe, CIS, sance des modules vendus ne sera pas plus compétitives du groupe. a-Si/microcristalline et autres) 17,7 % prise en compte dans les statistiques (12,5 % en 2008) et le silicium ruban 1,4 % nationales d’installation. L’augmentation plus de 10 GWc produits dans (1,5 % en 2008). de la taille du marché entraîne nécessaire- le monde ? Selon cette enquête, les principaux pays ment une augmentation de l’écart entre le producteurs de cellules sont la Chine avec nombre des modules produits et celui des La forte diminution des prix des systèmes 38 % (32,7 % en 2008), devant l’Allemagne modules raccordés. Enfin, une partie de la photovoltaïque montre que nous sommes 15 % (18,5 % en 2008), le Japon 12,5 % (16 % puissance installée peut échapper aux clairement entrés dans une ère de surpro- en 2008), Taïwan 12,2 % (11,6 % en 2008) et la observateurs nationaux et ne pas être duction. Reste à en mesurer l’ampleur. Malaisie 6,4 % (2,1 % en 2008) (graphique 2). comptabilisée. Deux organismes, le site Internet Solar- Les principales régions de production sont buzz, d’une part, et le magazine Photon l’Asie avec 76,1 % (68,3 % en 2008), l’Europe actualités des principaux International, d’autre part, ont établi leurs 19,4 % (25,5 % en 2008), l’Amérique 4,4 % fabricants propres estimations suite à des enquêtes (5,5 % en 2008), enfin l’Afrique et le Moyen- auprès des fabricants. Orient 0,1 % (0,2 % en 2008). La production L’industrie photovoltaïque de la produc- Selon Solarbuzz, la production mondiale de provenant d’Océanie n’est plus référencée tion de cellules est très hétérogène. Elle se cellules solaires a atteint un total de 9,34 en 2009 (0,5 % en 2008). compose d’acteurs de différentes tailles GWc en 2009, comparée à une production disposant de capacités de production de de 6,85 GWc en 2008. Les cellules solaires en L’estimation de Photon International est plus d’un GWc à quelques MWc. Dans son couches minces représenteraient 18 % de plus préoccupante pour l’industrie que cel- enquête, Photon International a recensé la la production totale, et les fabricants chi- le de Solarbuzz, car elle indiquerait qu’une production de 170 fabricants, les dix pre- nois et taïwanais auraient porté leur part part beaucoup plus importante que prévue miers d’entre eux représentant moins de la de marché mondial à 49 % toutes techno- de la production mondiale est actuelle- moitié de la production mondiale (soit près logies confondues. Les estimations de Pho- ment stockée en usine, en attente de trou- de 46 %). Le classement, en termes de puis- ton International, également publiées en ver acquéreur. Une partie de la différence sance de cellules produites, des principaux mars dernier, établissent la production entre les chiffres des capacités installées mondiale de cellules à 12,3 GWc en 2009 et les chiffres de production peut égale- SYSTÈMES SOLAIRES le journal du photovoltaïque N° 3 – 2010 P H O T OV O L T A I C B A R O M E T E R – E U R O B S E R V ’ E R – A P R I L 2 0 1 0
  • 16.
    149 b aromètre photovoltaïque ning to look dangerous for the global industry The situation ter. The Spanish market suffered a great blow from the collapse will force the global photovoltaic industry to restructure and of its national market in a bad year, and as if to symbolise this, benefit those players who are best armed to reduce costs. BP Solar, which has been in the country for over 25 years, is clos- ing its Madrid plants and chosen to concentrate its manufac- the european industry With its back to the Wall turing in the group’s most competitive plants. Against this background, the challenge will be harder for some over 10 GWp produced in the World? European actors as they cope with the reductions in aid with manufacturing in their own markets. European industrialists, The sharp drop in photovoltaic system prices demonstrates that who succeed in consolidating their technological advance by we have clearly entered an era of overproduction, although its significantly reducing manufacturing scale has yet to be gauged. Two organisa- costs, should be able to weather the tions, the Solarbuzz website and oto storm by accepting to relocate part of their production and thus take part in the future growth of the global market. One of the keys to the survival of the European industry will be to accentuate the development of thin film technolo- 17,7 % market share of thin I ter t o veys. magazine have made their own estimates based on manufacturer sur- According to Solarbuzz, global production of solar cells came to a total of 9.34 GWp in 2009, as against 6.85 GWp in 2008. Appar- films cells in 2009 gies, where the greatest potential for la part de marché des cellules ently thin film solar cell production lean manufacturing lies. Many European couches minces en 2009 accounts for 18% of all production and the producers are currently developing new Chinese and Taiwanese manufacturers technologies and processes that could overturn crystalline sil- now hold a 49% market share. oto I ter t o ’s estimates, icon’s stronghold. also published last March put global cell production at 12.3 GWp The European industry is going through a bad phase and is con- in 2009 as against its figure of 7.9 GWp in 2008 ( r p 1), which is tinuing to lose market shares (see be o ). The German photo- up 56%. According to the magazine, polycrystalline technology voltaic industry has not really capitalised on the global market growth in 2009 or that of its own domestic market for that mat- Tabl. n° 4 Les 10 premiers fabricants de cellules photovoltaïques (en MWc). The top 10 PV cell manufacturers (in MWp). Entreprises Pays Technologie des cellules* Production Production capacity Companies Country Cell technology* ** First Solar USA Thin film (CdTe) , Crystalline Suntech Power China (mono, multi)/ Thin film (a-Si, mc-Si) Crystalline Sharp Japan (mono, multi)/ Thin film (a-Si, mc-Si) Crystalline Q-Cells*** Germany (mono, multi)/ , Thin film (CIGS,CdTe) Yingli Green Energy China Crystalline (multi) , , Crystalline JA Solar China (mono, multi) Kyocera Japan Crystalline (multi) n.a. Crystalline Trina Solar China (mono, multi) SunPower USA, Philippines Crystalline (mono) Crystalline Gintech Taiwan (mono, multi) * C e : te r re e c (Cadmium teluride), -S : s c orp e (amorphous silicon), c-S : s c crocr st (microcrystalline silicon), CIGS : c re sé é (copper indium galium diselenide), s c o ocr st (monocrystalline silicon), s c po cr st (multicrystalline silicon), ** Estimation. Est te. Les décimales sont séparées par une virgule. ec s re r tte t co . Source : EurObserv'ER 2010. *** I c s s eC o G b et s e co e So bro G b . Included its subsidiary Calyxo GmbH and its joint venture Solibro GmbH. SYSTÈMES SOLAIRES le journal du photovoltaïque N° 3 – 2010 B A R O M È T R E P H O T OV O L T A Ï Q U E – E U R O B S E R V ’ E R – A V R I L 2 0 1 0
  • 17.
    150 photovoltaic b arometer fabricants a évolué par rapport à l’an der- ment mondial avec une production supé- Yingly 5e, Ja Solar 6e et Trina Solar 8e). Le nier. Pour autant, comme en 2009, les rieure à 1 GWc (tableau 4). C’est la premiè- Japon ne compte plus que deux représen- mêmes cinq nationalités (États-Unis, Chine, re fois qu’un fabricant uniquement spécia- tants (Sharp 3e et Kyocera 7e), Sanyo sortant Japon, Allemagne et Taïwan) trustent les 10 lisé dans les couches minces prend la tête du classement. Taïwan garde un représen- premières places. du classement mondial. Un autre acteur tant avec Gintech (10e) ainsi que l’Alle- Le leadership échappe une nouvelle fois à américain, Sunpower, dont les capacités de magne avec Q-Cells (4e). l’Asie. Le fabricant américain First Solar, production sont situées aux Philippines, avec sa technologie couches minces au occupe la 9e place. Ce classement confirme First Solar n° 1 CdTe à moins d’un dollar le Wc, s’empare la montée en puissance des acteurs chinois First Solar peut être considéré comme le pour la première fois de la tête du classe- avec 4 acteurs dans le “top ten” (Suntech 2e, mouton noir de l’industrie photovoltaïque. Évoluant à contre-courant des principaux fabricants de modules, il a démontré que le Graph. n° 2 tellurure de cadmium avait un avenir Répartition géographique de la production en MWc de cellules photovoltaïque en radieux face au silicium cristallin. Ce choix 2008 et 2009. Geographic distribution of PV cells production MWp in 2008 and 2009. lui permet aujourd’hui de briguer la pre- Les décimales sont séparées par une virgule. ec s re r tte t co . mière place des producteurs de cellules Source : Photon International (mars 2010/March 2010). photovoltaïques, en devenant le premier fabricant mondial à dépasser le seuil du Année/year GW produit en une année. L’entreprise a , – , MWc/p annoncé une production de 1 112,6 MWc en , – MWc/p er c 2009, soit plus du double qu’en 2008 (504 s MWc). 69,5 % de sa production proviennent , – MWc/p rc e E st de Malaisie, 17,5 % d’Allemagne et 13 % des , – MWc/p États-Unis. First Solar a annoncé au qua- est o E rope , – MWc/p trième trimestre un coût de production de str , – , MWc/p ses modules de 0,84 $/Wc pour une effica- Ger cité de ces modules de 11,1 %, ce qui peut , – MWc/p C laisser rêveur un bon nombre de ses , – MWc/p concurrents. est o s Après avoir nettement augmenté ses capa- cités de production en 2009 (de 716 à 1 228 MWc), First Solar prévoit de faire une pau- , – , MWc/p I se en 2010 à 1 282 MWc (854 MWc en Malai- – MWc/p p sie, 214 MWc en Allemagne et 214 MWc en , – , MWc/p Ohio). De nouveaux investissements seront ensuite réalisés en Malaisie (+ 428 MWc) puis en France (+ 107 MWc), portant la capa- cité à 1 816 MWc. L’usine française, dont la Année/year construction devrait débuter durant la , – , MWc/p seconde moitié de l’année, sera située à er c Blanquefort, près de Bordeaux. Cette usine , – , MWc/p sera cofinancée par EDF Énergies Nou- s , – MWc/p velles, qui bénéficiera de la vente intégrale rc e E st , – , MWc/p de la production durant les 10 premières est o E rope années d’exploitation. – , MWc/p Sur le plan financier, First Solar a réalisé un – , MWc/p C chiffre d’affaires (“revenues” en anglais) en Ger 2009 à hauteur de 2 066,2 millions de dollars comparés aux 1 246,3 millions de dollars , – , MWc/p générés en 2008. Son résultat net (“net inco- est o s me”) a augmenté à 640,1 millions de dollars en 2009 contre 348,3 millions de dollars en , – , MWc/p I 2008. Pour cette année, l’Américain prévoit , – , MWc/p des ventes nettes (“net sales”) de 2,7 et 2,9 , – , MWc/p p milliards de dollars et prévoit de consacrer entre 500 et 550 millions de dollars en SYSTÈMES SOLAIRES le journal du photovoltaïque N° 3 – 2010 P H O T OV O L T A I C B A R O M E T E R – E U R O B S E R V ’ E R – A P R I L 2 0 1 0
  • 18.
    153 b aromètre photovoltaïque First Solar Opérateurs de l’usine de Francfort (Allemagne) du groupe First Solar Oper tors t t e F rst So r ro p’s Fr rt ctor (Ger ) accounts for 46.9% of total production (47.7% in 2008), monocrys- neWs from the main manufacturers talline for 34.1% (38.3% in 2008), thin films (CdTe, CIS, a-Si/micro- crystalline and others) for 17.7% (12.5% in 2008) and silicon ribbon The photovoltaic cell manufacturing industry is highly diversified for 1.4% (1.5% in 2008). with players of different sizes with manufacturing capacities According to their survey, the main cell producing countries are ranging from over one GWp down to a few MWp. oto I ter - China with 38% (32.7% in 2008), ahead of Germany with 15% (18.5% t o ’s survey covered the production of 170 manufacturers. The in 2008), Japan with 12.5% (16% in 2008), Taiwan with 12.2% (11.6% top ten account for less than half of worldwide production in 2008) and Malaysia with 6.4% (2.1% in 2008) ( r p 2). The main (around 46%). The ranking of the main manufacturers in terms of manufacturing regions are Asia with 76.1% (68.3% in 2008), Europe capacity of cells produced, has changed over the last 12 months with 19.4% (25.5% in 2008), America with 4.4% (5.5% in 2008) and although, the same five nationalities monopolise the top 10 slots Africa and the Middle-East with 0.1% (0.2% as in 2009 (the United States, China, Japan, in 2008). Australasian manufacturing is no Most of the major cell manufacturers Germany and Taiwan). longer listed in 2009 (0.5% in 2008). are located in Asia. The European Yet again leadership has evaded Asia. Amer- oto I ter t o ’s estimate gives more industry is still well represented ican manufacturer First Solar goes to the top cause for concern for the industry than the with Q-Cells, the leading cell of the world ranks for the first time with over Solarbuzz estimate because it indicates manufacturer, in addition to many one GWp of production (t b e 4) and its thin that much more of global production than hefty industry players. film CdTe technology achieved production intended is currently held in stock awaiting La plupart des grands fabricants costs at under one dollar per Wp. This is also purchasers to turn up. Part of the difference de cellules se situent en Asie. the first time that a manufacturer specialis- between the installed capacity figures and L’industrie européenne reste bien ing exclusively in thin films takes the lead. manufacturing figures may also be explai- représentée avec la présence de Another American player, Sunpower, whose ned by the time lag between selling a mod- Q-Cells, premier fabricant mondial manufacturing facilities are located in the ule and its connection to the grid. This is de cellules, et de nombreux acteurs Philippines, is in 9th place. This ranking con- because the capacity of the modules sold de taille significative. firms the build-up of Chinese manufacturing will not be taken into account in the nation- capacity with 4 concerns in the top ten (Sun- al installation statistics if a plant installation is underway, or if the tech –2nd, Yingly –5th, Ja Solar –6th and Trina Solar –8th). As Sanyo plant is installed but awaiting connection to the grid. The increase has dropped out of the ranks, Japan only has two flag bearers left in the size of the market evidently increases the gap between the (Sharp –3rd and Kyocera – 7th). Taiwan has one representative with number of modules actually connected. Lastly, part of the installed Gintech (10th) and Germany one with Q-Cells (4th). capacity may escape national observers and thus be left out of the figures. SYSTÈMES SOLAIRES le journal du photovoltaïque N° 3 – 2010 B A R O M È T R E P H O T OV O L T A Ï Q U E – E U R O B S E R V ’ E R – A V R I L 2 0 1 0
  • 19.
    154 photovoltaic b arometer Suntech Département RD d’une usine chinoise du groupe Suntech ep rt e t o C ese p t o e b t e S tec ro p dépenses de capital, en grande partie pour (Nagano), a décidé de construire une nou- nu net (“net income”) augmente légère- financer son expansion en Malaisie. velle unité de production de modules aux ment à 91,5 millions de dollars (88,2 millions États-Unis, dans la ville de Goodyear en Ari- de dollars en 2008). Suntech ou le high-tech “made in zona. Cette usine, d’une capacité de pro- China” duction initiale de 30 MWc, pourra être Sharp, toujours présent L’industriel chinois s’est confortablement étendue à 120 MWc. Elle devrait permettre Sharp est, avec Kyocera, un des rares installé à la deuxième place du classement à Suntech de conforter son positionnement acteurs historiques qui a su se maintenir mondial avec une production de 704 MWc sur le marché nord-américain. parmi les principaux producteurs. Selon en 2009, contre 495 MWc en 2008. En 2009, D’un point de vue technologique, Suntech Photon international, le leader nippon 41 % de sa production ont été expédiés en a démontré qu’une entreprise chinoise gagne une place dans le classement mon- Allemagne, 33 % dans le reste de l’Europe, était capable de produire des cellules à dial avec une production de 595 MWc (473 12 % en Asie, 10 % en Amérique du Nord, et haut rendement. Le fabricant a en effet MWc en 2008). Bien que la production de 4 % dans le reste du monde. Pour 2010, l’en- annoncé avoir une nouvelle fois augmenté Sharp soit majoritairement tournée vers les treprise prévoit une augmentation de le taux de rendement de ses cellules pro- cellules mono et polycristallines (501 MWc 77,6 % de ses ventes (soit 1 250 MWc). Selon duites avec la technologie Pluto. Celui produits en 2009, + 15 % d’augmentation), Suntech, 37 % de ses modules devraient atteint désormais 19 % en monocristallin et le fabricant a davantage développé son être expédiés en Allemagne, 31 % dans le 17 % en polycristallin. La société prévoit activité couches minces (94 MWc, + 147 % reste de l’Europe, 16 % en Asie, 12 % en Amé- d’en expédier 30 MWc durant la première d’augmentation). Dans ce domaine, sa tech- rique du Nord et 4 % dans le reste du mon- moitié de l’année et 150 MWc dans la nologie consiste en une triple jonction de. Ce niveau de production lui permettrait deuxième moitié de l’année. Cette techno- constituée de 2 couches de silicium amor- de devenir le nouveau leader mondial dès logie a été développée dès l’origine par Sun- phe et d’une couche de silicium microcris- cette année. La capacité de production tech en collaboration avec l’université de tallin. Sharp est resté discret sur ses capa- devrait être augmentée à 1,4 GWc dès la mi- Nouvelle-Galles du Sud, située à Sydney en cités de production. La dernière annonce a 2010 contre 1,1 GWc à la fin de l’année 2009. Australie. été faite en mars 2008 quand l’entreprise a 450 MWc seront consacrés à sa technologie Enfin, sur le plan financier, la baisse du prix annoncé l’ouverture d’une nouvelle usine Pluto à haut rendement (lire plus loin). de vente des cellules explique la diminu- de fabrication de couches minces à Sakai L’entreprise, qui dispose de 5 sites de pro- tion du chiffre d’affaires de l’entreprise (Japon) en mars 2010, d’une capacité initiale duction, dont quatre en Chine (Wuxi, (1 693,3 millions de dollars en 2009 contre Luoyang, Qinghai, Shanghai) et un au Japon 1 923,5 millions de dollars en 2008). Le reve- SYSTÈMES SOLAIRES le journal du photovoltaïque N° 3 – 2010 P H O T OV O L T A I C B A R O M E T E R – E U R O B S E R V ’ E R – A P R I L 2 0 1 0
  • 20.
    157 b aromètre photovoltaïque First Solar no. 1 Pluto technology for its monocrystalline cells and 17% for its poly- First Solar is akin to the black sheep of the photovoltaic industry. crystalline cells. It is planning to ship 30 MWp of these cells over the It has demonstrated that cadmium telluride has a glorious future first half of the year and 150 MWp in the second half of the year. This ahead of it as opposed to crystalline silicon by developing against technology was developed from the outset by Suntech in conjunc- the tide of the main module manufacturers. Opting for this choice tion with the University of New South Wales in Sydney, Australia. now enables it to run for the top PV cell producer slot, by becom- Turning to finance, the reason for the company’s lower sales figures ing the first world manufacturer to pass the one GWp manufac- (1 693.3 million dollars in 2009 as against 1 923.5 million dollars in tured mark in a single year. The manufacturer’s declared produc- 2008) is the drop in cell sales prices. Net income rose slightly to 91.5 tion figure of 1 112.6 MWp in 2009, more than doubles its 2008 million dollars (88.2 million dollars in 2008). output (504 MWp). Of this, 69.5% was produced in Malaysia, 17.5% in Germany and 13% in the United States. In the fourth quarter, the Sharp, still in the running industrialist announced the production cost of its modules at Sharp, together with Kyocera, is one of the few historical actors that $0.84/Wp for a 11.1% module efficiency, which is beyond many of have been able to stay up in the top producer ranks. According to its competitors’ wildest dreams. oto ter t o , the Japanese leader moved up one place in Having boosted its manufacturing capacities in 2009 (from 716 the world ranks with output of 595 MWp (473 MWp in 2008). to 1 228 MWp), First Solar is intending to take a breather in 2010 Although Sharp’s manufacturing is primarily geared to mono and at 1 282 MWp (854 MWp in Malaysia, 214 MWp in Germany and polycrystalline cells (501 MWp produced in 2009, a 15% increase), 214 MWp in Ohio). New investments will then be made in the Japanese manufacturer has developed its thin film business fur- Malaysia (a further 428 MWp) then in France (a further 107 MWp), ther (94 MWp, a 147% increase). increasing capacity to 1 816 MWp. Con- Sharp’s thin film technology consists of a struction work should start in the second triple-junction made up of 2 amorphous sili- half of the year on the French factory at Blanquefort near Bordeaux. This plant will 1 250 p/MWc con films and a microcrystalline silicon film. Sharp is guarded about disclosing its manu- be co-financed by EDF Énergies Nouvelles Suntech’s expected sales in 2010 facturing capacities. The latest announce- which will benefit from all the production Ventes attendues de Suntech en 2010 ment was made in March 2008 when the sold for the first decade’s operation. manufacturer announced it would be open- First Solar’s revenues for 2009 were 2 066.2 million dollars as ing a new thin film manufacturing plant at Sakai in March 2010, against 1 246.3 million dollars generated in 2008. Its net income with an initial capacity of 480 MWp, which should rise to 1 GWp over increased to 640.1 million dollars in 2009 as against 348.3 million the year. dollars in 2008. The American manufacturer is forecasting sales More recently Sharp announced that it had entered an agreement revenues of between 2.7 and 2.9 billion dollars and is intending to with Italian power company Enel Green Power and STMicroelec- earmark 500 to 550 million dollars in capital expenditure, largely tronics (STM) to set up a common subsidiary to manufacture thin to finance its expansion in Malaysia. film cells. Construction work on the factory should start at the beginning of 2011 in STM’s current Italian plant at Catania in Sicily. Suntech or high tech made in China Its initial production capacity will be 160 MWp per year, which could The Chinese industrialist is sitting comfortably in second place in the be increased to 460 MWp. world rankings with output of 704 MWp in 2009, as against 495 MWp in 2008. In 2009, 41% of its production was shipped to Germany, 33% Q-Cells “reloaded” to the rest of Europe, 12% to Asia, 10% to North America, and 4% to Q-Cells was the top world manufacturer in 2008 but only increased the rest of the world. The company expects its sales to increase by its output by 5 MWp to 586 MWp, hence it tumbled to fourth place 77.6% in 2010, (namely 1 250 MWp). According to Suntech, 37% of its in the world ranks, just behind Sharp. This production figure breaks modules will be shipped to Germany, 31% to the rest of Europe, 16% down into 511 MWp from its main German plant at Thalheim, and to Asia, 12% to North America and 4% to the rest of the world. This also includes 20 MWp from its Malaysian plant, 14 MWp from Soli- output level should let it sail past the other manufacturers as of this bro, a German subsidiary specialised in CIGS (Copper indium gal- year. Its manufacturing capacity should rise to 1.4 GWp by the midd- lium diselenide) thin film technology and 1 MWp from Calyxo le of the year as against 1.1 GWp at the end of 2009. Of this capacity GmbH, its other German subsidiary specialised in CdTe technology. 450 MWp will be devoted to its high yield Pluto technology (see The year was very hard for the leading German manufacturer be o ). which was badly hit by the slump in module prices. In 2009 Q-Cells The company, which has 5 manufacturing sites – four in China (Wuxi, recorded a loss of 1.36 billion euros, while its sales contracted by Luoyang, Qinghai and Shanghai) and one in Japan (Nagano), has deci- 35% to 801 million euros. Q-Cells embarked on a recovery plan (dub- ded to construct a new module manufacturing plant in the United bed “Q-Cells reloaded”) combined with the strategic reorientation States, in the city of Goodyear, Arizona. This plant will have an initial of its businesses. The company primarily envisages closing four pro- manufacturing capacity of 30 MWp that may be extended to 120 duction lines in its Thalheim plant that corresponds to a capacity MWp. It should allow Suntech to strengthen its market positioning of 360 MWp (of the plant’s 760-MWp capacity). It is also planning to in North America. invest a sum of 150 to 200 million euros, primarily to develop the Suntech has proven that a Chinese firm is technically capable of capacities of its new manufacturing plant in Malaysia, which manufacturing high-yield cells. The manufacturer has announced that it has increased the yield rate of its cells yet again by using 19% SYSTÈMES SOLAIRES le journal du photovoltaïque N° 3 – 2010 B A R O M È T R E P H O T OV O L T A Ï Q U E – E U R O B S E R V ’ E R – A V R I L 2 0 1 0
  • 21.
    158 photovoltaic b arometer de 480 MWc, qui devait être portée à 1 GWc modules. Q-Cells a enregistré en 2009 une d’euros et sur une amélioration significati- durant l’année. Plus récemment, Sharp a perte de 1,36 milliard d’euros, tandis que ve du résultat d’exploitation. annoncé la signature d’un accord avec son chiffre d’affaires a chuté de 35 % à 801 l’électricien italien Enel Green Power et ST millions d’euros. Q-Cells a entamé un plan SolarWorld, nouveau milliardaire Microelectronics (STM) visant l’établisse- de redressement (nommé “Q-Cells reloa- européen ment d’une filiale commune ayant pour ded”) associé à une réorientation straté- Tous les acteurs européens ne sont pas en objet de produire des cellules couches gique de ses activités. L’entreprise prévoit difficulté. Certains tirent leur épingle du minces. Cette usine, dont la construction notamment de supprimer quatre lignes de jeu, à l’image de SolarWorld. Bien que le devrait débuter au début de l’année 2011 production dans son usine de Thalheim, fabricant allemand ne fasse pas partie du dans l’actuelle usine italienne de STM soit une puissance de 360 MWc sur les 760 top ten des principaux producteurs de cel- (située à Catane, en Sicile), disposera d’une MWc de capacité de l’usine. Elle compte lules photovoltaïques, il est tout de même capacité initiale de 160 MWc qui pourra également investir entre 150 et 200 millions un leader au plan mondial. L’entreprise a être étendue à 460 MWc. d’euros, notamment pour développer les fait un choix différent, celui de disposer des capacités de sa nouvelle usine de produc- capacités de production tout au long de la Q-Cells “reloaded” tion en Malaisie, qui devrait atteindre 600 chaîne de valeur (des plaquettes de silicium Premier fabricant mondial en 2008, Q-Cells MWc fin 2010. Le nouveau patron du groupe, jusqu’aux modules). Elle possédait ainsi, à n’a augmenté sa production que de 5 MWc Nedim Cen, a annoncé que la restructura- la fin de l’année 2009, une capacité de pro- à 586 MWc le reléguant ainsi à la quatrième tion allait se poursuivre. Le groupe a déjà duction de 900 MWc de wafers, de 450 MWc place du classement mondial, juste derrière supprimé 500 emplois sur 2 600 en 2009. de cellules et de 500 MWc de modules. La Sharp. Cette production provient à 511 Q-Cells a également annoncé avoir résolu pleine utilisation de ses capacités de pro- MWc de sa principale usine allemande de son différend avec son fournisseur chinois duction, malgré la conjoncture difficile qui Thalheim. Elle comprend également 20 de wafers LDK Solar et décidé de pour- a marqué l’année 2009, a permis à l’entre- MWc de son usine malaisienne, 14 MWc pro- suivre leur collaboration. Les deux sociétés prise de dépasser ses objectifs en matière venant de Solibro, une filiale allemande ont convenu d’assouplir le calendrier de de chiffre d’affaires et de réaliser un résul- spécialisée dans la technologie couches livraisons des produits et d’instaurer un tat satisfaisant au niveau global. Solar- minces CIGS (cuivre, indium, gallium, sélé- prix flexible basé sur le prix du marché. Les World AG a réalisé en 2009 un chiffre d’af- nium) et 1 MWc provenant de Calyxo GmbH, prix préalablement négociés avec LDK faires de 1  012,6 millions d’euros contre son autre filiale allemande spécialisée dans Solar étaient devenus beaucoup plus éle- 900,3 millions en 2008, soit une progression la technologie CdTe. vés que le prix de marché, grevant un peu de 12,5 %. Le résultat d’exploitation avant L’année aura été très difficile pour le pre- plus la compétitivité du fabricant allemand. intérêt et impôt est marqué par une forte mier fabricant allemand, qui a fortement Pour 2010, l’entreprise mise sur un chiffre souffert de la diminution du prix des d’affaires compris entre 1 et 1,2 milliard SolarWorld Blocs de polysilicium prêts à être transformés en lingot de silicium cristallin, usine du groupe SolarWorld oc s o er s co re to be co erte to cr st e s co ots, So r or ro p pro ct o SYSTÈMES SOLAIRES le journal du photovoltaïque N° 3 – 2010 P H O T OV O L T A I C B A R O M E T E R – E U R O B S E R V ’ E R – A P R I L 2 0 1 0
  • 22.
    159 b aromètre photovoltaïque Graph. n° 3 ning to use this capital base to increase its wafer and module manu- Comparaison de la tendance actuelle avec les objectifs facturing capacities by the end of the year to 1 250 MWp, by concen- du Livre blanc (en MWc). Comparison of the present trend trating production at its Freiberg (Germany) and Hillsboro (United with the White paper objectives (in MWp) States) sites. As SolarWorld prefers to increase demand from its cell Les décimales sont séparées par une virgule. Decimals are written with a suppliers, its cell manufacturing capacities will increase less rapidly comma. Source : EurObserv'ER 2010. to 750 MWp. The company also plans to rely on its own raw materials production. In March 2010, SolarWorld announced the setting up of an agreement for the creation of a common subsidiary with Qatar Solar Technologies and Qatar Foundation. All in all 500 million doll- ars should be invested in the construction of a silicon production site in Qatar. , 2010, a record-breaking year , Everybody agrees that European market growth will again be at the heart of world growth in 2010. The question is how far the , European Union countries can go, in the knowledge that this growth will not be fettered by the availability of modules. All eyes ite aper Livre blanc will be trained on the German market and its capacity to absorb a major share of world production yet again. The more penalizing feed-in tariff sliding scale will not come into force before July, which if what happened in Spain is anything to go by, should lead 2007 2008 2009 2010 to a rush for installations. Another market-friendly element is that the generalised overproduction should once again lead manu- facturers to reduce their profit margins, even if this reduction will should be producing 600 MWp by the end of 2010. The group’s new be much smaller than in 2009. European markets have shown that boss, Nedim Cen, announced that the restructuring would go ahead they are sensitive to this price elasticity and so a drop in prices and 500 of its 2 600 jobs were shed in 2009. will by force enhance the market. Q-Cells also announced that it had resolved its dispute with its Chi- A recent Barclays Bank study revealed its estimates of the German nese wafer supplier LDK Solar and has decided to continue wor- market 2010 as being 35% up at 4 093 MWp. It could turn out to be king together. The two companies have agreed to relax the product much higher, closer to 4 500 MWp, or even 5 000 MWp. Elsewhere delivery schedule and introduce a flexible price schemes based on in Europe, new installation records are awaited in the Czech market price. The prices previously negotiated with LDK Solar had Republic (1 150 MWp more expected according to the Ministry of risen much higher than the market price, harming the German Industry and Trade), Italy (1 000 MWp more according to ENEA) and manufacturer's competitiveness even more. The company is bank- France (500 MWp more according to Observ’ER). There are some ing on sales figures of 1 to 1.2 billion euros for 2010, and a signifi- doubts about the capacity approved by the Spanish authorities cant improvement in its operating results. (theoretically capped at 502 MWp in 2010) and Belgium’s capaci- ties to maintain its high installation level (200 MWp more expect- SolarWorld, the new European billionaire ed according to EDORA). Not all the European actors are in difficulty. Some of them, like Solar- EurObserv’ER has revised its 2010 market forecast quite dramati- World, are pulling through. Although the German manufacturer is cally in the light of these new estimates. Our new estimate is not one of the top ten photovoltaic cell producers, it is still a leader totalised at 23 700 MWp at the end of 2010 ( r p 3), which is on a world level. The company has gone down a different route, almost eight times more than the 1997 European Commission having manufacturing capacities all along the value chain (from sili- White Paper targets for renewable energies. It is true that every con wafers to modules). Thus it had a wafer production capacity of year the solar electricity market dynamics surprise even the sec- 900 MWp, 450 MWp of cells and 500 MWp of modules at the end of tor’s professionals. The proven capacity of manufacturers to 2009. The company exceeded its sales targets and achieved an ove- reduce their production costs, while achieving increasingly high rall satisfactory result by harnessing its manufacturing capacities to yields, opens up new horizons to the sector and a much sunnier the full despite the tight situation that characterised 2009. In 2009 outlook for future generations.  SolarWorld AG’s sales figure was 1 012.6 million euros as against 900.3 million in 2008, rising by 12.5%. Earnings before interest and taxes were marked by a sharp drop in module prices, shrinking from 263.3 million euros in 2008 to 151.8 million euros, with a net annual profit of 91.4 million euros in 2009 as against 135.2 million euros in 2008. The next barometer will be The company issued a bond for the sum of 400 million euros in Janua- about the solar thermal sector ry, to cover its short- and medium-term growth targets, thereby Le prochain baromètre traitera increasing its cash assets to 900 million euros. The company is plan- du solaire thermique SYSTÈMES SOLAIRES le journal du photovoltaïque N° 3 – 2010 B A R O M È T R E P H O T OV O L T A Ï Q U E – E U R O B S E R V ’ E R – A V R I L 2 0 1 0
  • 23.
    160 photovoltaic b arometer Télécharger/Download ché de l’électricité solaire étonne même les professionnels de la filière. La capacité EurObserv’ER met à disposition sur EurObserv’ER is posting an interactive démontrée des fabricants à réduire leurs www.energies-renouvelables.org (langue database of the barometer indicators on coûts de production, tout en affichant des française) et www.eurobserver.org the www.energies-renouvelables.org rendements de plus en plus élevés, ouvre (langue anglaise) une base de donnée (French-language) and des horizons nouveaux à la filière et un ave- interactive des indicateurs du baromètre. www.eurobserv-er.org (English- nir beaucoup plus ensoleillé pour les géné- Disponible en cliquant sur le bandeau language) sites. Click the “Interactive rations futures.  “Interactive EurObserv’ER Database”, EurObserv’ER Database” banner to cet outil vous permet de télécharger les download the barometer data in Excel données du baromètre sous format Excel. format. Sources : IDAE (Spain), ZSW (Germany), ENEA (Italy), SOeS (France), ADEME (France), EDP (Portugal), APE- RE (Belgium), Ministry of industry and trade (Czech baisse du prix des modules. Il diminue à mand et sur sa capacité à absorber une fois Rep.), Helapco (Greece), Oemag (Austria), CertiQ 151,8 millions d’euros contre 263,3 millions de plus une part importante de la produc- (Netherlands), Angstrom Solar (Sweden), CL SENES en 2008. Le bénéfice net annuel s’élève à tion mondiale. La dégressivité accrue du BAS (Bulgaria), IJS (Slovenia), Cyprus Energy Institu- 91,4 millions d’euros contre 135,2 millions tarif d’achat n’interviendra pas avant le te, EPIA, Enovos (Luxembourg), PA Energy (Den- d’euros en 2008. mois de juillet, ce qui devrait, à l’image de mark), ICPE (Romania), MRA (Malta), Solart System Afin d’assurer ses objectifs de croissance à ce qui s’est passé en Espagne en 2008, (Hungary), Energy Center Bratislava (Slovakia), IPE court et à moyen terme, l’entreprise a émis déboucher sur une course à l’installation. (Latvia), TTU (Estonia), EPIA. Special thanks to the PV en janvier une obligation d’un montant de Autre élément favorable pour les marchés, Centre of Warsaw University of Technology for their 400 millions d’euros, augmentant ses li- la surproduction généralisée devrait une contribution to the EurObserv’ER project by sharing quidités disponibles à 900 millions d’euros. nouvelle fois conduire les fabricants à rédui- their data collection from several new member Avec cette assise financière, l’entreprise re leur marge, même si cette réduction de- countries. prévoit d’augmenter d’ici la fin de l’année vrait être beaucoup plus mesurée qu’en ses capacités de production de wafers et de 2009. Les marchés européens ont montré modules à 1250 MWc, concen- qu’ils étaient sensibles à cette trant sa production sur ses élasticité des prix, une dimi- 1 012,6 sites de Freiberg (Allemagne) nution des prix accroissant Ce baromètre a été réalisé par Observ’ER dans le cadre du projet “EurObserv’ER” et de Hillsboro (États-Unis). nécessairement le marché. regroupant Observ’ER (FR), ECN (NL), Les capacités de production Une étude récente de la ban- Eclareon (DE), Institute for Renewable millions€/million € de cellules augmenteront que Barclays a relevé ses esti- Energy (EC BREC I.E.O, PL), Jozef Stefan moins rapidement à 750 MWc, le chiffre d’affaires de mations du marché allemand Institute (SL), avec le soutien financier SolarWorld en 2009 de l’Ademe et de la DG Tren (programme SolarWorld préférant sollici- 2010 de 35 % à 4 093 MWc. La “Énergie Intelligente-Europe”), et publié ter davantage ses fournis- the SolarWorld réalité pourrait être bien par Systèmes Solaires – Le Journal seurs de cellules. L’entreprise revenues in 2009 supérieure, davantage proche des Énergies Renouvelables. Le contenu prévoit également de s’ap- des 4 500 MWc, voire même de cette publication n’engage que la responsabilité de son auteur puyer sur sa propre production de matières des 5000 MWc. Ailleurs en Europe, on attend et ne représente pas l’opinion premières. En mars dernier, elle a annoncé de nouveaux records d’installation, en de la Communauté européenne. la mise en place d’un accord pour la création République tchèque (+ 1 150 MWc attendus La Commission européenne n’est pas d’une filiale commune avec Qatar Solar selon le ministère de l’Industrie et du Com- responsable de l’usage qui pourrait être fait des informations qui y figurent. Technologies et Qatar Foundation. Au total, merce), en Italie (+ 1 000 MWc selon l’ENEA) 500 millions de dollars devront être investis et en France (+ 500 MWc selon l’association This barometer was prepared by dans la construction d’un site de production Observ’ER). Quelques interrogations demeu- Observ’ER in the scope of the “EurObserv’ER” Project which groups de silicium dans l’émirat du Qatar. rent sur la puissance qui sera validée par les together Observ’ER (FR), ECN (NL), autorités espagnoles (théoriquement pla- Eclareon (DE), Institute for Renewable fonnée à 502 MWc en 2010) et sur les capa- Energy (EC BREC I.E.O, PL), Jozef Stefan 2010, année de toUs cités de la Belgique à maintenir un haut Institute (SL), with the financial support of Ademe and DG Tren (“Intelligent Les records niveau d’installation (+ 200 MWc attendus Energy-Europe” programme), and selon EDORA). published by S stè es So res – De l’avis de tous, la croissance du marché Ces nouvelles estimations ont conduit Le o r es É er es e o e b es. européen de l’année 2010 sera une fois de EurObserv’ER à augmenter nettement sa The sole responsibility for the content of this publication lies with the authors. plus au cœur de la croissance mondiale. La prévision du marché 2010. Nous prévoyons It does not represent the opinion question est de savoir jusqu’où les pays de 23 700 MWc cumulés à la fin de l’année 2010 of the European Communities. l’Union européenne pourront aller, sachant (graphique 3), soit près de huit fois les objec- The European Commission is not que cette croissance ne sera pas contrain- tifs définis par le Livre blanc européen des responsible for any use that may be made of the information contained te par la disponibilité de modules. Tous les énergies renouvelables de 1997. Il est vrai therein. regards se porteront sur le marché alle- que, chaque année, la dynamique du mar- SYSTÈMES SOLAIRES le journal du photovoltaïque N° 3 – 2010 P H O T OV O L T A I C B A R O M E T E R – E U R O B S E R V ’ E R – A P R I L 2 0 1 0