Télécharger pour lire hors ligne

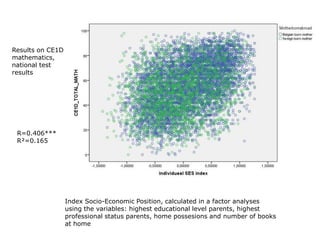
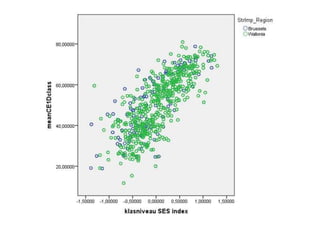
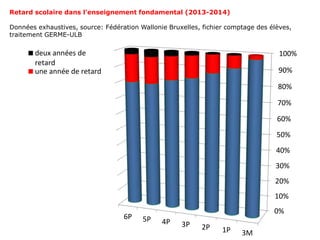
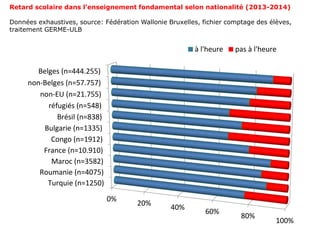
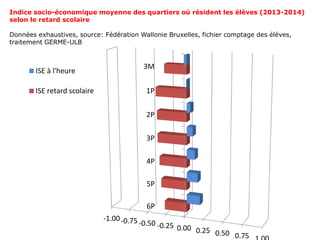
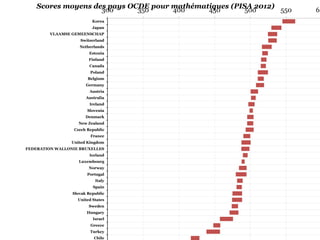
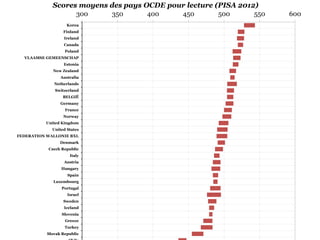
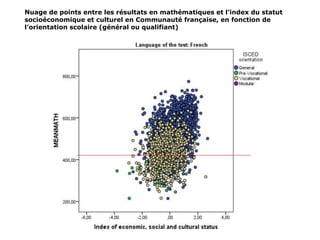
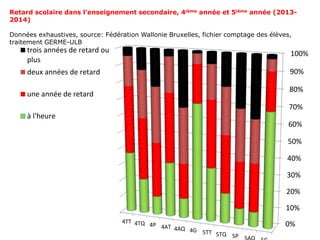
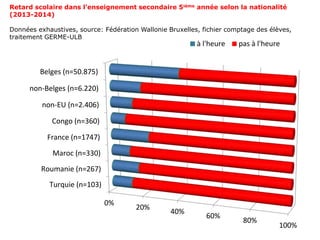
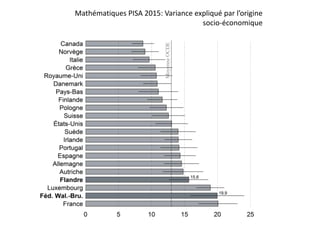
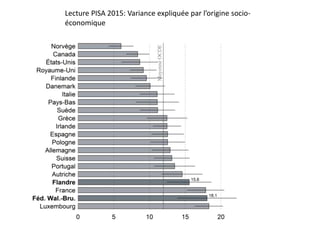
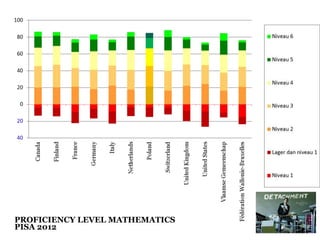
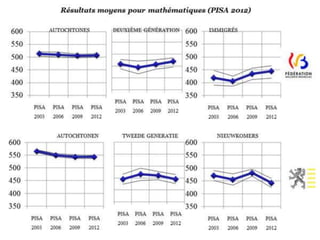
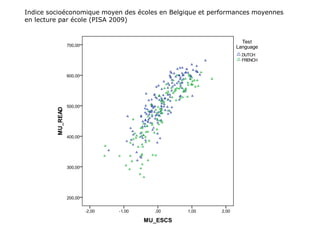
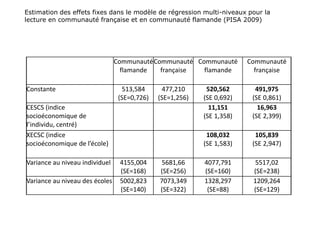
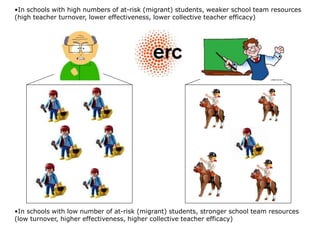

Le document présente une étude sur la performance scolaire des élèves dans les écoles francophones en Belgique, en se basant sur un échantillon de 106 écoles et de 10 395 élèves. Les résultats indiquent une corrélation significative entre le statut socio-économique et les performances en mathématiques, ainsi qu'une variabilité dans les ressources des équipes enseignantes selon la concentration d'élèves à risque. Des données sur le retard scolaire et l'impact des origines socio-économiques et migratoires sont également discutées.


