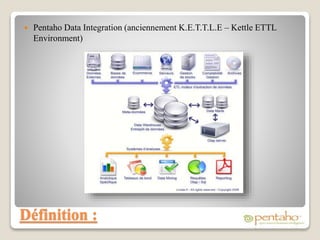
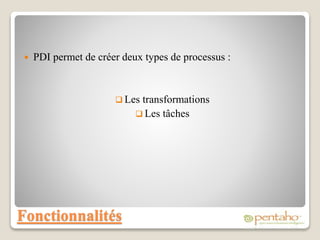
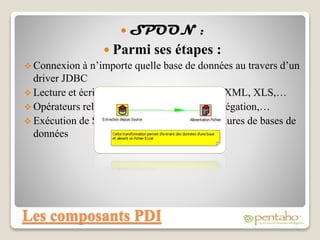
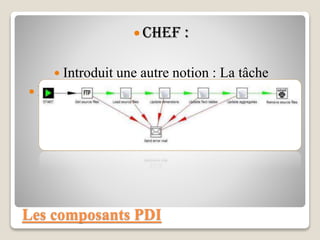
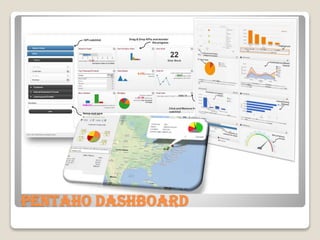
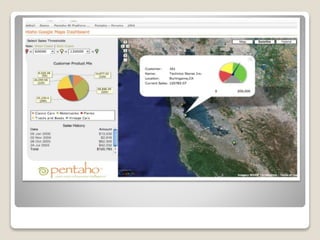
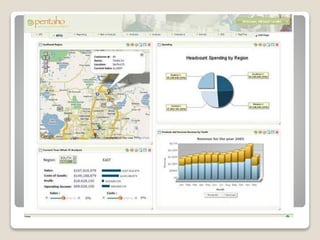
This document discusses designing and developing OLAP cubes and multidimensional structures. It provides an introduction to OLAP and covers components of cubes like dimensions, measures, and data sources. It also outlines the steps to build a cube in SSAS including creating the data source view, dimensions, measures, and deploying the database. Calculations, KPIs, perspectives and other advanced features are also briefly mentioned.
Informatica is a software tool designed to simplify Data Warehouse design and routine tasks related to
data transformation and migration i.e ETL -> Extract,transform and Load.
It is a visual interface and you will be dragging and dropping with the mouse in the Designer(client Application).This graphical approach to communicate with all major databases and can move/transform data between them. It can move huge bulk of data in a very effective way.
Informatica comes in different packages:
Informatica PowerCenter license - has all options, including distributed metadata, ability to organize repositories into a data mart domain and share metadata accross repositories.
PowerMart PowerMart - a limited license (all features except distributed metadata and multiple registered servers)Working
Working with Informatica:
Source database(s), target database(s), repository metadatabase
Informatica Server
Client Software: Designer, Server Manager and Repository Manager.
Modèle de cahier des charges Digital Asset Management (DAM) pour les confirmés.
Retrouvez tous les éléments essentiels à la réalisation de votre projet de DAM (Digital Asset Management) pour la gestion de vos données graphiques, dans notre modèle de cahier des charges, spécialement conçu pour vous.
La deuxième partie sur le cours Business Intelligence et Data warehouse.
Si vous avez des questions, des remarques ou des propositions afin d’améliorer le contenu et la qualité de ce cours, n' hésitez pas à me contacter via mon email:
pr.azizdarouichi@gmail.com.
Bonne lecture.
A. DAROUICHI
SQL Server Analysis Services dans sa version 2012 a introduit la notion de BI Semantic Model, BISM, qui se décline soit en modèle Multidimensionnel, soit en modèle Tabulaire. Les besoins adressés par ces deux modes sont pour une grande part communs, mais les prérequis nécessaires à leur implémentation diffèrent sur de nombreux points qu'il est important de connaître avant de se lancer dans un projet. Durant cette session nous comparerons ces deux modes sur de nombreux critères, qu'ils concernent les administrateurs (infrastructures à mettre en place, maintenabilité, sécurité), les architectes (modélisations relationnelles sous-jacentes et frontaux supportés), les développeurs (techniques d'implémentation, performance des requêtes) et les chefs de projet qu'ils soient techniques ou fonctionnels (cas métier adressés, facilité de mise en place).
Un Système de Gestion de Bases de Données Réparties est constitué d'un ensemble de processeurs autonomes «appelés sites » (stations de travail, micro-ordinateurs, …) reliés par un réseau de communication qui leur permet d'échanger des données. Un SGBDRé suppose que les données soient stockées sur au moins deux sites. Chaque site est doté de son propre SGBD.
Ce support de cours propose une vue d’ensemble sur les avantages et inconvénients de répartition de données. Aussi, il présente les différentes techniques de répartition
Support formation vidéo : Word 2016 - Maîriser les basesSmartnSkilled
Apprenez les habitudes de travail professionnelles avec Word 2016.
- Utiliser les fonctions courantes du traitement de texte Word 2016 avec un bon degré d'autonomie,
- Mettre en forme et partager les documents de manière simple et efficace,
- Avoir des habitudes de travail professionnelles.
Suivez la formation vidéo par ici :
https://www.smartnskilled.com/tutoriel/formation-en-ligne-word-2016-mairiser-les-bases
Connectez Power BI desktop à des centaines de sources de données, analysez-et visualisez vos informations en produisant des tableaux de bords attrayants, interactifs, en temps réel à partager avec vos collègues gestionnaires pour des prises de décisions éclairées.
Un sujet au carrfour des SI , des métiers et de la DG . domaine en pleine évolution , la BI peut faire objet d'approches trés différentes d'une entreprises a une autre . c'est un outil d'aide à la décision et d'analyse de la performance .
Business Intelligence Reporting Solution Imad ALILAT
This presentation will help you understand the basic building blocks of Business Intelligence. Learn how decisions are triggered, the complete decision process and who makes decisions in the corporate world.
More importantly, understand core components of a Business Intelligence architecture such as a data warehouse, data mining, ETL Process (Extract-Transform-Load) and data reporting. Each component plays an integral part which enables today's managers and decision makers collect, analyze and interpret data to make it actionable for decision making.
Business intelligence has become an integral part that needs to be incorporated to ensure business survival. It is a tool that helps analyze historical data and forecast future so that your are always one step ahead in your business.
Please feel free to like, share and comment as you please!
Pentaho is an open source business intelligence suite founded in 2004 that provides reporting, online analytical processing (OLAP) analysis, data integration, dashboards, and data mining capabilities. It can be downloaded for free from pentaho.com or sourceforge.net. Pentaho's commercial open source model eliminates licensing fees and provides annual subscription support and services. Key features include flexible reporting, a report designer, ad hoc reporting, security roles, OLAP analysis, ETL workflows, drag-and-drop data integration, alerts, and data mining algorithms.
The document outlines Annette Tako's portfolio of work in business intelligence including database modeling, ETL development, OLAP development, TSQL, MDX, and reports. It provides examples of a data specification document, data mapping document in Excel, data models designed in SQL Server and Visio, an ETL package built in SSIS, reports created in SSRS and published to SharePoint, Excel reports using an OLAP cube on SharePoint, and a dashboard created in Power BI.
The document provides an overview of the Pentaho BI Suite presentation layer. It discusses interactive reports, which allow casual users to access data sources through drag and drop fields; Analyzer, designed for power users to access data sources and perform advanced sorting/filtering with charts; and Dashboards, which allow easy construction of layouts including dynamic filters and any Pentaho reports. The presentation is accompanied by screenshots demonstrating the creation and customization of reports and dashboards.
This document provides an introduction to the Pentaho business intelligence (BI) platform. It discusses what BI is and why organizations need it. It then describes Pentaho's suite of open source BI tools, including Pentaho Data Integration for ETL, the Pentaho Report Designer for reporting, and the Pentaho BA Server for analytics, dashboards, and administration. The document also presents a case study of how Lufthansa used Pentaho to create real-time dashboards for monitoring airline operations. Finally, it outlines the course curriculum for an Edureka training on Pentaho.
COMPARATIF DES SOLUTIONS SAP LOGISTIQUES (ERP WM, SCM EWM)
Quelles sont les solutions SAP pour améliorer la performance logistique?
Quel outil choisir, en fonction de quel besoin?
Quels sont les apports de EWM (Extended Warehouse Management)?
OLTP systems are used for operational tasks like processing transactions, while OLAP systems are used for analysis of historical data extracted from OLTP systems. OLAP systems allow for complex queries and reporting on aggregated and multidimensional views of the data. Both systems are complementary, with OLTP housing and processing the source transactional data and OLAP leveraging that data for planning, problem solving, and decision making.
ETL (Extract, Transform, Load) is a process that allows companies to consolidate data from multiple sources into a single target data store, such as a data warehouse. It involves extracting data from heterogeneous sources, transforming it to fit operational needs, and loading it into the target data store. ETL tools automate this process, allowing companies to access and analyze consolidated data for critical business decisions. Popular ETL tools include IBM Infosphere Datastage, Informatica, and Oracle Warehouse Builder.
This document summarizes Pentaho Data Integration (Kettle), an open source data integration tool. It discusses Kettle's capabilities for extracting, transforming, and loading data from various sources. Key features include its graphical user interface, support for over 35 database types, flexible transformation capabilities, and large community of users. The document also notes Kettle's use in big data and Hadoop environments and its adoption in small, medium, and large enterprises.
Explore how data integration (or “mashups”) can maximize analytic value and help business teams create streamlined data pipelines that enables ad-hoc analytic inquiries. You’ll learn why businesses increasingly focused on blending data on demand and at the source, the concrete analytic advantages that this approach delivers, and the type of architectures required for delivering trusted, blended data. We provide a checklist to assess your data integration needs and capabilities, and review some real-world examples of how blending various data types has created significant analytic value and concrete business impact.
OLTP systems emphasize short, frequent transactions with a focus on data integrity and query speed. OLAP systems handle fewer but more complex queries involving data aggregation. OLTP uses a normalized schema for transactional data while OLAP uses a multidimensional schema for aggregated historical data. A data warehouse stores a copy of transaction data from operational systems structured for querying and reporting, and is used for knowledge discovery, consolidated reporting, and data mining. It differs from operational systems in being subject-oriented, larger in size, containing historical rather than current data, and optimized for complex queries rather than transactions.
Réussir son analyse des besoins dans la conduite d'un projet informatique (2007)Ardesi Midi-Pyrénées
Présentation des points essentiels à l’analyse des besoins. Dans le cadre de la mise en œuvre d’un projet il faut prendre en compte : son environnement, la constitution de son équipe projet, la communication …
OLAP provides multidimensional analysis of large datasets to help solve business problems. It uses a multidimensional data model to allow for drilling down and across different dimensions like students, exams, departments, and colleges. OLAP tools are classified as MOLAP, ROLAP, or HOLAP based on how they store and access multidimensional data. MOLAP uses a multidimensional database for fast performance while ROLAP accesses relational databases through metadata. HOLAP provides some analysis directly on relational data or through intermediate MOLAP storage. Web-enabled OLAP allows interactive querying over the internet.
6. La petite histoire
KETTLE a été développé il y a 5 ans par Matt CASTERS, un consultant
en Business Intelligence (BI) indépendant, dans un premier temps pour ses
propres besoins
Le projet a été rendu open Source l’année dernière et PENTAHO l’a
acquis au début de l’année 2006.
C’est ainsi que KETTLE est devenu Pentaho Data Integration (PDI). Matt
conserve le leadership sur le projet en tant que « Chief Data Integration »
chez PENTAHO.
8. Les composants PDI
SPOON :
Parmi ses étapes :
Connexion à n’importe quelle base de données au travers d’un
driver JDBC
Lecture et écriture dans des fichiers de type XML, XLS,…
Opérateurs relationnels tel que : Jointure, agrégation,…
Exécution de SQL directe ou appel de procédures de bases de
données
10. Les composants PDI
CHEF :
Introduit une autre notion : La tâche
Il vous permettra de surveiller l’exécution de
vos transformations.
11. Les composants PDI
Kitchen :
C’est un outil de développement de chaînes ETL,
permet d’ordonnancer les différentes transformations
développées avec Spoon