Télécharger en tant que PDF, PPTX

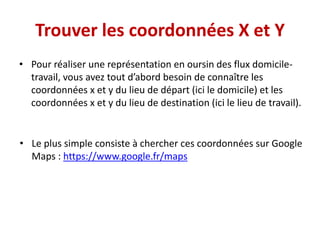
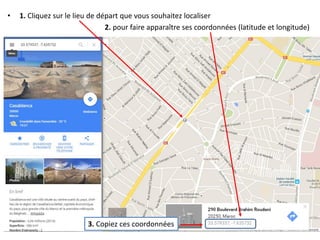
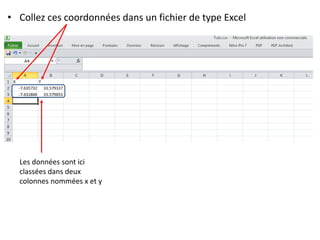
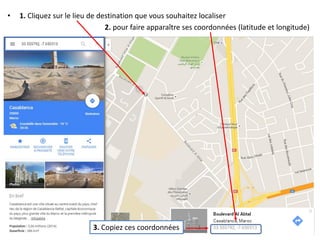
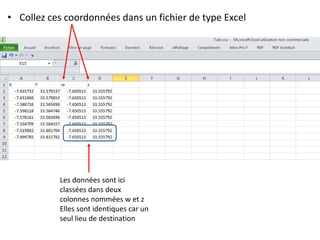
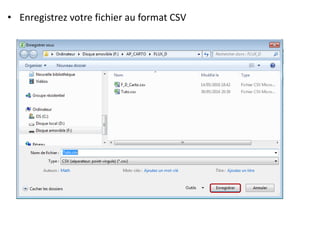
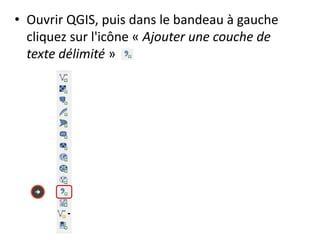
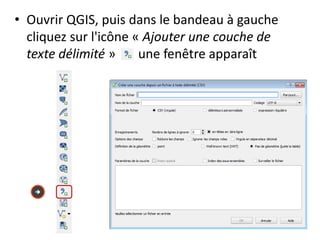
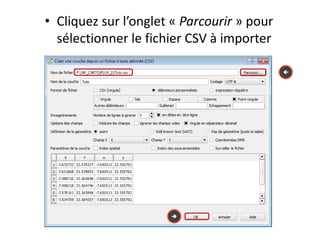
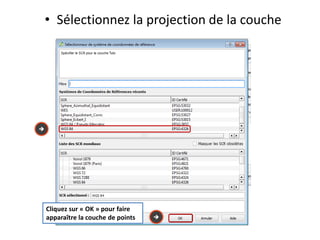
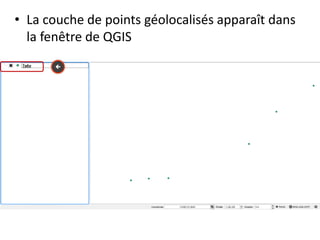
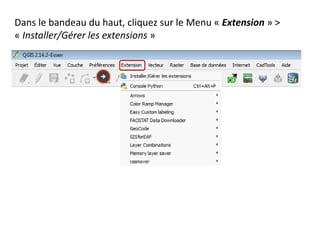
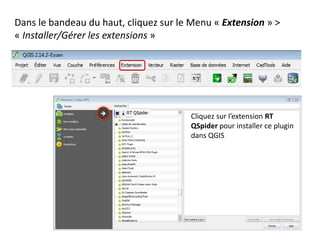
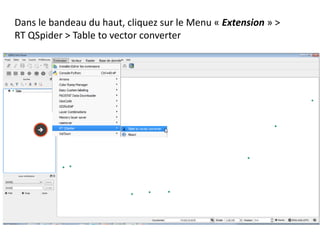
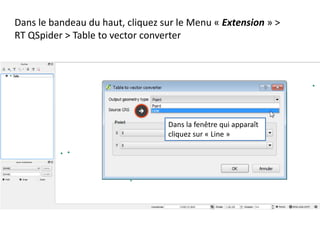
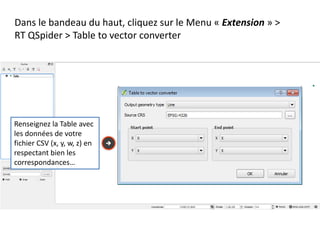
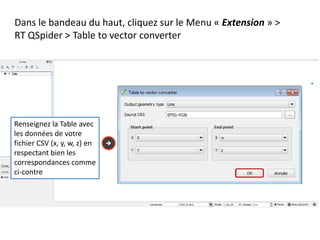
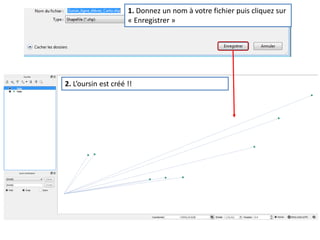
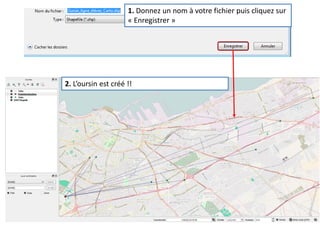

Le document fournit un guide pour réaliser une représentation en oursin des flux domicile-travail en utilisant le plugin rt qspider dans QGIS. Il détaille les étapes pour obtenir les coordonnées x et y des lieux de départ et d'arrivée via Google Maps, les enregistrer dans un fichier CSV et les importer dans QGIS. Une fois les données importées, il explique comment installer le plugin rt qspider et créer l'oursin à partir des données fournies.


