
Recommandé
Recommandé
Contenu connexe
Tendances
Tendances (20)
En vedette
En vedette (11)
Similaire à Catalogue COSSECO 2014 - Pompe à Chaleur Photovoltaïque
Similaire à Catalogue COSSECO 2014 - Pompe à Chaleur Photovoltaïque (20)
Dernier
Dernier (11)
Catalogue COSSECO 2014 - Pompe à Chaleur Photovoltaïque
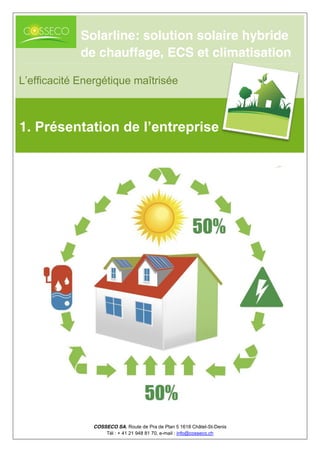
- 1. COSSECO SA, Route de Pra de Plan 5 1618 Châtel-St-Denis Tél : + 41 21 948 81 70, e-mail : info@cosseco.ch L’efficacité Energétique maîtrisée Solarline: solution solaire hybride de chauffage, ECS et climatisation 1. Présentation de l’entreprise
- 2. SOLARLINE Auteur : de Siebenthal Christophe Date : 21.03.2014
- 3. Plan de la présentation Introduction Liste de matériels Principe géothermique Distribution hydraulique Références Principe aérothermique Distribution hydraulique Références Contact
- 4. Introduction « SOLARLINE » est une solution de régulation énergétique innovante développée en Suisse pour réduire la consommation électrique des pompes à chaleur classique. À l’aide d’un régulateur électronique intelligent et d’un système de stockage d’énergie innovant, le système va coupler l’électricité solaire produite par vos panneaux photovoltaïque avec celle du réseau électrique permettant ainsi de chauffer votre eau sanitaire et votre système de chauffage domestique. « SOLARLINE » possède aussi un mode réversible qui vous permet de climatiser votre maison gratuitement à l’aide de l’énergie solaire qui est abondante en été. De plus, cette réversibilité, vous permet de recharger vos sondes géothermique.
- 5. L’apport solaire de la journée couvre tous les besoins : chauffage / rafraichissement et Eau Chaude Sanitaire. Le surplus d’énergie produit par les panneaux photovoltaïques est alors converti par la PAC en eau chaude / froide et est stocké dans des ballons pendant le jour puis diffusé pendant la nuit.
- 6. Si l’apport solaire photovoltaïque ne couvre pas tous les besoins, la solution «Solarline» prend un apport du réseau électrique pour conserver le bâtiment à la température demandée. De plus, si le tarif électrique est plus favorable la nuit, alors «Solarline» peut chauffer de l’eau la nuit pour une utilisation de chauffage pendant la journée.
- 7. Liste de matériels Un kit «Solarline» standard : Pompe à chaleur Panneaux photovoltaïque Coffret de régulation intelligente Ballon d’eau chaude sanitaire Ballon de stockage d’énergie Circulateurs Vannes trois-voies Sondes de température Le coffret de régulation : Automate programmable SAIA Régulateurs solaire «Cosseco» Variateurs de vitesse (compresseur) Variateurs de vitesse (ventilateur) Interface utilisateur Protection et sécurité Bypass manuel
- 16. Contact Pour d’éventuelles questions, veuillez nous contacter : Téléphone : 021 948 81 70 E-mail : info@cosseco.ch Fax : 021 948 81 72 Pour observer le fonctionnement d’une de nos installation en temps réel, rendez-vous sur notre site internet : http://www.cosseco.ch/performance-pompe-a-chaleur-solarline
- 17. COSSECO SA, Route de Pra de Plan 5 1618 Châtel-St-Denis Tél : + 41 21 948 81 70, e-mail : info@cosseco.ch L’efficacité Energétique maîtrisée Solarline: solution solaire hybride de chauffage, ECS et climatisation 2. Kit Solarline
- 18. Coffret 10[kW] thermique (SA-10) Version 1.0 le 27.03.2014
- 19. Page 3 sur 26 SA-10 Gamme : Aérothermie Générateur : Solarline Auteur : de Siebenthal Christophe Date de création ou modification: 27/03/2014 1. Introduction Le coffret électrique permet de piloter toutes les solutions de produits SA-10 de COSSECO. Principe de chauffage : L’utilisateur fixe une consigne qui sera atteinte en combinant l’énergie du réseau et l’énergie solaire. L’eau chaude sanitaire est prioritaire. Tant que la consigne n’est pas atteinte, le système se focalise sur le ballon ECS. Une fois la consigne de l’eau chaude sanitaire atteinte, le système va faire du stockage. Les deux modes de climatisation : L’utilisateur fixe une température de consigne qui sera atteinte en combinant l’énergie du réseau et l’énergie solaire. L’utilisateur fixe une température de consigne et le système utilise uniquement l’énergie solaire pour essayer de l’atteindre. Un kit standard inclut : Pompe à chaleur aérothermique Panneaux photovoltaïques Ballon d’eau chaude sanitaire Ballon de stockage d’énergie (sous forme d’eau chaude/froide) Sondes intérieurs & extérieur 2 Circulateurs (PAC => Ballon, Ballon => Chauffage domestique) Vanne trois voies (Mode stockage & Mode ECS) Vanne trois voies mélangeuse (Chauffage domestique) Caractéristiques technique Coffret aérothermique 10 [kW] maximum Cartes solaires (puissances disponible) : 1.5 – 2 – 2.5 [kW] Variateur de vitesse « Compresseur » 3.7 [kW] Variateur de vitesse « Ventilateur » 0.2 [kW]
- 20. Page 4 sur 26 SA-10 Gamme : Aérothermie Générateur : Solarline Auteur : de Siebenthal Christophe Date de création ou modification: 27/03/2014 2. Schéma bloc Puissance : Compresseur Ventilateur Signaux : Alarmes Température Pression Ballon Eau Chaude Sanitaire Panneaux Photovoltaïques Réseau électrique (Tableau électrique principal) PAC Aérothermique Coffret SA-10 Régulation & Modulation en puissance de la PAC Lecture des sondes de température Paramétrages divers Chauffage & Climatisation Alimentations Sonde température extérieur Sonde(s) température intérieur Ballon Stockage Intérieur Légende : Extérieur
- 21. Page 5 sur 26 SA-10 Gamme : Aérothermie Générateur : Solarline Auteur : de Siebenthal Christophe Date de création ou modification: 27/03/2014 3. Schéma de principe hydraulique PAC Aérothermique Vannes manuel Vannes manuel Vannes manuel Vannes manuel Vannes manuel Vanne 3 voies Circulateur Vannes manuel Zone 1 Chauffage Climatisation Circulateur Vanne 3 voies Thermoplongeur Sonde Sonde StockageECS Thermoplongeur Echangeur
- 22. Page 7 sur 26 SA-10 Gamme : Aérothermie Générateur : Solarline Auteur : de Siebenthal Christophe Date de création ou modification: 27/03/2014 5. Schéma hydraulique
- 23. Page 11 sur 26 SA-10 Gamme : Aérothermie Générateur : Solarline Auteur : de Siebenthal Christophe Date de création ou modification: 27/03/2014 6.2.Mécanique 6.2.1. Structure du coffret Bornes Caniveau Caniveau Caniveau Caniveau Contacteur [Princ..Solair] Portefusible Disjoncteur De Phase Alimentation 24V Disjoncteurde sécurité Var1 COMP Var2 FAN Caniveau Relais K5[0..7] Mesure de courant 24V IN Carte solaire OUT Automate Commutateur desécurité
- 24. Page 26 sur 26 SA-10 Gamme : Aérothermie Générateur : Solarline Auteur : de Siebenthal Christophe Date de création ou modification: 27/03/2014 7. Contact En cas de problème / question veuillez nous contacter : Téléphone : 021 948 81 70 E-mail : support@cosseco.ch
- 25. COSSECO SA, Route de Pra de Plan 5 1618 Châtel-St-Denis Tél : + 41 21 948 81 70, e-mail : info@cosseco.ch L’efficacité Energétique maîtrisée Solarline: solution solaire hybride de chauffage, ECS et climatisation 3. Pompes à Chaleur (PAC)
- 26. Données techniques Solarline CSAW10R1 COSSECO SA, Route de Pra de Plan 5 1618 Châtel-St-Denis Tél : + 41 21 948 81 70, e-mail : info@cosseco.ch Solarline CSAW10R1 Dimensions et technologie Dimensions $:% $:% $:% $:% $:% $:+ $:+ Dimensions Positioning SIDE FAN UNITS AW09B AW10B 600mm400mm 350mm 1,000mm AW12B AW13B AW15B AW12/H AW13/H Positioning
- 27. Données techniques Solarline CSAW10R1 COSSECO SA, Route de Pra de Plan 5 1618 Châtel-St-Denis Tél : + 41 21 948 81 70, e-mail : info@cosseco.ch 1. Compresseur Hitachi scroll 9. Echangeur à palques brasées Swep 2. Connection de service 10. Corp résistif (optionel) 3. Vanne basse pression Emerson 11. Pompe de circulation (optionnelle) 4. Vanne haute pression Emerson 12. Accumulateur 5. Moteur de Fan 13. Séparateur liquide - gaz 6. Pale de Fan 14. Vanne d’expansion Emerson 7. Echangeur 15. Jauge de basse pression 8. Vanne 4 voies 16. Vanne differentiel de pression 46 Components AW09B AW10B 1 8 4 2 3 5 6 7 10 12 13 15 14 9 16 11 Components 1. Compressor 2. Service connection 3. Low pressure switch 4. High pressure switch 5. Fan motor 6. Fan blade 7. Finned coil heat exchanger 8. Four way valve 9. Plate heat exchanger 10. Electric heater (optional) 11. Water pump (optional) 12. Accumulator 13. Gas-liquid separator 14. Expansion valve 15. Low pressure gauge 16. Differential pressure flow switch 46 1 4 2 3 5 10 12 13 15 14 9 16 11 9. Plate he 10. Electri 11. Water p 12. Accum 13. Gas-liq 14. Expans 15. Low pr 16. Differe
- 28. Données techniques Solarline CSAW10R1 COSSECO SA, Route de Pra de Plan 5 1618 Châtel-St-Denis Tél : + 41 21 948 81 70, e-mail : info@cosseco.ch Performances et caractéristiques! Les données ci-dessus sont testées sous la norme EN14511 . 4.07 3.18 2.49 3.65 2.71 COP 3.13 2.09 2.88 HITACHI Scroll CSAW10R1 Production de chaleur / consommation électrique à 7/35° kW 11.0/2.7 Production de chaleur / consommation électrique à 7/45 kW 10.5/3.3 Production de chaleur / consommation électrique à 7/55 kW 10.2/4.1 Production de chaleur / consommation électrique à 2/35 kW 9.5/2.6 Production de chaleur / consommation électrique à 2/45 kW 9.2/3.4 Production de chaleur / consommation électrique à -7/35 kW 7.2/2.3 Production de chaleur / consommation électrique à -7/45 kW 7.1/3.4 Production de froid / consommation électrique à 35/7 kW 9.5/3.3 1.87 23 3000 220 Puissance 55 1050x1050x450 DN25 Compresseur Condenseur 125 Flux nominal du liquide de chauffage m^3/h Chute de pression interne à flux nominal kPa Flux d'air maximum m3/h Puissance maximale du Fan W 380-415V / 3 phases / 50 Hz Température de chauffe maximale Dimensions (HxLxP) mm Connexion Poids kg
- 29. Données techniques Solarline CSAW10R1 COSSECO SA, Route de Pra de Plan 5 1618 Châtel-St-Denis Tél : + 41 21 948 81 70, e-mail : info@cosseco.ch Courbes de puissances Heat pump performance curve 5 1=Flow temperature 35 Full load 2=Flow temperature 45 Full load 3=Flow temperature 55 Full load Heating performance curve Ambient temp. Ambient temp. Ambient temp.
- 30. Données techniques Solarline CSAW10R1 COSSECO SA, Route de Pra de Plan 5 1618 Châtel-St-Denis Tél : + 41 21 948 81 70, e-mail : info@cosseco.ch Courbe de refroidissement Chute de pression Water Pressure Plots m3/h 10 20 30 1.0 2.0 3.0 4.0 40 KPa AW09B AW10B Optional water pump curve (AW09B AW10B ) Water Pressure PlotsWater Pressure Plots m3/h 10 20 30 1.0 2.0 3.0 4.0 40 KPa AW09B AW10B Optional water pump curve (AW09B AW10B ) Water Pressure Plots
- 31. Données techniques Solarline SA-13 COSSECO SA, Route de Pra de Plan 5 1618 Châtel-St-Denis Tél : + 41 21 948 81 70, e-mail : info@cosseco.ch Solarline SA-13 Dimensions et technologie ,,001,,00 23,00 /4,,,00 !
- 32. Données techniques Solarline SA-13 COSSECO SA, Route de Pra de Plan 5 1618 Châtel-St-Denis Tél : + 41 21 948 81 70, e-mail : info@cosseco.ch Performances et caractéristiques Les données ci-dessus sont testées sous la norme EN14511 . 2.88 2.02 2.84 HITACHI Scroll 4.00 3.14 2.64 3.53 2.74 Production de chaleur / consommation électrique à 2/35 kW 12.0/3.4 Production de chaleur / consommation électrique à 2/45 COP Production de chaleur / consommation électrique à 7/45 kW 13.5/4.3 Production de chaleur / consommation électrique à 7/55 kW 13.2/5.0 SA-13 Production de chaleur / consommation électrique à 7/35° kW 14.0/3.5 kW 11.8/4.3 Production de chaleur / consommation électrique à -7/35 kW 9.5/3.3 Puissance 380-415V / 3 phases / 50 Hz Production de chaleur / consommation électrique à -7/45 kW 8.9/4.4 Production de froid / consommation électrique à 35/7 kW 12.2/4.3 Poids 55 1075 x 1105 x 505 DN25 Compresseur Condenseur 0.67 24 5000 300 kg 175 Flux nominal du liquide de chauffage l/s Chute de pression interne à flux nominal kPa Flux d'air maximum m3/h Puissance maximale du Fan W Température de chauffe maximale Dimensions (HxLxP) mm Connexion
- 33. Données techniques Solarline SA-13 COSSECO SA, Route de Pra de Plan 5 1618 Châtel-St-Denis Tél : + 41 21 948 81 70, e-mail : info@cosseco.ch Courbe de puissance de chauffage Ambient temp. Ambient temp. Ambient temp.
- 34. Données techniques Solarline SA-13 COSSECO SA, Route de Pra de Plan 5 1618 Châtel-St-Denis Tél : + 41 21 948 81 70, e-mail : info@cosseco.ch Courbe de puissance de refroidissement
- 35. Données techniques Solarline SA-13 COSSECO SA, Route de Pra de Plan 5 1618 Châtel-St-Denis Tél : + 41 21 948 81 70, e-mail : info@cosseco.ch Chute de pression Composants 1. Compresseur Hitachi scroll 9. Echangeur à palques brasées Swep 2. Connection de service 10. Corp résistif (optionel) 3. Vanne basse pression Emerson 11. Pompe de circulation (optionnelle) 4. Vanne haute pression Emerson 12. Accumulateur 5. Moteur de Fan 13. Séparateur liquide - gaz 6. Pale de Fan 14. Vanne d’expansion Emerson 7. Echangeur 15. Jauge de basse pression 8. Vanne 4 voies 16. Vanne differentiel de pression
- 36. Données techniques Solarline SA-15 COSSECO SA, Route de Pra de Plan 5 1618 Châtel-St-Denis Tél : + 41 21 948 81 70, e-mail : info@cosseco.ch Solarline SA-15 Dimensions et technologie ,,001,,00 23,00 /4,,,00 !
- 37. Données techniques Solarline SA-15 COSSECO SA, Route de Pra de Plan 5 1618 Châtel-St-Denis Tél : + 41 21 948 81 70, e-mail : info@cosseco.ch 1. Compresseur Hitachi scroll 10. Pompe de circulation (optionnelle) 2. Vanne haute pression Emerson 11. Vanne de basse pression 3. Connection de service 12. Vanne d’expansion Emerson 4. Vanne 4 voies 13. Distributeur 5. Echangeur 14. Filtre 6. Moteur de Fan 15. Séparateur Gaz / Liquide 7. Pale de Fan 16. Filtre Sec 8. Echangeur à palques brasées Swep 17. Accumulateur 9. Corp résistif (optionel) 18. Gauge basse pression ! ! !' ! !( !! !) !* !# ! ! !#$%'!#(%'!#)%' ! # $ !% ' ( ) * !$ !
- 38. Données techniques Solarline SA-15 COSSECO SA, Route de Pra de Plan 5 1618 Châtel-St-Denis Tél : + 41 21 948 81 70, e-mail : info@cosseco.ch Performances et caractéristiques!! Les données ci-dessus sont testées sous la norme EN14511 . kg 180 Flux nominal du liquide de chauffage l/S Chute de pression interne à flux nominal kPa Flux d'air maximum m3/h Puissance maximale du Fan W Température de chauffe maximale Dimensions (HxLxP) mm Connexion Poids 55 1075 x 1105 x 505 DN25 Compresseur Condenseur 0.76 31 5000 300 Puissance 380-415V / 3 phases / 50 Hz Production de chaleur / consommation électrique à -7/45 kW 10.2 / 5.1 Production de froid / consommation électrique à 35/7 kW 14.5 / 5.2 kW 13.3 / 5.0 Production de chaleur / consommation électrique à -7/35 kW 10.8 / 3.9 SA-15 Production de chaleur / consommation électrique à 7/35° kW 16.2 / 4.1 Production de chaleur / consommation électrique à 7/45 kW 15.4 / 5.0 Production de chaleur / consommation électrique à 7/55 kW 14.8 / 6.2 Production de chaleur / consommation électrique à 2/35 kW 13.8 / 4.3 Production de chaleur / consommation électrique à 2/45 COP 2.77 2.00 2.79 HITACHI Scroll 3.95 3.08 2.39 3.21 2.66
- 39. Données techniques Solarline SA-15 COSSECO SA, Route de Pra de Plan 5 1618 Châtel-St-Denis Tél : + 41 21 948 81 70, e-mail : info@cosseco.ch Courbe de chauffage 1=Flow temperature 35 Full load 2=Flow temperature 45 Full load 3=Flow temperature 55 Full load Heating performance curve Ambient temp. Ambient temp. Ambient temp.
- 40. Données techniques Solarline SA-15 COSSECO SA, Route de Pra de Plan 5 1618 Châtel-St-Denis Tél : + 41 21 948 81 70, e-mail : info@cosseco.ch Courbe de refroidissement Chute de pression
- 41. Données techniques Solarline SA-20 COSSECO SA, Route de Pra de Plan 5 1618 Châtel-St-Denis Tél : + 41 21 948 81 70, e-mail : info@cosseco.ch Solarline SA-20 Dimensions !! ! ! ! Main parts Item AW20B Compressor Hitachi Plate heat exchanger Swep//GEA Expansion valve Emerson Controller Siemens Electric parts Schneider A/ C wat er i nl et A/ C wat er out l et 134.5 152155 129 1,307 695 1,045 1,025 740 1,080 AW20 AW20B TOP FAN UNITS AW20B LSQ31 ı900mm ı900mm ı2,000mm Positioning
- 42. Données techniques Solarline SA-20 COSSECO SA, Route de Pra de Plan 5 1618 Châtel-St-Denis Tél : + 41 21 948 81 70, e-mail : info@cosseco.ch !!!!!!!!!!!!!!!!!!!!!!!!! Composants Compresseur Hitachi scroll Echangeur à palques brasées Swep Vanne d’expansion Emerson Vanne haute pression Emerson Vanne basse pression Emerson
- 43. Données techniques Solarline SA-20 COSSECO SA, Route de Pra de Plan 5 1618 Châtel-St-Denis Tél : + 41 21 948 81 70, e-mail : info@cosseco.ch Performances et caractéristiques!! ! Les données ci-dessus sont testées sous la norme EN14511 . kg 270 Flux nominal du liquide de chauffage l/s Chute de pression interne à flux nominal kPa Flux d'air maximum m3/h Puissance maximale du Fan W Température de chauffe maximale Dimensions (HxLxP) mm Connexion Poids 55 1050 x 1300 x 690 DN40 Compresseur Condenseur 1.03 38 6'000 440 Puissance 380-415V / 3 phases / 50 Hz Production de chaleur / consommation électrique à -7/45 kW 14.2/6.9 Production de froid / consommation électrique à 35/7 kW 19.6/6.8 kW 18.5/6.8 Production de chaleur / consommation électrique à -7/35 kW 14.3/5.0 Echangeur à plaques brazées SA-20 Production de chaleur / consommation électrique à 7/35° kW 21.7/5.1 Production de chaleur / consommation électrique à 7/45 kW 21.4/6.8 Production de chaleur / consommation électrique à 7/55 kW 20.8/8.4 Production de chaleur / consommation électrique à 2/35 kW 18.9/5.2 Production de chaleur / consommation électrique à 2/45 COP 2.86 2.06 2.88 HITACHI Scroll 4.25 3.15 2.48 3.63 2.72
- 44. Données techniques Solarline SA-20 COSSECO SA, Route de Pra de Plan 5 1618 Châtel-St-Denis Tél : + 41 21 948 81 70, e-mail : info@cosseco.ch Courbes de chauffageHeat pump performance curve 1=Flow temperature 35 Full load 2=Flow temperature 45 Full load 3=Flow temperature 55 Full load Heating performance curve Ambient temp. Ambient temp. Ambient temp. PuissancechaudP.ElectriqueCOP
- 45. Données techniques Solarline SA-20 COSSECO SA, Route de Pra de Plan 5 1618 Châtel-St-Denis Tél : + 41 21 948 81 70, e-mail : info@cosseco.ch Courbe de refroidissement Chute de pression PuissancefroidCOP
- 46. Données techniques Solarline SA-32 COSSECO SA, Route de Pra de Plan 5 1618 Châtel-St-Denis Tél : + 41 21 948 81 70, e-mail : info@cosseco.ch Solarline SA-32 Dimensions et implantation Heat pump dimension LSQ31R1/R A/C water inlet A/C water outlet Hot water outlet Hot water inlet 152152155 129 84.5 1,080 695 1,239 1,215 1,320 740 170 1,330
- 47. Données techniques Solarline SA-32 COSSECO SA, Route de Pra de Plan 5 1618 Châtel-St-Denis Tél : + 41 21 948 81 70, e-mail : info@cosseco.ch Performances SA-32 Les données ci-dessus sont testées sous la norme EN14511 . Production de chaleur / consommation électrique à 7/35 kW 32.0 / 8.4 COP = 3.81 SA-32 Production de chaleur / consommation électrique à 7/45 * kW 31.2 / 10.0 COP = 3.12 Production de chaleur / consommation électrique à 7/55 * kW 30.0 / 12.6 COP = 2.38 Production de chaleur / consommation électrique à 2/35 kW 26.8 / 8.4 COP = 3.19 Production de chaleur / consommation électrique à 2/45 * kW 26.4 / 10.0 COP = 2.64 Production de chaleur / consommation électrique à -7/35 * kW 20.8 / 8.2 COP = 2.54 Production de chaleur / consommation électrique à -7/45 * kW 20.4 / 9.6 COP = 2.13 Production de froid / consommation électrique à 35/7° kW 31.0 / 10.8 COP = 2.87 Puissance 380-415V/3PH/50Hz Flux d'eau chaude entre 20 et 50°C l/h 1100 Compresseur 2 * HITACHI scroll Condenseur Echangeur à plaques brasées Flux nominal du liquide de chauffage m3 /h Chute de pression interne à flux nominal kPa 5.4 30 Flux d'air maximum m3/h 10'000 Puissance maximale du Fan W 820 Température de chauffe maximale 58 Dimensions (HxLxP) mm 1'325 X 1'300 X 690 Connexion DN 40 Poids kg 310
- 48. Données techniques Solarline SA-32 COSSECO SA, Route de Pra de Plan 5 1618 Châtel-St-Denis Tél : + 41 21 948 81 70, e-mail : info@cosseco.ch Courbe de chauffage SA-32 Heat pump performance curve 1=Flow temperature 35 Full load 2=Flow temperature 45 Full load 3=Flow temperature 55 Full load Ambient temp. Heating performance curve Model:LSQ31R1/R P.Thermique!P.Electrique!
- 49. Données techniques Solarline SA-32 COSSECO SA, Route de Pra de Plan 5 1618 Châtel-St-Denis Tél : + 41 21 948 81 70, e-mail : info@cosseco.ch Courbe de froid SA-32 Courbe de chute de pression SA-32 Heat pump water pressure drop m3/h 10 20 30 2.0 3.0 4.0 40 KPa 5.0 6.0 7.0 P.Thermique!P.Electrique! 1=Flow temperature 5 Full load 2=Flow temperature 7 Full load 3=Flow temperature 9 Full load Ambient temp. Cooling performance curve
- 50. Données techniques Solarline SW-10 SW-13 SW-15 SW-20 COSSECO SA, Route de Pra de Plan 5 1618 Châtel-St-Denis Tél : + 41 21 948 81 70, e-mail : info@cosseco.ch Solarline SW-10, 13, 15 et 20 Dimensions et technologie Main parts Dimension GHP07B GHP09B GHP10B GHP12B GHP13B GHP15B GHP20B Unit:mm 60 outdoor outlet outdoor inlet indoor outlet indoor inlet Sensor outletpower cable outlet 450 30 450 543 100 920 24080 80 115 600 600 600 600 Model GHP07B GHP09B GHP10B GHP12B GHP13B GHP15B GHP20B Compressor Panasonic Daikin Hitachi Daikin Hitachi Hitachi Hitachi Plate exchanger Swep/Gea Swep/Gea Swep/Gea Swep/Gea Swep/Gea Swep/Gea Swep/Gea Expansion valve Emerson Emerson Emerson Emerson Emerson Emerson Emerson Controller Siemens Siemens Siemens Siemens Siemens Siemens Siemens Electric parts Schneider Schneider Schneider Schneider Schneider Schneider Schneider Filter drier Emerson Emerson Emerson Emerson Emerson Emerson Emerson Refrigerant Liquid indicator Emerson Emerson Emerson Emerson Emerson Emerson Emerson
- 51. Données techniques Solarline SW-10 SW-13 SW-15 SW-20 COSSECO SA, Route de Pra de Plan 5 1618 Châtel-St-Denis Tél : + 41 21 948 81 70, e-mail : info@cosseco.ch Performances et caractéristiques! ! Modèle Type SW-10 SW-13 SW-15 SW-20 Caractéristiques Dimensions HxWxD Poids kg 135 145 155 165 Refrigerant Type Masse de remplissage kg 1.7 1.8 2.2 2.25 Presison de fonctionnement Mpa 4.2 4.2 4.2 4.2 Taille de connecteur hydraulique - chaud Pouces G1” G11/4” G11/4” G11/2” Taille de connecteur hydraulique - froid Pouces G1” G11/4” G11/4” G11/2” Evaporateur Type Condenseur Type Compresseur Type Performances Puissance thermique - chaud à B0/W35 kW 10 13 15.5 20.3 Consommation électrique kW 2.22 2.9 3.5 4.6 COP 4.5 4.48 4.43 4.41 Débit - circuit intérieur m3/h 1.72 2.24 2.67 3.49 Chute de pression - circuit intérieur kpa 12 14 14 14 Débit - circuit extérieur m3/h 2.23 2.9 3.44 4.5 Chute de pression - circuit extérieur kpa 20 23 25 24 Puissance thermique - chaud à W10/W35 kW 12.7 16.3 19.5 25.7 Consommation électrique kW 2.27 2.96 3.57 4.68 COP 5.59 5.51 5.46 5.49 Débit - circuit intérieur m3/h 2.18 2.8 3.35 4.42 Débit - circuit extérieur m3/h 2.99 3.82 4.57 6.03 Puissance thermique - froid à W35/W7 kW 10.6 13.9 16.3 21.8 Consommation électrique kW 2.2 2.85 3.4 4.5 COP 4.82 4.88 4.79 4.84 Débit - circuit intérieur m3/h 1.82 2.39 2.8 3.75 Débit - circuit extérieur m3/h 2.2 2.88 3.39 4.52 Power Type Sound power level dB(A) 47 48 48 48 960 x 600 x 600 R410A Echangeur à plaques brazées Swep Echangeur à plaques brazées Swep Hitachi scroll Triphasé
- 52. Données techniques Solarline SW-10 SW-13 SW-15 SW-20 COSSECO SA, Route de Pra de Plan 5 1618 Châtel-St-Denis Tél : + 41 21 948 81 70, e-mail : info@cosseco.ch Courbes de puissance chauffage SW-10 1=Flow temperature 35 Full load 2=Flow temperature 45 Full load 3=Flow temperature 55 Full load Heating performance curve Heating Performance Conditions Curve
- 53. Données techniques Solarline SW-10 SW-13 SW-15 SW-20 COSSECO SA, Route de Pra de Plan 5 1618 Châtel-St-Denis Tél : + 41 21 948 81 70, e-mail : info@cosseco.ch Courbes de puissance chauffage SW-13 1=Flow temperature 35 Full load 2=Flow temperature 45 Full load 3=Flow temperature 55 Full load Heating performance curve Heating Performance Conditions Curve
- 54. Données techniques Solarline SW-10 SW-13 SW-15 SW-20 COSSECO SA, Route de Pra de Plan 5 1618 Châtel-St-Denis Tél : + 41 21 948 81 70, e-mail : info@cosseco.ch Courbes de puissance chauffage SW-15 1=Flow temperature 35 Full load 2=Flow temperature 45 Full load 3=Flow temperature 55 Full load Heating performance curve Heating Performance Conditions Curve
- 55. Données techniques Solarline SW-10 SW-13 SW-15 SW-20 COSSECO SA, Route de Pra de Plan 5 1618 Châtel-St-Denis Tél : + 41 21 948 81 70, e-mail : info@cosseco.ch Courbes de puissance chauffage SW-20 1=Flow temperature 35 Full load 2=Flow temperature 45 Full load 3=Flow temperature 55 Full load Heating performance curve Heating Performance Conditions Curve
- 56. Données techniques Solarline SW-10 SW-13 SW-15 SW-20 COSSECO SA, Route de Pra de Plan 5 1618 Châtel-St-Denis Tél : + 41 21 948 81 70, e-mail : info@cosseco.ch Chute de pression SW-10 ! SW-13 ! SW-15 ! SW-20
- 57. Données techniques Solarline SW 26 et 30 COSSECO SA, Route de Pra de Plan 5 1618 Châtel-St-Denis Tél : + 41 21 948 81 70, e-mail : info@cosseco.ch Solarline SW 26 et 30 Dimensions et technologie Dimension Unit:mm GHP30 GHP30BGHP26 GHP26B Main parts Item GHP26B GHP30B Compressor Hitachi Hitachi Plate heat exchanger Swep Swep Expansion valve Emerson Emerson Controller Siemens Siemens Electric parts Schneider Schneider Dry filter Emerson Emerson outdoor outlet outdoor inlet indoor outlet indoor inlet Sensor outlet power cable outlet 650 30 450 543 920 800 600 743 125110 110330 115 600 800
- 58. Données techniques Solarline SW 26 et 30 COSSECO SA, Route de Pra de Plan 5 1618 Châtel-St-Denis Tél : + 41 21 948 81 70, e-mail : info@cosseco.ch Performances et caractéristiques! Modèle Type SW-26 SW-30 Caractéristiques Dimensions HxWxD Poids kg 195 200 Refrigerant Type Masse de remplissage kg 3.6 4 Presison de fonctionnement Mpa 4.2 4.2 Taille de connecteur hydraulique - chaud Pouces G1 1/2” G1 1/2” Taille de connecteur hydraulique - froid Pouces G1 1/2” G1 1/2” Evaporateur Type Condenseur Type Compresseur Type Performances Puissance thermique - chaud à B0/W35 kW 26.0 31.0 Consommation électrique (chauffage) kW 5.8 7.0 COP 4.48 4.43 Débit - circuit chaud m3/h 4.47 5.33 Débit - circuit froid m3/h 5.79 6.88 Puissance thermique - chaud à W10/W35 kW 32.6 39.0 Consommation électrique (chauffage) kW 5.92 7.14 COP 5.51 5.46 Débit - circuit chaud m3/h 5.61 6.71 Débit - circuit froid m3/h 7.65 9.13 Puissance thermique - froid à W35/W7 kW 27.80 32.60 Consommation électrique (refroidissement) kW 5.70 6.80 COP 4.88 4.79 Débit - circuit intérieur m3/h 4.78 5.61 Débit - circuit extérieur m3/h 5.76 6.78 Puissance Type Niveau de puissance sonore dB(A) 49 49 R410A Echangeur à plaque brazée Echangeur à plaque brazée 2 * Scroll Hitachi Truphasé - compresseur Hitachi 960 x 600 x 800
- 59. Données techniques Solarline SW 26 et 30 COSSECO SA, Route de Pra de Plan 5 1618 Châtel-St-Denis Tél : + 41 21 948 81 70, e-mail : info@cosseco.ch Courbe de puissance chaud SW-26 Heating Performance Conditions Curve 1=Flow temperature 35 Full load 2=Flow temperature 45 Full load 3=Flow temperature 55 Full load Heating performance curve
- 60. Données techniques Solarline SW 26 et 30 COSSECO SA, Route de Pra de Plan 5 1618 Châtel-St-Denis Tél : + 41 21 948 81 70, e-mail : info@cosseco.ch Courbe de puissance chaud SW-30 Heating Performance Conditions Curve 1=Flow temperature 35 Full load 2=Flow temperature 45 Full load 3=Flow temperature 55 Full load Heating performance curve
- 61. Données techniques Solarline SW 26 et 30 COSSECO SA, Route de Pra de Plan 5 1618 Châtel-St-Denis Tél : + 41 21 948 81 70, e-mail : info@cosseco.ch Chute de pression
- 62. COSSECO SA, Route de Pra de Plan 5 1618 Châtel-St-Denis Tél : + 41 21 948 81 70, e-mail : info@cosseco.ch L’efficacité Energétique maîtrisée Solarline: solution solaire hybride de chauffage, ECS et climatisation 4. Ballons de stockage et ECS
- 63. 4 REGULUS - R2BC storage water heaters - www.regulus.eu 3 - Technical Data and Dimensions of R2BC Models Tank code ................................................................................ a Tank total volume .................................................................... b Volume of the upper heating coil ............................................ c Volume of the lower heating coil ............................................. d Surface of the upper heating coil ............................................ e Surface of the lower heating coil ............................................. f Empty weight (transport) ......................................................... g Max. working temperature - tank ............................................ 95 °C Max. working temperature - heating coils .............................. 110 °C Max. working pressure - tank ................................................. 10 bar Max. working pressure - heating coils ................................... 10 bar DHW heating t =35 °C (80/60 - 10/45) - upper coil ............. h DHW heating t =35 °C (80/60 - 10/45) - lower coil .............. i Values in brackets are valid for tanks R2BC200 - R2BC400 Model R2BC 200 R2BC 300 R2BC 400 R2BC 500 R2BC 750 R2BC 1000 R2BC 1500 R2BC 2000 R2BC 3000 Tank code a 6481 6482 6483 6484 6485 5758 8478 8479 8474 Tank volume [l] b 200 300 400 500 750 1000 1500 2000 3000 Volume of the upper heating coil [l] c 4.9 5.6 5.6 5.6 13.4 14 14 17 22.5 Volume of the lower heating coil [l] d 4.9 9.5 11 11 13.4 14 26.5 28.5 31.5 Surface of the upper heating coil [m2 ] e 0.8 0.9 0.9 0.9 2.4 2.5 2.5 3 3.8 Surface of the lower heating coil [m2 ] f 0.8 1.5 1.9 1.9 2.4 2.5 4.2 4.5 5.2 Empty weight [kg] g 96 124 150 168 270 285 302 379 466 DHW heating t=35 °C (80/60 - 10/45) - upper coil [l/h] ([kW]) h 680 (27.7) 760 (31.1) 760 (31.1) 760 (31.1) 2000 (81.3) 2090 (84.7) 2090 (84.7) 2510 (101.6) 3110 (126.0) DHW heating t=35 °C (80/60 - 10/45) - lower coil [l/h] ([kW]) i 680 (27.7) 1280 (51.9) 1620 (65.8) 1620 (65.8) 2000 (81.3) 2090 (84.7) 3360 (136.2) 3600 (145.9) 4160 (168.6) Dimensions [mm] A 1265 1710 1690 1780 1870 2120 2285 2550 2980 B 929 1384 1411 1480 1460 1680 1825 2090 2430 C 629 914 891 949 890 890 1255 1310 1400 D 258 257 268 335 400 400 520 550 640 E 67 67 79 175 220 220 315 340 430 F 264 264 286 305 385 385 470 460 550 G 474 657 660 685 685 685 945 985 1075 H 579 849 846 865 835 835 1180 1160 1300 I 679 979 1011 985 990 990 1330 1450 1790 J 914 1214 1245 1285 1340 1340 1600 1825 2205 K 884 1141 1163 1235 1235 1235 1460 1650 2040 L 994 1294 1361 1335 1440 1440 1735 2000 2340 M 1164 1608 1581 1595 1590 1840 1935 2210 2550 ø N 610 610 710 760 950 950 1200 1300 1400 ø O 500 500 600 650 790 790 1000 1100 1200 A B C D E F H I J K L M G 6/4“ G 5/4 (G 1) G 1/2“ G 1/2“ ø114 ø O 1 2 3 12 11 G 1/2“ G G 1 (G 3/4) 4 5 6 7 8 9 10 30° Insulation ø N G 5/4“ G 5/4“ G 5/4“ G 5/4“ G 5/4 (G 1) G 5/4“ ø168 „S“ „S“
- 64. 4 3 - Technical Data and Dimensions Type - model PS200 N PS300 N PS500 N PS650 N PS800 N PS900 N PS1000 N PS1500 N PS2000 N PS3000 N PS4000 N PS5000 N Tank code a 10050 10053 10054 12311 10056 13474 10058 10060 10138 10139 10140 10141 Insulation code b 10107 10108 10120 12319 10123 13475 10125 10146 10147 10148 10149 10150 Fluid volume in tank [l] c 181 280 474 656 780 840 914 1505 2005 3022 3992 4999 Empty weight [kg] d 41 51 71 84 98 103 108 174 207 293 407 469 Tipping height [mm] e - - 1920 1970 1870 2020 2110 1940 2020 2160 2490 2970 Dimensions [mm] A 1326 1380 1890 1930 1820 1975 2070 1860 1930 2040 2335 2855 B 1068 1095 1590 1610 1430 1645 1680 1450 1485 1540 1835 2335 C 768 770 1130 1150 1050 1185 1220 1070 1105 1160 1375 1705 D 468 495 660 680 670 715 750 690 725 780 905 1075 E 388 415 535 555 580 590 625 600 635 690 780 925 F 308 335 425 425 425 390 500 425 425 520 600 670 G 168 195 200 220 290 255 290 310 345 400 445 445 ø H 650 750 800 900 1000 990 1000 1300 1450 1700 1800 1800 ø I 450 550 600 700 800 790 800 1100 1250 1500 1600 1600 ø J 340 450 500 600 700 700 700 1000 1100 1300 1500 1500 K 168 195 200 220 290 255 290 310 345 400 445 445 L 308 335 410 430 490 465 500 510 545 600 655 775 M 818 845 1245 1265 1130 1300 1335 1150 1185 1240 1490 1855 N 868 895 1360 1380 1210 1415 1450 1230 1265 1320 1605 2005 O 968 995 1460 1480 1310 1515 1550 1330 1365 1420 1705 2105 P 1068 1095 1590 1610 1430 1645 1680 1450 1485 1540 1835 2335 Tank code: .......................................................... a Insulation code: .................................................. b Total fluid volume in tank: ................................... c Max. working pressure in tank: ........................... 4 bar Max. working temperature in tank: ..................... 95 °C Empty weight: ..................................................... d Tipping height without insulation: ........................ e A B C D E F G øH øI øJ K L M N O P 1 2 3 4 5 6 7 8 9 10 11 12 13 14
- 65. COSSECO SA, Route de Pra de Plan 5 1618 Châtel-St-Denis Tél : + 41 21 948 81 70, e-mail : info@cosseco.ch L’efficacité Energétique maîtrisée Solarline: solution solaire hybride de chauffage, ECS et climatisation 5. Panneaux Photovoltaïques Tritec
- 66. Hareon Solar HR-Mono – Modules with monocrystalline cells Hareon Solar Hareon Solar Technology Co., Ltd. was founded in 2004 and, today, it is one of the largest silicon-wafer pro- ducers in China. With its completion of the first module production lines, Hareon Solar has at its disposal, since 2008, a fully-integrated production of PV components from ingots to modules. Reliable modules With an outstanding module and cell efficiency, the modules of the HR-Mono series achieve very high effi- ciencies. Even with a reduced incidence of light, the modules realize a good performance yield thanks to their excellent low-light behaviour. Before and after lamination, every module is subjected to an electro- luminescence test. TRITEC quality controls n Regular quality controls in cooperation with the Fraunhofer Institute in Freiburg n External quality controls of production on location on behalf of TRITEC n Mechanical TÜV load test with the TRITEC mounting system TRI‑STAND Certificates and warranties n IEC 61215, IEC 61730, IEC 62716, IEC 61701, CE, UL Listed, CEC, VDE, RoHS, TÜV, PV CYCLE n Performance warranty: 12 years on 90 % and 25 years on 80 % of the nominal power n 10-year product warranty n European warranty processing The solar modules manufactured by Hareon Solar have been tested and certified by all recognised test institutes world- wide. The Ningbo plugs allow easy wiring of the modules, while the specifically developed module frames withstand loads of up to 5400 N/m². ................................................................................................................................................................... Framed Modules SOLAR MODULES ...................................................................................................................................................................
- 67. Art. No. 0101356 0101354 0101355 0101437 Model Hareon HR-195W Mono Hareon HR-200W Mono Hareon HR-205W Mono Hareon HR-250W-18/Cbb Mono Nominal power 195 W +5 W, -0 W 200 W +5 W, -0 W 205 W +5 W, -0 W 250 W +5 W, -0 W Max. system voltage 1000 V 1000 V 1000 V 1000 V Operating voltage 36.94 V 37.39 V 37.83 V 30.59 V Operating current 5.28 A 5.35 A 5.42 A 8.17 A Open circuit voltage 45.28 V 45.50 V 45.68 V 37.59 V Short circuit current 5.58 A 5.79 A 5.90 A 8.79 A Temp. coefficient open circuit voltage -0.31 %/K -0.31 %/K -0.31 %/K -0.31 %/K Temp. coefficient short circuit current 0.047 %/K 0.047 %/K 0.047 %/K 0.047 %/K Temp. coefficient nominal power -0.41 %/K -0.41 %/K -0.41 %/K -0.41 %/K Reverse current load 15 A 15 A 15 A 15 A Max. string protection 15 A 15 A 15 A 15 A Number of bypass diodes 3 pc. 3 pc. 3 pc. 3 pc. Cells per module 72 pc. 72 pc. 72 pc. 60 pc. Cell dimensions (L / W) 125 mm / 125 mm 125 mm / 125 mm 125 mm / 125 mm 156 mm / 156 mm Cell connection 2 bus bar 2 bus bar 2 bus bar 3 bus bar Cell technology Monocrystalline silicon Monocrystalline silicon Monocrystalline silicon Monocrystalline silicon Connection Ningbo, cable 900 mm each (+ / ‑) Ningbo, cable 900 mm each (+ / ‑) Ningbo, cable 900 mm each (+ / ‑) Ningbo, cable 1000 mm each (+ / ‑) Mounting frame Anodized aluminium Anodized aluminium Anodized aluminium Black anodized aluminium Back sheet White White White Black Dimensions (L / W / H) 1580 mm / 808 mm / 45 mm 1580 mm / 808 mm / 45 mm 1580 mm / 808 mm / 40 mm 1636 mm / 992 mm / 45 mm Weight 16.0 kg 16.0 kg 15.8 kg 19.5 kg Number per container 616 pc. 616 pc. 700 pc. 616 pc. Max. load 5400 N/m² 5400 N/m² 5400 N/m² 5400 N/m² Performance warranty * 12 / 25 years 12 / 25 years 12 / 25 years 12 / 25 years Product warranty 10 years 10 years 10 years 10 years Norms IEC 61215, IEC 61730, CE, UL Listed, CEC, RoHS, ISO 9001, ISO 14001, TÜVdotCOM-ID: 0000026038, MCS, PV CYCLE IEC 61215, IEC 61730, CE, UL Listed, CEC, RoHS, ISO 9001, ISO 14001, TÜVdotCOM-ID: 0000026038, MCS, PV CYCLE IEC 61215, IEC 61730, CE, UL Listed, CEC, RoHS, ISO 9001, ISO 14001, TÜVdotCOM-ID: 0000026038, MCS, PV CYCLE IEC 61215, IEC 61730, CE, UL Listed, CEC, RoHS, ISO 9001, ISO 14001, TÜVdotCOM-ID: 0000026038, MCS, PV CYCLE * - Manufacturer's performance warranty: 12 years on 90 % / 25 years on 80 % of the minimal nominal power under standard testing conditions (STC) The electrical specifications are under standard test conditions (STC) of irradiance of 1000 W/m², spectrum of 1.5 air mass and cell temperature of 25°C. ................................................................................................................................................................... SOLAR MODULES Framed Modules ................................................................................................................................................................... TRITEC Group www.tritec-energy.com | © 20130529-1 | The content of this datasheet is subject to change without prior notice
- 68. COSSECO SA, Route de Pra de Plan 5 1618 Châtel-St-Denis Tél : + 41 21 948 81 70, e-mail : info@cosseco.ch L’efficacité Energétique maîtrisée Solarline: solution solaire hybride de chauffage, ECS et climatisation 6. Panneaux Photovoltaïques Meyer Burger (Suisse)
- 75. COSSECO SA, Route de Pra de Plan 5 1618 Châtel-St-Denis Tél : + 41 21 948 81 70, e-mail : info@cosseco.ch L’efficacité Energétique maîtrisée Solarline: solution solaire hybride de chauffage, ECS et climatisation 7. Offres types
- 76. GAMME DE PRIX SOLARLINE AÉROTHERMIQUE Le kit Solarline comprend les éléments mentionnés ci-dessous : Le tableau ci-dessous résume les prix au kW ainsi que les prix liés aux différentes puissances Puissance thermique Prix matériel Prix matériel + Pose Prix (CHF/W thermique) 10 CHF 22'671.50 CHF 45'117.00 CHF 2.27 13 CHF 26'172.50 CHF 47'899.00 CHF 2.01 15 CHF 29'166.67 CHF 48'764.00 CHF 1.94 20 CHF 30'198.00 CHF 51'781.60 CHF 1.51 30 CHF 38'615.33 CHF 58'000.00 CHF 1.29 32 CHF 59'840.00 CHF 80'000.00 CHF 1.87 64 CHF 80'000.00 CHF 100'000.00 CHF 1.25 24.04.2014 • PAC aérothermique • Pompe de circulation • Vanne mélangeuse motorisée de zone • Vanne 3 voies motorisée pour l’ECS • Ballon d’ECS • Ballon de stockage • Vase d’expansion • Sondes de températures de ballon • Sonde de température intérieure • Panneaux photovoltaîques avec système de pose • Coffret électronique Solarline avec écran de mesure et réglage • Câbles pour les panneaux photovoltaîques • Mise en service • Livraison sur place Prix HT 0 20'000 40'000 60'000 80'000 100'000 120'000 SA-10 SA-13 SA-15 SA-20 ou 2*SA-10 2*SA-15 SA-32 SA-64 Titredel'axe Prix Aérothérmique Sans installation Avec Installation COSSECO SA, Route de Pra de Plan 5 1618 Châtel-St-Denis Tél : + 41 21 948 81 70, e-mail : info@cosseco.ch
- 77. GAMME DE PRIX SOLARLINE GÉOTHERMIQUE Le kit Solarline comprend les éléments mentionnés ci-dessous : Le tableau ci-dessous résume les prix au kW ainsi que les prix liés aux différentes puissances Puissance thermique Prix matériel Prix matériel + Pose Prix (CHF/W thermique) 10 CHF 24'421.67 CHF 43'662.50 CHF 2.44 13 CHF 26'177.00 CHF 46'000.00 CHF 2.01 15 CHF 30'280.00 CHF 51'000.00 CHF 2.02 20 CHF 40'650.00 CHF 61'000.00 CHF 2.03 26 CHF 50'000.00 CHF 70'000.00 CHF 1.92 30 CHF 61'756.00 CHF 82'000.00 CHF 2.06 60 CHF 80'000.00 CHF 101'000.00 CHF 1.33 Prix HT • PAC géothermique • Pompe de circulation • Vanne mélangeuse motorisée de zone • Vanne 3 voies motorisée pour l’ECS • Ballon d’ECS • Ballon de stockage • Vase d’expansion • Sondes de températures de ballon • Sonde de température intérieure • Panneaux photovoltaîques avec système de pose • Coffret électronique Solarline avec écran de mesure et réglage • Câbles pour les panneaux photovoltaîques • Mise en service • Livraison sur place 0 20'000 40'000 60'000 80'000 100'000 120'000 SW-10 SW-13 SW-15 SW-20 SW-26 SW-30 SW-60 Titredel'axe Prix Géothermique Sans installation Avec Installation COSSECO SA, Route de Pra de Plan 5 1618 Châtel-St-Denis Tél : + 41 21 948 81 70, e-mail : info@cosseco.ch
- 78. COSSECO SA, Route de Pra de Plan 5 1618 Châtel-St-Denis Tél : + 41 21 948 81 70, e-mail : info@cosseco.ch L’efficacité Energétique maîtrisée Solarline: solution solaire hybride de chauffage, ECS et climatisation 8. Références de clients
- 80. COSSECO SA, Route de Pra de Plan 5 1618 Châtel-St-Denis Tél : + 41 21 948 81 70, e-mail : info@cosseco.ch L’efficacité Energétique maîtrisée Solarline: solution solaire hybride de chauffage, ECS et climatisation 9. Articles de presse
- 81. ARTICLE – BATIMAG (avril 2011)
- 82. ARTICLE - EFFICIENCE 21 (Automne 2012)
- 83. ARTICLE – FRIBOURG NETWORK (2014)
- 84. Energy and Buildings 66 (2013) 77–87 Contents lists available at ScienceDirect Energy and Buildings journal homepage: www.elsevier.com/locate/enbuild Economic and energy analysis of three solar assisted heat pump systems in near zero energy buildings Richard Thygesen∗ , Björn Karlsson Mälardalen University, School of Business, Society and Engineering, Box 883, 721 23 Västerås, Sweden a r t i c l e i n f o Article history: Received 16 May 2013 Accepted 11 July 2013 Keywords: Solar collector Photovoltaics Ground source heat pump Near zero energy building Energy system simulation a b s t r a c t The European Union’s directive of the energy performance of buildings makes energy systems with local energy generation interesting. To support local energy generation the government has appointed a commission to investigate the possibility to implement net metering for grid connected PV-systems. In this paper three different systems are simulated and analyzed with regards to economics and energy: a PV-system and a heat pump (alternative 1), a heat pump and a solar thermal system (alternative 2) and a heat pump, a PV-system and a solar thermal system (alternative 3). System alternative 1 is profitable with daily net metering and monthly net metering and unprofitable with instantaneous net metering. The solar electrical fraction of the system is 21.5%, 43.5% and 50%, respectively. System alternative 2 is unprofitable and has a solar electricity fraction of 5.7%. System alternative 3 is unprofitable and has a solar electricity fraction of just below 50. The conclusion is that a PV system in combination with a heat pump is a superior alternative to a solar thermal system in combination with a heat pump. © 2013 Elsevier B.V. All rights reserved. 1. Introduction In the Europe union (EU-27) the household sector accounts for almost 27% of the total European final energy consumption [1]. This is an important reason for the European commission to adopt the directive on the energy performance of buildings [2] as one of several measures to reach its 20–20–20 goal. The European Union’s directive on the energy performance of buildings will lead to more local energy generation in the future and more energy efficient buildings. Solar energy is regarded as one of the most promising ways for local energy generation. Partly because of this the Swedish government has appointed a commis- sion which will produce proposals on how to facilitate the use of net metering for locally produced electricity in buildings. In Sweden today one common way of reducing the amount of purchased energy in new buildings is to install a ground source heat pump in combination with a well-insulated building envelope and mechanical ventilation with heat recovery. In Sweden approx- imately 340,000 ground source heat pumps has been installed the last decade according to the Swedish Heat Pump Association [3]. ∗ Corresponding author. Tel.: +46 21 103182; fax: +46 21 101480. E-mail address: richard.thygesen@mdh.se (R. Thygesen). Because of this it will be more common with energy systems that combine solar energy with ground source heat pumps and heat recovery ventilation. Earlier studies with solar assisted heat pumps have mainly focused on complex systems with PV/T hybrids or solar thermal collectors acting as the source for the heat pump evaporator [4–6]. Other studies have focused on standard heat pumps and solar ther- mal systems [7]. In this paper three less complex solar assisted heat pump sys- tems will be simulated in the program Trnsys [8] and analyzed with regards to economics and energy consumption. The different sys- tems are PV-system, solar thermal system and a combination of a PV-system and a solar thermal collector system. The aim of the work presented in this article is to find the sys- tem which is most cost effective and has the highest solar energy fraction. 2. Methodology The energy simulations are performed in the transient simula- tion program Trnsys. The simulation interval is set to 3 min and two years, 17,520 h, are simulated. The Trnsys models are built up with so called decks in Simulation studio which is the graphical user interface of Trnsys. Each Trnsys model consists of identical decks with exception of the different solar energy systems analyzed. A short description 0378-7788/$ – see front matter © 2013 Elsevier B.V. All rights reserved. http://dx.doi.org/10.1016/j.enbuild.2013.07.042
- 85. 78 R. Thygesen, B. Karlsson / Energy and Buildings 66 (2013) 77–87 Table 1 Main Trnsys type in the simulation deck. Trnsys type Description Comment Type 56 Multi zone building Type 927 Ground source heat pump Based on external data file for Premiumline EQ C6 Type 534 Heat storage tank Heat pump internal tank Type 557a Borehole Type 194 PV-module 5 parameter model Type 539 Flat plate solar collector Type 760 Air–air heat recovery of the most important types used in this work is summarized in Table 1. All results from the energy simulations are exported and further processed and used in the economic calculations. The analysis is based on the annuity method because of its ability to compare systems with different economic lifespans. The revenues from the different system alternatives are con- verted to net present values by multiplying the revenues with the discount factor (DF) defined by: DF = 1 (1 + i) t (1) The accumulated net present value (NPV) revenues are then con- verted to an annuity defined by: (NPV − Ci) × i × (1 + i) z (1 + i) z − 1 (2) where i is the interest rate, t is the economical lifespan and Ci is the investment cost. In the economic calculations the investment cost only includes the solar energy systems and not the ventilation heat recovery and ground source heat pump systems. A sensitivity analysis is done in order to evaluate the impact of different electricity price changes on systems profitability. 3. The simulated building and technical installations 3.1. The building The simulated building consists of one zone and one story with a living space of 138 m2 which is maintained at 21 ◦C. The building has floor heating embedded in the building foundation which con- sists of a concrete slab on grade with a total insulation thickness of 300 mm. In the building walls the insulation is 350 mm thick and the roof has an insulation thickness of 370 mm. The U-values of the different building elements can be seen in Table 2. Four inhabitants, two children and two adults, live in the build- ing. The energy system of the building consists of three main parts: household electricity, the production of domestic hot water and space heating and heat recovery ventilation. The part of the three systems investigated that are identical to each other will be Table 2 U-values for the different building components used in the simulation. Building component U-value (W/(m2 , K)) Ceiling 0.106 Outer walls 0.102 Ground floor 0.103 Windows 0.81 described in this section. Another important factor is how differ- ent measuring schemes influence the size and the economics of the PV-system. The different schemes will be explained in detail in Section 4. The total energy demand for the building with household electricity included is 19,880 kWh/year. The same building with a ventilation heat recovery unit installed has a demand of 16,920 kWh/year purchased energy and with ventilation heat recovery and ground source heat pump the purchased energy demand is 10,157 kWh/year. In Fig. 1 the energy demands per month is shown and in Table 5 the building total energy demand for the different combinations of technical installations are sum- marized. 3.2. Heat pump The heat pump used in the simulations is based on a commer- cial available model made in Sweden by Bosch Termotechnik AB. The model used is an IVT Premiumline EQ C6 which has a heating capacity of 5.8 kW. It has a 225 L internal double jacketed storage tank with an inner domestic hot water tank of 185 L. The domestic hot water production is prioritized which means that no heat is supplied to the building when the temperature in the tank is below 47 ◦C which is the set point temperature minus a 3 ◦C hysteresis. The temperature probe which is measuring the domes- tic hot water is located approximately 20 mm from the bottom of the tank and on the outside of the tank. A zone valve switches the heated media to either the outer compartment of the domestic hot water tank or to the floor heating system. Once every week the domestic hot water temperature is raised to 65 ◦C to avoid growth of the Legionella bacteria. This is partly done with the heat pumps internal electric heater. The heat pump heater is limited to 3 kW which is one-third of the heater potential and will only be active when the domestic hot water is raised to 65 ◦C. The domestic hot water consumption in the building is 66 L per day and person and the annual energy amount needed for produc- tion of domestic hot water is 4675 kWh. The tapping cycle is based on EN 16147:2011 [9] tapping cycle M which is a cycle with 23 draw offs a day. Previous studies have shown that the number of tapings and the time of occur- rence are of importance for the storages performance as shown by Fiala [10]. An evaluation of different tapping cycles will be done in the future to improve the domestic hot water part of the model. The required temperature lift of the main water varies with the season, in summer the minimum lift is 42 ◦C and in winter the maximum lift needed is 49 ◦C. The variations can be seen in Fig. 2. The heat pump is connected to a 150 m deep borehole on the heat pump cold side and to the building floor heating system on the hot side. It is dimensioned for monovalent operation which means that it is able to cover 100% of the building heat load. The borehole is dimensioned so the exiting fluid temperature never is below 0 ◦C. The heating is regulated by a linear temperature curve based on the heating system forward flow temperature and outdoor tem- perature. Maximum forward flow temperature to the floor heating system is 33.5 ◦C. The temperature differences are within the manufacturers rec- ommended 2–5 ◦C for the cold side fluid and 7–10 ◦C for the hot side fluid. Two circulation pumps are integrated in the heat pump. On the hot side the circulation pump is frequency controlled and the speed is regulated to keep the temperature difference over the heating
- 86. R. Thygesen, B. Karlsson / Energy and Buildings 66 (2013) 77–87 79 Fig. 1. Total building energy demands without technical installations, with ventilation heat recovery and with ventilation heat recovery in combination with a ground source heat pump. system at a constant 7 ◦C. On the cold side the circulation pump is set to a fixed speed. The reason for having a frequency controlled pump on the hot side is because it is in constant operation during the heating sea- son. The circulation pump on the cold side is only active when the compressor is active. When the ambient temperature rises above 12 ◦C the heat pump is switched to summer mode and the circulation pump is only in operation when domestic hot water is produced. This means that no heating is provided to the building until the ambient temperature is below 12 ◦C. 3.3. Heat recovery ventilation The system contains two fans, with an installed power of 170 W each, and a rotating heat exchanger with an efficiency of 80%. No electrical anti freezing system is installed in the ventilation system. The supply air is maintained at 17 ◦C when possible. The ventilation flow rate is set to 0.35 l/s, m2 living area which is the minimum requirements according to the Swedish building regulations [11]. During summer no heat exchange will occur even though the ambient temperature drops below 17 ◦C. Fig. 2. Annual variations of the required temperature lift of the main water to achieve a domestic hot water temperature of 55 ◦ C.
- 87. 80 R. Thygesen, B. Karlsson / Energy and Buildings 66 (2013) 77–87 Table 3 Data for from CNBM Solar’s polycrystalline 230 W module at standard test conditions. Maximum power per module 230 W Tilt angle of modules 70◦ Open circuit voltage 36.9 V Voltage at maximum power point 30.2 V Short-circuit current 8.31 A Current at maximum power point 7.62 A Table 4 Data taken from Solar Keymark certificate for the aquasol flat plare collector. Collector efficiency related to aperture area 0.78 a1 3.14 W/(m2 , K) a2 0.019 W/(m2 , K2 ) Effective thermal capacity 7470 kJ/(m2 , K) Table 5 Building total energy demand with different combinations of technical installations. Building Total building energy demand incl. household electricity (kWh) Without any technical installations 19,880 With heat recovery ventilation 16,920 With heat recovery ventilation and ground source heat pump 10,157 3.4. PV-system The system is based on 21 pieces 230 W polycrystalline modules manufactured by CNBM solar and has an installed peak power of 5190 kW. The modules are tilted 70◦ from the ground and are facing south. No objects that can shade the modules are present around the building. The system is grid connected via an inverter to one of the build- ings incoming electrical phases. No battery storage is used. Table 3 summarizes the most important data of the PV-system. 3.5. Solar thermal system The solar thermal system is based on two flat plate solar collec- tors manufactured by the Swedish company Aquasol. The aperture area is 2.1 m2 per flat plate collector. The total area of the solar thermal system is dimensioned for a storage volume of 225 L. The system is connected to the tank via a coiled tube heat exchanger placed in the bottom of the tank. It is regulated so that the circulation pump starts when the tem- perature difference between the water in the solar collector and in the bottom of the tank is 3 ◦C and it stops when the difference is 1 ◦C. If the temperature in the tank reaches 95 ◦C the circulation pump stops. In Table 4 the most important data taken from the Solar Keymark certificate are summarized. 3.6. Household electricity The annual electricity consumption is based on measured val- ues taken from a one family building with four inhabitants where two are adults and two are children. The annual consumption is 5155 kWh with a small monthly variation [12], see Fig. 3. 4. Metering schemes The consumer price of electricity consists of the cost for energy, energy tax, sales tax and grid cost. The energy cost is around 40% of the total cost. When the PV-system delivers less energy than the total load it will lower the need for purchased electricity. This means that all these four components are saved. When the PV sys- tem delivers more energy than is used in the building the surplus is exported to the grid. The price of exported electricity is determined by market price for electric energy. This means that it is much more favorable to save energy than to export energy. However, if a kWh is defined as saved or exported depends on the metering scheme. Three different schemes will be investigated in this article: instantaneous metering, daily net metering and monthly net metering. The length of the net metering period affects the amount of PV-electricity regards as saved or exported. The saved electric- ity fraction is increasing with the length of the metering period, so a larger PV-system can be installed without the need to export and sell electricity to the grid. Technically daily and monthly net metering means that the grid is used as storage. With instantaneous metering the generated PV electricity has to be used at once in the building. If the PV electricity generation is greater than the building electricity demand the surplus will be exported to the electricity grid and sold. Daily net metering is a more attractive option for the building owner where the generated PV electricity for a whole day is settled against the building electricity demand for the same day, i.e. the consumer only pays for the net. With this scheme the PV-system surplus is exported to the electricity grid but not sold. The surplus accumulated at daytime is settled against the electricity demand later the same day when no or little PV electricity is generated. If the PV-electricity generation is larger than the building electricity demand over the whole day, i.e. there is a positive daily net, the net surplus is sold to an electricity company. The same principle as for daily net metering also applies for monthly net metering but the PV electricity generation and the electricity demand are settled monthly. Fig. 4 shows the saved electricity in the building energy system with heat pump and heat recovery according to Fig. 1 in relations to installed PV-system size and different metering schemes. As can be seen in Fig. 4 the slope of the curve for saved electricity in the building with instantaneous net metering is starting to decline at 400 W and this is because a larger PV-system gives a surplus that have to be exported to the grid. For daily and monthly net metering a larger peak power can be installed before a surplus is exported to the grid and this also gives a larger fraction of saved electricity in the building. The performance of an energy system for a single family build- ing consisting of a heat pump supported by PV-modules and solar collectors are analyzed for the different metering periods. 5. Differences between solar thermal systems and PV-systems in combination with ground source heat pumps A PV-system in combination with a heat pump has a better match between heat demand and output from the PV-system than a solar thermal system. The heat pump has a higher monthly coef- ficient of performance during the winter months because the heat supplied to the building floor heating system has a lower tem- perature and is a larger portion of the total heat supplied to the building than in summer. The heat supplied in summer is almost only for domestic hot water production. Fig. 5 shows the monthly coefficient of performance. This means that the PV-electricity supplied to the heat pump during winter is utilized more efficiently than during summer, i.e.
- 88. R. Thygesen, B. Karlsson / Energy and Buildings 66 (2013) 77–87 81 Fig. 3. Monthly variation of the household electricity consumption. the same amount of electricity to the heat pump gives a larger heat output in winter than in summer, see Fig. 6. Another advantage for the PV-module is that it is not negatively affected by low ambient temperatures and has the same efficiency independent of the radiation intensity. A flat plate solar collector output depends on the absorbed radiation to be larger than the col- lector heat losses. The radiation level where the collector heat losses are equal to the absorbed radiation is called the critical radiation level as shown in [13]. 6. Energy analysis of solar assisted heat pump systems The three systems will be described in detail in this section. All general parts of the building energy system in Section 3 are identical for all three systems. The main parts of the different systems can be seen in Fig. 7. 6.1. Alternative 1: ground source heat pump system in combination with 5.19 kWp PV-system Three different metering schemes will be investigated in this alternative: instantaneous metering, daily net metering and monthly net metering. The PV-system is dimensioned so that surplus of PV-electricity is avoided. Fig. 8 demonstrates how this principle is used for design- ing the system with monthly net metering. The chosen PV-power to 5.19 kWp will give balance between load and production during June. During all other months electric energy has to be supplied. Fig. 4. Saved electricity in the building energy system in relation to installed PV peak power with different periods for net metering. The PV-modules are tilted 70◦ .
- 89. 82 R. Thygesen, B. Karlsson / Energy and Buildings 66 (2013) 77–87 Fig. 5. Ground source heat pump monthly coefficient of performance. Monthly net metering is expected to be introduced in Sweden during 2013. Therefore this alternative is used as the reference in the overall analysis. It will generate and save 5093 kWh of electric- ity per year without overproduction which means that the building energy demand is reduced to 5064 kWh or 36.7 kWh/year and m2. The solar electricity fraction in this alternative is 50%. 6.1.1. Alternative 1: GSHP in combination with 5.19 kWp PV-system with instantaneous metering In this metering alternative it is possible to use 2182 kWh of PV generated electricity in the building and 2908 kWh is exported and sold to an electricity company. When the PV generation used in the building is deducted the building electricity demand is reduced to 7975 or 58 kWh/year and m2 living area. Fig. 9 shows the monthly building electricity with and without the PV generation deducted. The fraction of solar electricity in the building energy system is 21.5%. 6.1.2. Alternative 1: GSHP in combination with 5.19 kWp PV-system with daily net metering In this metering alternative it is possible to use 4418 kWh in the building and 672 kWh is exported and sold to an electricity company. When the PV generation, possible to use in the building to limit the electricity demand, is deducted the building electricity demand is reduced to 5739 or 41.6 kWh/year and m2 living area. Fig. 9 shows the monthly building electricity with and without the PV generation deducted. Fig. 6. Monthly output of a 1 m2 PV-module in combination with a heat pump and a 1 m2 flat plate solar collector.
- 90. R. Thygesen, B. Karlsson / Energy and Buildings 66 (2013) 77–87 83 Fig. 7. Main components in alternative 1 with ground source heat pump and PV-system, alternative 2 with ground source heat pump and solar thermal system and alternative 3 which is a combination of alternatives 1 and 2. Fig. 8. The building energy demand and PV-generation with monthly net metering and 5.19 kWp PV-system and the PV-modules in 70◦ tilt.
- 91. 84 R. Thygesen, B. Karlsson / Energy and Buildings 66 (2013) 77–87 Fig. 9. Total building electricity demand with and without PV-system with instantaneous metering, daily net metering and monthly net metering. The fraction of solar electricity in the building energy system is 43.5%. 6.1.3. Alternative 1: GSHP in combination with 5.19 kWp PV-system with monthly net metering In this alternative all of the 5093 kWh PV generated electric- ity is used to limit the building electricity demand. When the PV generated electricity is deducted the building electricity demand is reduced to 5064 or 36.7 kWh/year and m2 living area. Fig. 9 shows the monthly building electricity with and without the PV generation deducted. The fraction of solar electricity in the building energy system is 50%. 6.2. Alternative 2: ground source heat pump system in combination with flat plate solar collector system Previous studies have found that turning the heat pump off and using the solar collectors during the summer period for domestic hot water production is the best way of combining solar collectors and commercial available ground source heat pumps as can be seen in [7]. In [7], Kjellsson concluded that using the solar heat for charging a single borehole is very ineffective. If the borehole is deep enough the natural recharge is enough to cover the energy outtake during the heating season. The solar thermal system generates 1428 kWh/year for the pro- duction of domestic hot water. If the ground source heat pump would have to produce the same amount of domestic hot water with the same prerequisites the electricity needed would be the energy generated by the solar thermal system divided with the heat pump coefficient of performance. The generation of 1428 kWh of heat from the solar thermal sys- tem resulted in saving of 537 kWh due to the decreased operation of the heat pump. The annual COP of the heat pump increased with 0.11 units to 3.09 and the annual operating time is decreased by 405–1452 h. As can be seen in Fig. 10 the saved electricity due to the flat plate collectors is small. This is because it is difficult to combine heat pumps with systems that compete with the heat pumps operation, i.e. domestic hot water production or space heating. The annual building electricity demand including household electricity is decreased from 10,157 or 73.6 kWh/m2 living area to 9410 or 68 kWh/m2 living area which is a decrease of 748 kWh or 5.4 kWh/m2 living area. The decrease in the annual building electricity demand is higher than the contribution from the flat plate solar collector system because of the higher heat pump coefficient of performance. The fraction of solar energy in the building energy system is 5.7%. 6.3. Alternative 3, ground source heat pump system in combination with flat plate solar collector system and PV-system with monthly net metering The third system is a combination of the first two with one important difference. The PV-system will be smaller because the flat plate solar collector system decreases the building total elec- tricity demand during summer months and it is this demand the PV-system is dimensioned against. Therefore the system needs to be smaller to avoid overproduction. The size of the PV-system in this alternative is 4.60 kWp which is a reduction of 11.3% in comparison with alternative 1. The PV-system will generate 4058 kWh electricity per year and the flat plate solar collector system will generate 1428 kWh of heat which will save 537 kWh of electricity. The building electricity demand including household electricity for this alternative will decrease from 10,157 to 5351 kWh/year or 38.8 kWh/m2, living area. Fig. 11 shows the building electricity demand in comparison to a system with only ground source heat pump and a system as in alternative 1. The solar electricity fraction of the building energy system is 49% which is slightly lower than the alternative with only a PV-system. 7. Economic analysis of solar assisted heat pump systems The discount rate in the calculations is 6% and the electricity price is assumed to increase by 4.7% each year with a starting price
- 92. R. Thygesen, B. Karlsson / Energy and Buildings 66 (2013) 77–87 85 Fig. 10. Total building electricity demand with and without flat plate collector system. of 0.18 D /kWh. This assumption is based on historical changes of the electricity price in Sweden during the past 10 years [14]. PV-module and solar collector degradation has not been taken into account in the calculations. 7.1. Alternative 1: ground source heat pump system in combination with PV-system The investment cost for the PV-system is 14,443 or 2783 D /kWp. The economic lifespan of the PV-system is assumed to be 20 years with regards to inverter lifespan. The annuity of this alternative with continuous metering is −427 D /year and the system is unprofitable. The annuity with daily net metering is 22 D /year and the system is profitable. The annuity with monthly net metering is 106 D /year and the system is profitable. 7.2. Alternative 2: ground source heat pump system in combination with solar thermal system The flat plate solar collector investment cost is 4121 or 981 D /m2 collector aperture area. The economic lifespan of the flat plate collector system is assumed to be 25 years. The annuity of this alternative is −166 D /year which means that the system is unprofitable. Solar collector systems used for producing domestic hot water in combination with heat pumps for space heating and domestic Fig. 11. Total building electricity demand with and without flat plate collector system in combination with PV-system.
- 93. 86 R. Thygesen, B. Karlsson / Energy and Buildings 66 (2013) 77–87 Fig. 12. Sensitivity analysis of annual electricity price change. hot water production will be profitable in Sweden if the system price is reduced by approximately 50%. 7.3. Alternative 3: ground source heat pump system in combination with flat plate solar collector system and PV-system with monthly net metering The economic lifespan of the system as a whole is assumed to be 20 years. The investment cost for the flat plate solar collector system and the PV-system is 16,908 D . The annuity of this alternative is −212 D /year which means that the system is unprofitable with monthly net metering. 7.4. Sensitivity analysis of electricity price change One of the largest uncertainties in this paper is the assumption of the price for electricity. As stated earlier the assumption is based on historical changes of the electricity price in Sweden. The anal- ysis shows that the increase in price must be almost 4% each year for system alternatives 1 with monthly net metering and 4.5% for system alternative 1 with daily net metering if the systems are to be profitable. All other alternatives need a price change much larger than 5%, see Fig. 12. 8. Results The total building electricity demand with the different solar energy systems can be seen in Table 6. System alternative 1 with instantaneous metering is unprofit- able. The solar electricity fraction of this system is 21.5%. System alternative 1 with daily net metering is profitable and yields a solar electricity fraction of 43.5%. System alternative 1 with monthly net metering is an economic feasible way of reaching high solar electricity fractions in a building energy system. The solar electricity fraction is 50%. System alternative 2, with ground source heat pump and solar collectors, is unprofitable and will reach a solar electricity fraction of 5.7%. Table 6 Building electricity demand with different combinations of solar energy systems. System alternative Building electricity demand (kWh) Building electricity demand per square meter living area (kWh/m2 ) 1. GSHP with PV-system (instantaneous metering) 7975 58 1. GSHP with PV-system (daily net metering) 5739 41.6 1. GSHP with PV-system (monthly net metering) 5064 36.7 2. GSHP with flat plate solar collector system 9410 68 3. Alternative 1 + 2 (monthly net metering) 5351 38.8 Table 7 Annuity of the different system alternatives. System alternative Annuity (D /year) 1. GSHP with PV-system (instantaneous metering) −427 1. GSHP with PV-system (daily net metering) 22 1. GSHP with PV-system (monthly net metering) 105 2. GSHP with flat plate solar collector system −166 3. Alternative 1 + 2 (monthly net metering) −212 System alternative 3 is unprofitable and will have a slightly lower solar electricity fraction, 49%, than alternative 1. 9. Discussion and conclusions As can be seen in Table 7 only alternative 1 with daily and monthly net metering is profitable. Alternative 1 with instanta- neous metering give a smaller decrease in the building electricity demands and export and sell larger amounts of the PV generated electricity than the profitable systems. This is the reason why alter- native 1 with daily net metering is less profitable than the same
- 94. R. Thygesen, B. Karlsson / Energy and Buildings 66 (2013) 77–87 87 alternative with monthly net metering and that the same alterna- tive with instantaneous metering is unprofitable. This is explained in detail in Section 3.4. All systems are sensitive to changes in the assumed electricity price but systems alternative 2 with a solar thermal system is the least sensitive. That is because the amount of saved electricity is low in that alternative and the reason for this is explained later in this section. The conclusion is that the most effective way of using PV gener- ated electricity is by reducing the amount of electricity needed to be purchased. The reduction of purchased electricity by a PV-system and a heat pump system is a viable way of making the building more energy efficient. As can be seen in Sections 5 and 6 the reduction of pur- chased electricity can be large with relatively small investments. If monthly net metering is introduced in Sweden it is likely that the installation of a PV-system will be a popular way of making buildings more energy efficient. The combination of heat pumps and solar thermal in a system, as in system alternative 2 and 3, where the heat pump produce domestic hot water is ineffective. The heat pump needs for example approximately 1 kWh of purchased electricity to produce 3 kWh of domestic hot water. When the solar collector system produces 3 kWh in a system like this the saving is the electricity the heat pump would have used to produce the same amount of domestic hot water, i.e. 1 kWh. Because of this the savings from a solar collector system is 1/3 in a system with a heat pump in comparison to other heating and domestic hot water systems. This is not a problem only for solar collector systems but for almost all complementary systems. On the other hand the combination of a PV-system with a heat pump that produces domestic hot water is a perfect match where the two systems do not compete for the same domestic hot water load. In fact the heat pump electricity need during the summer months in combination with the household electricity load make it possible to install larger PV-systems. The conclusion is that a system with a ground source heat pump in conjunction with a PV-system is the most effective system with regards to energy and economics. 10. Further work System alternative 1 with a PV- and a ground source heat pump will be studied further and the simulation model will be enhanced. Acknowledgement The work was funded by the Swedish Effsys+ Program, which is primarily financed by the Swedish Energy Agency. References [1] European Commission, EU Energy in Figures, Statistical Pocketbook, 2012, http://ec.europa.eu/energy/publications/doc/2012 energy figures.pdf [2] European Commission, Energy Performance of Buildings Directive, 2012, http://eur-lex.europa.eu/LexUriServ/LexUriServ.do?uri=OJ:L:2012:081: 0018:0036:EN:PDF: 2012:081:0018:0036:EN:PDF. 2012-08-27. [3] Swedish Heat Pump Association (SVEP), 2012, http://www.svepinfo.se/ (in Swedish). [4] G. Xu, et al., Simulation of a photovoltaic/thermal heat pump system having a modified collector/evaporator, Solar Energy 83 (2009) 1967–1976. [5] H. Chena, et al., Numerical study on a novel photovoltaic/thermal heat pump system, Energy Procedia 12 (2011) 547–553. [6] S. Eicher, et al., Solar assisted heat pump for domestic hot water production, Energy Procedia 30 (2012) 571–579. [7] E. Kjellsson, Solar Collectors Combined with Ground-Source Heat Pumps in Dwellings, Analyses of System Performance, Lund University, Sweden, 2009, Ph.D. Thesis. [8] S.A. Klein, et al., TRNSYS 17, A TRansient SYstem Simulation Program, User Manual Solar Energy Laboratory, University of Wisconsin-Madison, Madison, 2010. [9] European Committee for Standardization, EN 16147:2011 Heat Pumps with Electrically Driven Compressors – Testing and Requirements for Marking of Domestic Hot Water Units, 2011. [10] D. Fiala, et al., Influence of the domestic hot-water daily draw-off pro- file on the performance of a hot-water store, Applied Energy 83 (2006) 749–773. [11] Swedish National Board of Housing, Building and Planning, Building Reg- ulations, 2012, http://www.boverket.se/Om-boverket/Webbokhandel/ Publikationer/2008/Building-Regulations-BBR/ [12] Sollentuna Energi, Measurment Data Obtained from the Electricity Grid Oper- ator, Sollentuna Energi, 2008. [13] J.A. Duffie, W.A. Beckman, Solar Engineering of Thermal Processes, third ed., John Wiley Sons Inc., 2006. [14] Statistics Sweden, Prices on Electricity and Transmission of Electricity (Network Tariffs), 2013, http://www.scb.se/Pages/ProductTables 6441.aspx (2013-02- 05).
- 95. Jenni Energietechnik AG Lochbachstrasse 22 • Postfach • CH-3414 Oberburg bei Burgdorf • Schweiz T +41 34 420 30 00 • F +41 34 420 30 01 • info@jenni.ch • www.jenni.ch La transition énergétique est une question de stockage Le terme de transition énergétique décrit le passage des énergies conventionnelles qui sont généralement polluantes, aux énergies renouvelables plus propres. Ainsi le stockage de l’énergie est un élément fondamental dans la réussite de la transition énergétique. Les énergies conventionnelles comme le mazout, le gaz, le charbon, l’énergie atomique sont stockables et utilisables à la de- mande. Ceci est un avantage important et permet de fournir l’énergie en fonction de la consommation. En revanche, la produc- tion d’énergie renouvelable n’est pas constante. Des variations saisonnières (été/ hiver), journalières (jour/ nuit) et météorolo- giques conduisent à une production irrégulière qui évolue rapidement, c’est pourquoi le stockage de l’énergie est indispen- sable. Actuellement, il est techniquement possible de fournir une part importante d’énergie en utilisant des techniques propres. Mais cela ne sert à rien d’avoir suffisamment d’énergie si celle-ci est disponible au mauvais moment. Le défi est donc de pou- voir stocker cette énergie pour combler les périodes de faible production. Aujourd’hui plusieurs technologies de stockage sont utilisées. La liste ci-dessous énumère les principales technologies sur le marché : Les batteries Lithium-Ion sont très répandues par exemple dans les appareils électroniques comme les appa- reils photos et les téléphones portables. Elles sont aussi utilisées dans les voitures électriques actuelles. Le prix pour le stockage de l’énergie est très élevé. Le cycle de recharge et la durée de vie sont très limités. Dans l’ensemble, nous considérons que le potentiel de cette technologie de stockage est surestimé. Les batteries au plomb sont utilisées principalement dans les voitures conventionnelles. Avec cette technolo- gie, on ne peut stocker qu’environ 1 kWh. L’utilisation à grande échelle de ces batteries pour le stockage d’électricité photovoltaïque produite par une maison familiale n’est pas appropriée en raison de son coût élevé et de la disponibilité limitée des matières premières nécessaires à sa fabrication. Les centrales de pompage-turbinage représentent à l’heure actuelle la seule possibilité industriellement ap- plicable de stocker en grande quantité de l’électricité. La production excédentaire d’électricité des jours enso- leillés est stockée par pompage pour être turbiné plus tard et transformé en électricité selon la demande. Plu- sieurs projets d’envergure sont actuellement en cours ou en projets dans les alpes. Il s’agit d’une technologie éprouvée avec une longue durée de vie et une cyclabilité illimitée, mais elle soulève des questions au niveau de la préservation du paysage et la protection des cours d’eau. Le stockage thermique de l’eau fournit le moyen le moins cher et le plus adapté pour le stockage de la cha- leur. Les coûts du stockage à court terme voire saisonnier de l’énergie sont faibles. Les panneaux solaires thermiques couplés à un réservoir d’eau utilisé comme accumulateur thermique ont fait leur preuve dans le chauffage d’un bâtiment et son approvisionnement en eau chaude sanitaire. Cette technique présente l’avantage d’une cyclabilité illimitée, d’une disponibilité suffisante des matières premières pour la fabrication de l’installation ainsi qu’une longue durée de vie. Quand les pertes thermiques de l’accumulateur sont utilisées, cette énergie peut atteindre un haut rendement jusqu’à pratiquement 100%. Les autres formes de stockage de l’énergie comme l’énergie cinétique, l’air comprimé, la production d’hydrogène, l’utilisation de la chaleur latente, etc. ont encore un grand besoin de développement et ont peu de potentiel physique ou sont par ailleurs peu adaptées. C’est pourquoi elles restent du domaine de « l’utopie ». En l’état actuelle des connaissances, la production d’hydrogène par du solaire thermique semble la technique la plus envisageable pour le stockage saisonnier de l’énergie, à la condition que le prix de l’énergie soit plus élevé qu’aujourd’hui. De plus, le rendement global est relativement faible. Dans le cadre de la transition énergétique, il est important de savoir que l’électricité ne représente que 24% de la consomma- tion totale d’énergie en suisse. L’énergie n’est pas seulement de l’électricité. L’électricité est une énergie noble, c.-à-d. qu’elle résulte de la transformation d'une autre forme d'énergie comme la chaleur ou le mouvement. Pour réduire la dépendance à l’électricité, des alternatives doivent être utilisées. Par exemple, au lieu d’équiper une habitation d’une pompe à chaleur alimenté électriquement, il est possible de la chauffer directement en énergie thermique sans autre transformation d’énergie (installation de panneaux solaires thermiques). Le bois peut aussi être utilisé comme stock d’énergie pour une utilisation décentralisée. Ce- pendant il est important que celui-ci soit utilisé uniquement lorsque les autres sources d’énergies renouvelables ne sont pas disponibles et qu’il n’y ait pas de surexploitation des forêts.
- 96. Vue d’ensemble de différentes technologies de stockage Stockage à court terme: Du jour à la nuit 1 à 3 jours Stockage à moyen terme: Fin d’une période de beau à la prochaine période 10 à 30 jours Stockage saisonnier: Du printemps à l‘hivers 100 jours Technologies Capacité de stockage kWh par m3 Prix CHF par m3 Prix CHF par kWh de capacité de stockage Prix de l’énergie Pour une saison de stockage CHF par kWh Disponibilité de la ressource Cycles de charges Durabilité en années Electricité Batterie Lithium-Ion 400 160`000.-- 400.-- 40.-- Très critique 500 à 1000 5 à 10 Batterie au plomb 125 15`000.-- 150.-- 20.-- Très critique 500 à 1000 5 à 10 Barrages Pompage- turbinage 2.7 (Hauteur de chute 1000 m) 135.-- 50.-- 0.50 Bonne illimité 100 Thermique Eau Accumulateur thermique (citerne d’acier) 70 (pour Delta T 60°C) 500.-- 7.-- 0.10 Bonne illimité 75 Les chiffres donnés sont des valeurs actuelles relatives au stockage effectif basé sur un volume de stockage de 1m³ (prix de gros net). Les coûts ne se rapportent qu’au prix du stockage d’énergie (sans l’infrastructure nécessaire ni les systèmes de transformation) et sont donnés à titre indicatif. Les coûts peuvent varier fortement, en particulier pour les batteries, en fonction du progrès technologique mais aussi des pénuries de matière premières, de l’augmentation de la demande, etc. Les rende- ments de cycles charge-décharge sont de de l’ordre de 60 à 90% et sont également dépendant de la batterie comme de l’intensité de la charge ou de la décharge, ce qui peut raccourcir considérablement l’espérance de vie des batteries. Conclusion: La capacité de stocker temporairement l’énergie pour une utilisation lors d’une phase de faible production doit être massive- ment augmentée. Pour une mise en œuvre réussie de la transition énergétique, des technologies de stockage écologiques éprouvées et abordables sont nécessaires. Seul des batteries permettent un stockage local de l’énergie électrique. En tenant compte des conditions actuelles (impact sur l’environnement, les besoins en ressources, la durée de vie, la cyclabilité, les coûts), cette idée paraît absurde et avec un poten- tiel très limité. La seule façon envisageable actuellement pour stocker l’électricité renouvelable et ainsi utiliser les pics de pro- ductions, consiste à construire de grandes centrales de pompage-turbinage. En outre, à notre avis les installations solaires thermiques avec accumulation sont une technologie respectant l’environnement comme la disponibilité des ressources ainsi que la préservation du paysage. Dans cette courte présentation, il n’était pas possible de présenter toutes les possibilités de stockage de l’énergie. Nous vou- lions seulement montrer ce qui est faisable et ce qui appartient au domaine des désirs et des illusions. Josef Jenni / Jenni Energietechnik AG / T +41 34 420 30 00 / www.jenni.ch Traduit par Patrice Pasquier pour Sebasol, septembre 2013 Sebasol c/o Pascal Cretton Aloys-Fauquez 6, 1018 Lausanne, Suisse T +41 21 311 37 42 • F +41 86 21 311 37 42 •info@sebasol.ch • www.sebasol.ch Il n’existe pas de baguette ma- gique pour avoir de l’énergie juste au bon moment !
- 97. COSSECO SA, Route de Pra de Plan 5 1618 Châtel-St-Denis Tél : + 41 21 948 81 70, e-mail : info@cosseco.ch L’efficacité Energétique maîtrisée Solarline: solution solaire hybride de chauffage, ECS et climatisation 10. Annexes COSSECO
- 98. Institut ENERGY Solutions hybrides de Pompes à Chaleur Génie mécaniqe Rapport technique et économique 1 Bilan énergétique RUIDA Rapport Bilan énergétique et économique du système de chauffage du bâtiment RUIDA SA – Châtel-St-Denis (CH) Rédigé par Nicolas Huguelet Co-rédigé par Peter Kurmann Sous la direction de Dr. Elena-Lavinia Niederhäuser Option Génie mécanique Mandant Cosseco, Rte de la Pra de Plan, 1618 Châtel-St-Denis Date 17 janvier 2014
- 99. Institut ENERGY Solutions hybrides de Pompes à Chaleur Génie mécaniqe Rapport technique et économique 2 Bilan énergétique RUIDA i Table des matières i Table des matières ............................................................................................ 1 1 Introduction ........................................................................................................ 3 1.1 L’entreprise COSSECO ......................................................................................................................3 1.1.1 Technologie Solarline [1] ..........................................................................................................3 1.2 Objectifs du Chèque Cleantech ..........................................................................................................5 1.3 Contenu du présent rapport ................................................................................................................5 2 Présentation de l’installation de chauffage ........................................................ 6 2.1 Schéma de l’installation ......................................................................................................................7 3 Bilan énergétique............................................................................................... 8 3.1 Bilan thermique ...................................................................................................................................8 3.2 Bilan de l’installation de chauffage......................................................................................................9 3.2.1 Bilan de la PAC.......................................................................................................................12 3.2.2 Bilan de l’installation globale...................................................................................................13 3.2.3 Résultats.................................................................................................................................15 3.3 Comparaison des besoins.................................................................................................................16 4 Bilan économique ............................................................................................18 4.1 Consommations ................................................................................................................................18 4.2 Comparaison avec une installation classique (mazout)....................................................................19 4.3 Comparaison installation classique (PAC) avec SOLARLINE..........................................................20 4.4 Synthèse du bilan économique.........................................................................................................21 5 Conclusion .......................................................................................................22 6 Bibliographie et sources ..................................................................................23
- 100. Institut ENERGY Solutions hybrides de Pompes à Chaleur Génie mécaniqe Rapport technique et économique 3 Bilan énergétique RUIDA 1 Introduction 1.1 L’entreprise COSSECO COSSECO est une entreprise basée à Châtel-St-Denis qui met en œuvre des solutions hybrides de Pompes à Chaleur. Elle possède sa propre technologie de régulation qui permet d’augmenter de manière significative les performances d’une installation de chauffage : Solarline. 1.1.1 Technologie Solarline [1] Solarline est créé autour d’un concept économique et écologique : auto-consommer un maximum d’énergie produite par les panneaux Solaires Photovoltaïques. Pour atteindre ce but, COSSECO a développé un système de régulation unique qui permet de tirer parti de chaque kW produit par l’installation photovoltaïque qui lui est reliée. De plus, afin d’absorber les variations journalières de production photovoltaïques, COSSECO utilise des ballons de stockage d’eau chauffée (ou refroidie, pour le rafraichissement en été) afin d’aligner la production solaire photovoltaïque avec la consommation. Schéma de principe de fonctionnement de Solarline : Figure 1 - Principe de fonctionnement de Solarline
- 101. Institut ENERGY Solutions hybrides de Pompes à Chaleur Génie mécaniqe Rapport technique et économique 4 Bilan énergétique RUIDA Fonctionnement en régime nominal L’apport solaire de la journée couvre tous les besoins : chauffage / rafraichissement et Eau Chaude Sanitaire. Le surplus d’énergie produit par les panneaux photovoltaïques est alors converti par la PAC en eau chaude / froide et est stocké dans des ballons pendant le jour puis diffusé pendant la nuit. Le stockage sous forme d’eau chauffée / refroidie est plus économique et moins polluant que les solutions de stockage de l’énergie par des batteries. Fonctionnement avec de forts besoins Si l’apport solaire photovoltaïque ne couvre pas tous les besoins, la solution Solarline prend un apport du réseau électrique pour conserver le bâtiment à la température demandée. De plus, si le tarif électrique est plus favorable la nuit, alors Solarline peut chauffer de l’eau la nuit pour une utilisation de chauffage pendant la journée.
- 102. Institut ENERGY Solutions hybrides de Pompes à Chaleur Génie mécaniqe Rapport technique et économique 5 Bilan énergétique RUIDA 1.2 Objectifs du Chèque Cleantech Etablir le bilan énergétique, ainsi que la réalisation d’un modèle simplifié et/ou paramétrique pour la simulation sous Polysun, d’une installation de production de chaleur (chauffage et ECS) et de froid (refroidissement actif) d’une installation innovante comprenant une régulation intelligente d’un couplage pompe à chaleur – solaire photovoltaïque. 1.3 Contenu du présent rapport Ce rapport présente les résultats sous forme de bilans économiques, énergétiques et coefficients de performances de l’installation de chauffage du bâtiment RUIDA à Châtel-St-Denis, réalisée par COSSECO. Le modèle Polysun sera présenté dans un autre rapport consacré uniquement à la simulation énergétique du bâtiment. Le présent rapport contient : Une description technique de l’installation de chauffage du bâtiment RUIDA SA, situé à Châtel-St-Denis Bilan énergétique de l’installation de chauffage du bâtiment RUIDA SA Bilan économique Note : Ce rapport présente des résultats de bilans énergétiques, tous selon les normes SIA 380/1 [2], IEA SHC Task 44 [3].
- 103. Institut ENERGY Solutions hybrides de Pompes à Chaleur Génie mécaniqe Rapport technique et économique 6 Bilan énergétique RUIDA 2 Présentation de l’installation de chauffage Données du bâtiment [5], [6] Exigences d’après SIA 380/1 (éd. 2007), Bâtiment neuf Année de construction 2011 Altitude 811 m Surface de référence énergétique (SRE) 2154 m2 Rapport de forme 1.02 Type de chauffage Chauffage au sol Besoins de chaleur pour chauffage 116 MJ/m2 Besoins de chaleur pour ECS 27 MJ/m2 Température de dimensionnement 30 °C Géothermie Puissance totale 51 kW 3 PAC géothermiques GHP15B – B0W35 Profondeurs des sondes 4 * 250 m PAC modulables en puissance PAC réversibles (climatisation) Photovoltaïque Puissance totale installée 4.8 kWp Surface de captage 32 m2 Orientation des modules Plein sud Azimut 50° Modules PV JA Solar Holdings JAM6-240 Figure 2 – Système de chauffageFigure 3 – Bâtiment RUIDA
- 104. Institut ENERGY Solutions hybrides de Pompes à Chaleur Génie mécaniqe Rapport technique et économique 7 Bilan énergétique RUIDA 2.1 Schéma de l’installation Le schéma de principe illustré par la Figure 4 ci-dessous décrit le système de chauffage du bâtiment RUIDA. Les éléments principaux sont décrits dans les encadrés (marque, type, modèle). Figure 4 - Schéma de principe du système de chauffage
- 105. Institut ENERGY Solutions hybrides de Pompes à Chaleur Génie mécaniqe Rapport technique et économique 8 Bilan énergétique RUIDA 3 Bilan énergétique 3.1 Bilan thermique Les principaux termes d’un bilan thermique détaillé pour un bâtiment sont illustrés à la Figure 5 et brièvement commentés ci-après. Pour plus de détails concernant le bilan thermique du bâtiment RUIDA, consulter le justificatif énergétique global [6]. Figure 5 - Bilan thermique détaillé d'un bâtiment [2] 1 Limite du système pour la détermination des besoins de chaleur pour le chauffage 2 Limite du système pour la détermination des besoins de chaleur pour l’eau chaude sanitaire 3 Limite du système installation de chauffage, production d’eau chaude sanitaire et refroidissement 4 Limite du système bâtiment EF,EI Besoin d’électricité pour l’éclairage et les installations techniques [MJ/m2 ] EF,hww Besoins d’énergie finale pour le chauffage et l’eau chaude sanitaire [MJ/m2 ] Qg Apports de chaleur [MJ/m2 ] Qh Besoins de chaleur pour le chauffage [MJ/m2 ] Qhww Besoins de chaleur pour le chauffage et l’eau chaude sanitaire [MJ/m2 ] Qi Apports de chaleur internes [MJ/m2 ] QiEI Apports de chaleur internes des installations électriques [MJ/m2 ] QiP Apports de chaleur internes dus aux personnes [MJ/m2 ]
- 106. Institut ENERGY Solutions hybrides de Pompes à Chaleur Génie mécaniqe Rapport technique et économique 9 Bilan énergétique RUIDA QL Pertes de chaleur du système de chauffage et de production [MJ/m2 ] d’eau chaude sanitaire (pertes à la production, au stockage et à la distribution) Qr Chaleur soutirée à l’environnement [MJ/m2 ] Qs Apports de chaleur solaires [MJ/m2 ] QT Déperditions par transmission [MJ/m2 ] Qtot Déperditions totales [MJ/m2 ] Qug Apports de chaleur utiles [MJ/m2 ] QV Déperditions par renouvellement d’air [MJ/m2 ] Qww Besoins de chaleur pour l’eau chaude sanitaire [MJ/m2 ] RC Récupération de chaleur [MJ/m2 ] Epv Part d’énergie photovoltaïque pour le chauffage et l’eau chaude sanitaire [MJ/m2 ] EF Part d’énergie consommée au réseau pour le chauffage et l’eau chaude sanitaire [MJ/m2 ] Qc Chaleur soutirée aux locaux pour les besoins de climatisation [MJ/m2 ] 3.2 Bilan de l’installation de chauffage Afin de calculer les coefficients de performances (COP), on se limite à faire des bilans au niveau de la frontière numéro 3 (installation de chauffage) de la Figure 5. Les éléments se trouvant à l’intérieur de cette frontière sont décrits selon la norme EIA SHC Task 44 [3] et représentés dans la Figure 6 ci- dessous : Figure 6 - Schéma-bloc de l'installation de chauffage (frontière 3 du bilan thermique)