Online-Press – The most-used DEVICES: SMARTPHONE, TABLET or COMPUTER?
•
0 j'aime•683 vues

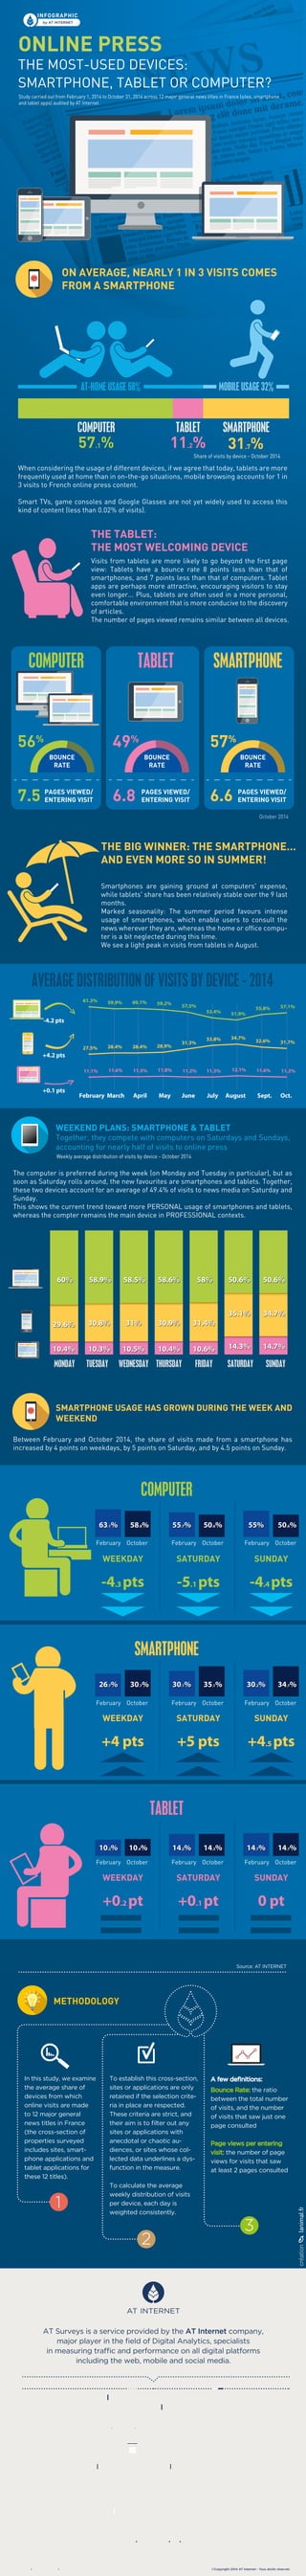
Desktop, Tablet or Smartphone? Which devices are most-used to check French news websites? In this infographic, you’ll find a detailed analysis carried out between February 1 and October 31, 2014, across 12 major general news titles in France. Bounce rate, seasonality, trends and evolution per device… Here, we put it all under the microscope.
Recommandé

Recommandé
Contenu connexe
Tendances
Tendances (9)
En vedette
En vedette (20)
Similaire à Online-Press – The most-used DEVICES: SMARTPHONE, TABLET or COMPUTER?
Similaire à Online-Press – The most-used DEVICES: SMARTPHONE, TABLET or COMPUTER? (20)
Plus de AT Internet
Plus de AT Internet (20)
Dernier
Dernier (20)
Online-Press – The most-used DEVICES: SMARTPHONE, TABLET or COMPUTER?
- 1. INFOGRAPHIC by AT INTERNET ONLINE PRESS THE MOST-USED DEVICES: SMARTPHONE, TABLET OR COMPUTER? Study carried out from February 1, 2014 to October 31, 2014 across 12 major general news titles in France (sites, smartphone and tablet apps) audited by AT Internet. Share of visits by device - October 2014 When considering the usage of different devices, if we agree that today, tablets are more frequently used at home than in on-the-go situations, mobile browsing accounts for 1 in 3 visits to French online press content. Smart TVs, game consoles and Google Glasses are not yet widely used to access this kind of content (less than 0.02% of visits). Visits from tablets are more likely to go beyond the first page view: Tablets have a bounce rate 8 points less than that of smartphones, and 7 points less than that of computers. Tablet apps are perhaps more attractive, encouraging visitors to stay even longer... Plus, tablets are often used in a more personal, comfortable environment that is more conducive to the discovery of articles. The number of pages viewed remains similar between all devices. COMPUTER AT-HOME USAGE 68% MOBILE USAGE 32% 31.7% SMARTPHONE ON AVERAGE, NEARLY 1 IN 3 VISITS COMES FROM A SMARTPHONE THE TABLET: THE MOST WELCOMING DEVICE Smartphones are gaining ground at computers' expense, while tablets' share has been relatively stable over the 9 last months. Marked seasonality: The summer period favours intense usage of smartphones, which enable users to consult the news wherever they are, whereas the home or office compu- ter is a bit neglected during this time. We see a light peak in visits from tablets in August. THE BIG WINNER: THE SMARTPHONE... AND EVEN MORE SO IN SUMMER! 57.1% 11.2% TABLET SMARTPHONETABLETCOMPUTER BOUNCE RATE 56% 7.5 PAGES VIEWED/ ENTERING VISIT BOUNCE RATE BOUNCE RATE 49% 6.8 57% 6.6 61.3% 59.9% 60.1% 59.2% 57.5% 53.4% 51.9% 55.8% 57.1% 27.5% 28.4% 28.4% 28.9% 31.3% 33.8% 34.7% 32.6% 31.7% 11.1% 11.6% 11.5% 11.8% 11.2% 11.3% 12.1% 11.6% 11.2% February March April May June July August Sept. Oct. AVERAGE DISTRIBUTION OF VISITS BY DEVICE - 2014 The computer is preferred during the week (on Monday and Tuesday in particular), but as soon as Saturday rolls around, the new favourites are smartphones and tablets. Together, these two devices account for an average of 49.4% of visits to news media on Saturday and Sunday. This shows the current trend toward more PERSONAL usage of smartphones and tablets, whereas the compter remains the main device in PROFESSIONAL contexts. WEEKEND PLANS: SMARTPHONE & TABLET Together, they compete with computers on Saturdays and Sundays, accounting for nearly half of visits to online press SMARTPHONE USAGE HAS GROWN DURING THE WEEK AND WEEKEND MONDAY TUESDAY WEDNESDAY THURSDAY FRIDAY SATURDAY SUNDAY COMPUTER 10.4% 29.6% 10.3% 30.8% 60% 58.9% 10.5% 31% 58.5% 10.4% 30.9% 58.6% 10.6% 31.4% 58% 14.3% 35.1% 50.6% 14.7% 34.7% 50.6% Between February and October 2014, the share of visits made from a smartphone has increased by 4 points on weekdays, by 5 points on Saturday, and by 4.5 points on Sunday. Weekly average distribution of visits by device - October 2014 -4.2 pts +4.2 pts +0.1 pts 63.1% 58.8% February October February October February October February October February October February October February October February October February October 55.7% 50.6% 55% 50.6% -4.3 pts -5.1 pts -4.4 pts SMARTPHONE 26.7% 30.7% 30.1% 35.1% 30.2% 34.7% +4 pts +5 pts +4.5 pts TABLET WEEKDAY SATURDAY SUNDAY 10.2% 10.4% 14.2% 14.3% 14.7% 14.7% +0.2 pt +0.1 pt 0 pt October 2014 PAGES VIEWED/ ENTERING VISIT PAGES VIEWED/ ENTERING VISIT WEEKDAY SATURDAY SUNDAY WEEKDAY SATURDAY SUNDAY METHODOLOGY Source: AT INTERNET In this study, we examine the average share of devices from which online visits are made to 12 major general news titles in France (the cross-section of properties surveyed includes sites, smart- phone applications and tablet applications for these 12 titles). A few definitions: Bounce Rate: the ratio between the total number of visits, and the number of visits that saw just one page consulted Page views per entering visit: the number of page views for visits that saw at least 2 pages consulted To establish this cross-section, sites or applications are only retained if the selection crite- ria in place are respected. These criteria are strict, and their aim is to filter out any sites or applications with anecdotal or chaotic au- diences, or sites whose col- lected data underlines a dys- function in the measure. To calculate the average weekly distribution of visits per device, each day is weighted consistently. 1 2 3 AT Surveys is a service provided by the AT Internet company, major player in the field of Digital Analytics, specialists in measuring traffic and performance on all digital platforms including the web, mobile and social media. ©Copyright 2014 AT Internet - Tous droits réservéswww.atinternet.com Analyses on various topics thanks to the use of an exclusive database of more than 100,000 sites http://www.atinternet.com/en/resources/resources/studies/ AT Internet offers companies THE AT INSIGHT BENCHMARK AND PERFORMANCE AUDIT www.atinsight.co.uk SEARCH ENGINE BAROMETER OPERATING SYSTEMS BAROMETER BROWSER BAROMETER WEB TRENDS