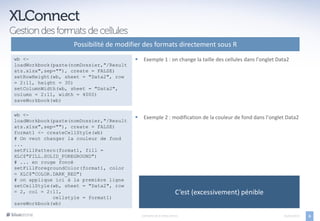
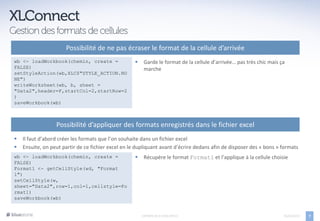
Le document présente xlconnect, un outil pour exporter des données de R vers Microsoft Office, capable de gérer à la fois des fichiers xls et xlsx. Il détaille les fonctionnalités d'importation et d'exportation, ainsi que des options pour modifier des formats directement dans R. Les étapes d'utilisation, la création de documents Word, Excel et PowerPoint sont également décrites avec divers exemples de code.


![Ouverture de Word et création d’un document
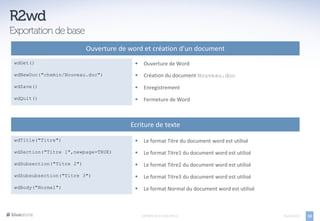
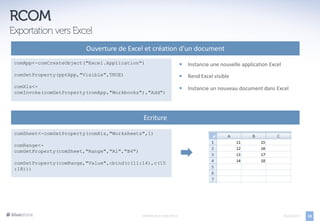
comApp<-comCreateObject("Word.Application")
Instancie une nouvelle application Word
comSetProperty(comApp,"Visible",TRUE)
Rend Word visible
comDoc<-
comInvoke(comGetProperty(comApp,"Documents"),"Add") Instancie un nouveau document dans Word
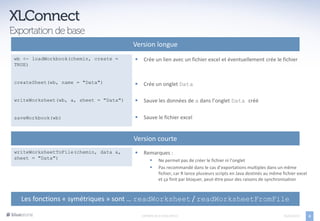
Ecriture de texte
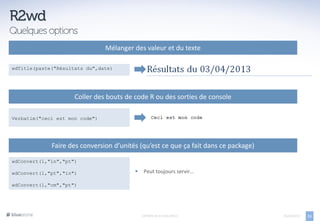
comApp[["Selection"]][["Text"]]<- "Ecrire du Pas très ergonomique
texte…"
Créer un graphique
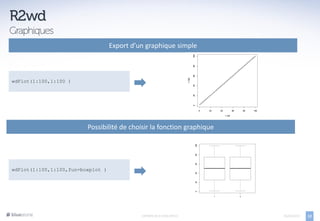
win.metafile()
plot(density(rnorm(10000,0,1)))
dev.off()
# Etape 4: insertion graphique dans le workbook
comSelection<-comApp[["Selection"]]
docImage<-comInvoke(comSelection,"Paste")
EXPORTS DE R VERS OFFICE 05/04/2013 17](https://image.slidesharecdn.com/exportsderversoffice-130405045732-phpapp02/85/Exports-de-r-vers-office-17-320.jpg)
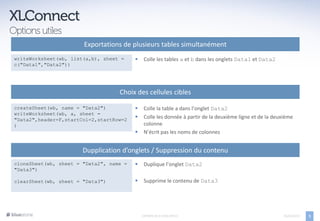
![Ouverture de PowerPoint et création d’un document
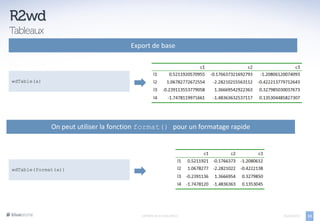
comApp<-comCreateObject("PowerPoint.Application") Instancie une nouvelle application PowerPoint
comSetProperty(comApp,"Visible",TRUE) Rend PowerPoint visible
pptPresentation<- Instancie un nouveau document dans
comInvoke(pptApp[["Presentations"]],"Add",-1)
PowerPoint
pptSlides<-comGetProperty(pptPresentation,"Slides")
Ecriture
pptCurrSlide<-comInvoke(pptSlides,"Add",1,11)
pptShapes<-pptCurrSlide[["Shapes"]]
pptCurrShape[["TextFrame"]][["TextRange"]][["Text"]
]<- "Slide créée depuis R"
EXPORTS DE R VERS OFFICE 05/04/2013 19](https://image.slidesharecdn.com/exportsderversoffice-130405045732-phpapp02/85/Exports-de-r-vers-office-19-320.jpg)


