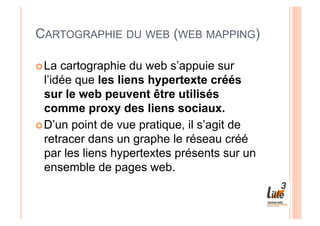
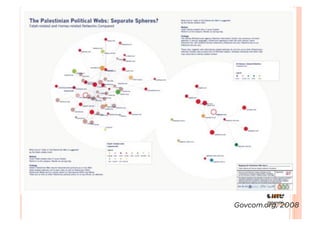
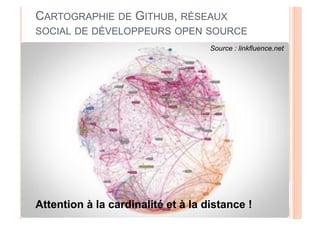
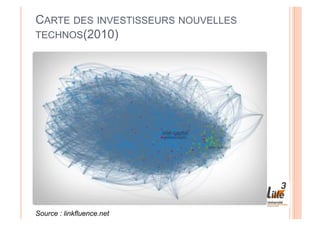
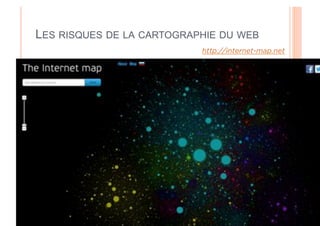
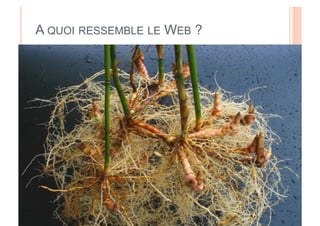
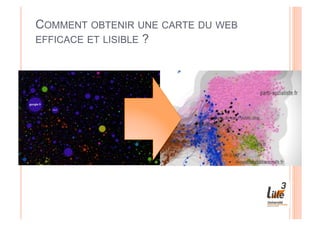
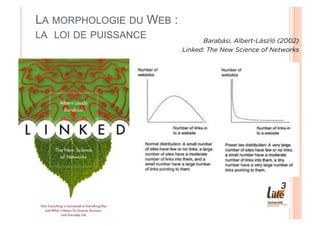
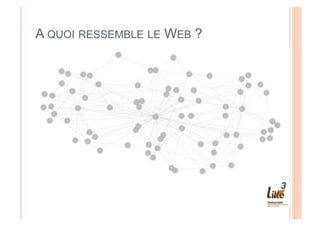
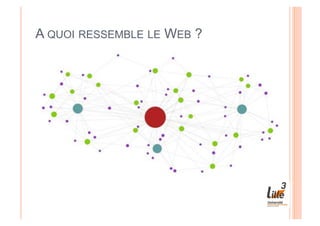
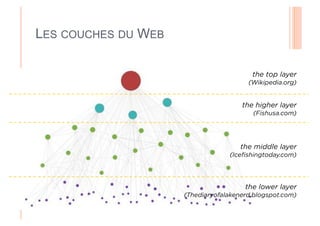
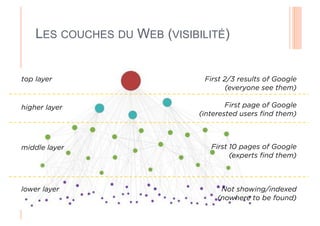
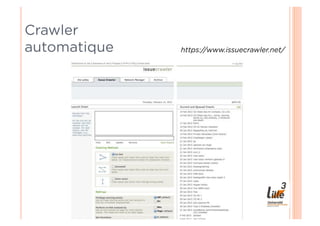
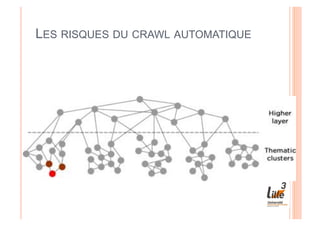
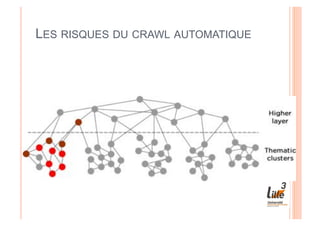
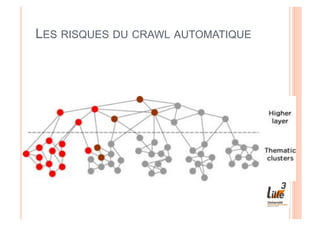
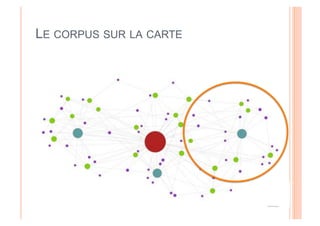
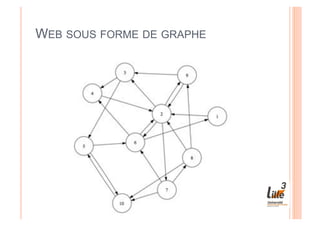
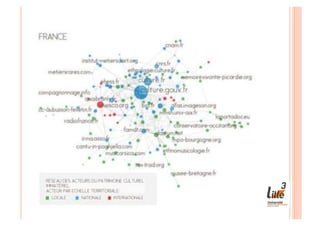
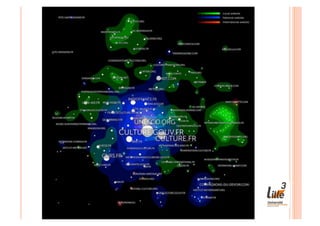
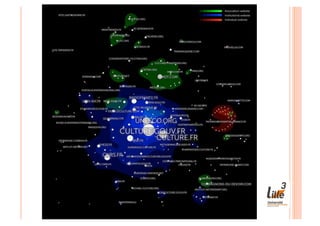
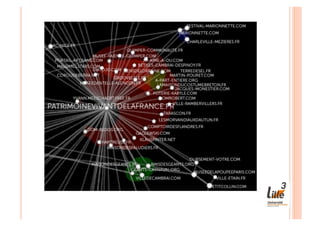
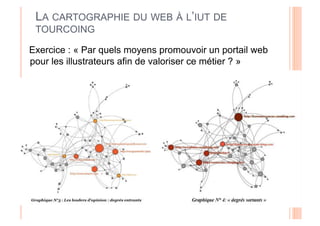
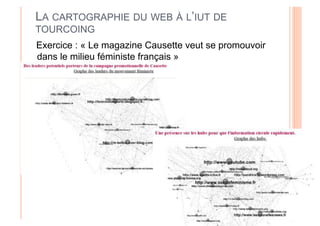
APPROCHES ET MÉTHODES EN
VISUALISATION DE L'INFORMATION :
LA CARTOGRAPHIE DU WEB

   Marta Severo – Université de Lille 3, Laboratoire Gériico
   marta.severo@univ-lille3.fr
LES MÉDIAS COMME UN OBJET D’ÉTUDE


Photo credit – Brandon Doran via Flickr - ©
LES MÉDIAS COMME PAPIER CARBONE


                                  Chris Harrison, 2007
         Internet map (World City-to-City Connections)
POPULATIONS LARGES
               Paul Butler, 2010, Visualizing Friendships
DONNÉES RICHES              AOL user 711391 search history
           www.minimovies.org/documentaires/view/ilovealaska
POPULATIONS LARGES ET
                                     Google Flu
DONNÉES RICHES          www.google.org/flutrends
POPULATIONS LARGES ET
                                     Google Flu
DONNÉES RICHES          www.google.org/flutrends
POPULATIONS LARGES ET
                                     Google Flu
DONNÉES RICHES          www.google.org/flutrends
MÉTHODES NUMÉRIQUES (DIGITAL METHODS)

 Une série des méthodes qui
 partagent le fait de se baser
 sur les traces numériques
 comme source d’information
 pour l’étude des
 phénomènes sociaux

R. Rogers, "Internet Research: The Question of Method," Journal
of Information Technology and Politics, 7, 2/3, 2010, 241-260
CARTOGRAPHIE DU WEB (WEB MAPPING)

 La  cartographie du web s’appuie sur
  l’idée que les liens hypertexte créés
  sur le web peuvent être utilisés
  comme proxy des liens sociaux.
 D’un point de vue pratique, il s’agit de
  retracer dans un graphe le réseau créé
  par les liens hypertextes présents sur un
  ensemble de pages web.
Cartographie de la blogosphère politique en 2012
(Le Monde - Linkfluence,
http://www.lemonde.fr/politique/visuel/2012/02/02/cartographie-de-la-blogosphere-politique-
en-2012_1635269_823448.html )
Source : Le Monde / Linkfluence
CARTOGRAPHIE DE LA BLOGOSPHÈRE

 Méthodes   numériques


                              Divided they Blog
                          Adamic & Glance, 2005
Govcom.org, 2008
USAGES EN ENTREPRISE

 Etude des communautés d’influence
 Etude de l’e-réputation sur le Web social
 Etude des conversations spontanées
  autour d’une marque
 Etude de la propagation virale du
  contenu
CARTOGRAPHIE DE GITHUB, RÉSEAUX
SOCIAL DE DÉVELOPPEURS OPEN SOURCE
                                    Source : linkfluence.net


Attention à la cardinalité et à la distance !
CARTE DES INVESTISSEURS NOUVELLES
TECHNOS(2010)


Source : linkfluence.net
Comprendre la
morphologie du Web

  Savoir construire un
  corpus de sites web

    Savoir représenter un
    corpus de sites web
LES RISQUES DE LA CARTOGRAPHIE DU WEB
                           http://internet-map.net
A QUOI RESSEMBLE LE WEB ?
COMMENT OBTENIR UNE CARTE DU WEB
EFFICACE ET LISIBLE ?
LA MORPHOLOGIE DU WEB :
LA LOI DE PUISSANCE             Barabási, Albert-László (2002)
                          Linked: The New Science of Networks
A QUOI RESSEMBLE LE WEB ?
LES COUCHES DU WEB

                                         the top layer
                                        (Wikipedia.org)


                                      the higher layer
                                         (Fishusa.com)


                                      the middle layer
                                  (Icefishingtoday.com)


                                       the lower layer
                     (Thediaryofalakenerd.blogspot.com)
LES COUCHES DU WEB (VISIBILITÉ)


top layer                      First 2/3 results of Google
                                     (everyone see them)

higher layer                          First page of Google
                              (interested users find them)


middle layer                     First 10 pages of Google
                                       (experts find them)


lower layer                         Not showing/indexed
                                   (nowhere to be found)
Comprendre la
morphologie du Web

  Savoir construire un
  corpus de sites web

    Savoir représenter un
    corpus de sites web
LES LOGICIELS : WEB CRAWLER
LES CRAWLERS

 Le   crawler automatique (Issuecrawler)

 Le   crawler manuel (Navicrawler)
Crawler
automatique   https://www.issuecrawler.net/
LES RISQUES DU CRAWL AUTOMATIQUE
LE CRAWL MANUEL : NAVICRAWLER
                     http://webatlas.fr/wp/navicrawler/
DÉLIMITER LE CORPUS
DÉLIMITER LE CORPUS


   couper
   choix libre
séparation facile
DÉLIMITER LE CORPUS


   couper
   choix libre
séparation facile


                            Déchirer
                            choix limité
                         séparation difficile
LE CORPUS SUR LA CARTE
Comprendre la
morphologie du Web


  Savoir construire un
  corpus de sites web


     Savoir représenter un
     corpus de sites web
COMMENT REPRÉSENTER LES LIENS D’UN
CORPUS DE SITES WEB ?
WEB SOUS FORME DE GRAPHE
GEPHI
https://gephi.org/
ALGORITHME FORCE-VECTEUR
GRAPHES DES HYPERLIENS

1. Proximité : Deux nœuds sont
   rapprochés si les sites qu’ils
   représentent sont directement ou
   indirectement liés.
2. Ranking : La taille des nœuds est
   proportionnelle à l’autorité du site (in-
   dregree).
3. Partition : La couleur des nœuds peut
   être changée pour montrer les
   différentes catégories.
EXEMPLES


Severo M. (2012), « Le patrimoine culturel immatériel sur la Toile. Comparaison
entre réseaux nationaux », in Culture et recherche, n. 127, p. 58-57
http://www.culturecommunication.gouv.fr/content/download/53634/415776/file/
Culture%20et%20recherche%20127_automne%202012.pdf
RÉSEAU FRANÇAIS
LA CARTOGRAPHIE DU WEB À L’IUT DE
 TOURCOING

Exercice : « Par quels moyens promouvoir un portail web
pour les illustrateurs afin de valoriser ce métier ? »
LA CARTOGRAPHIE DU WEB À L’IUT DE
TOURCOING
Exercice : « Le magazine Causette veut se promouvoir
dans le milieu féministe français »
Questions ??

www.martasevero.com

Approches et méthodes en visualisation de l'information: la cartographie du Web

  • 1.
    APPROCHES ET MÉTHODESEN VISUALISATION DE L'INFORMATION : LA CARTOGRAPHIE DU WEB Marta Severo – Université de Lille 3, Laboratoire Gériico marta.severo@univ-lille3.fr
  • 2.
    LES MÉDIAS COMMEUN OBJET D’ÉTUDE Photo credit – Brandon Doran via Flickr - ©
  • 3.
    LES MÉDIAS COMMEPAPIER CARBONE Chris Harrison, 2007 Internet map (World City-to-City Connections)
  • 4.
    POPULATIONS LARGES Paul Butler, 2010, Visualizing Friendships
  • 5.
    DONNÉES RICHES AOL user 711391 search history www.minimovies.org/documentaires/view/ilovealaska
  • 6.
    POPULATIONS LARGES ET Google Flu DONNÉES RICHES www.google.org/flutrends
  • 7.
    POPULATIONS LARGES ET Google Flu DONNÉES RICHES www.google.org/flutrends
  • 8.
    POPULATIONS LARGES ET Google Flu DONNÉES RICHES www.google.org/flutrends
  • 9.
    MÉTHODES NUMÉRIQUES (DIGITALMETHODS) Une série des méthodes qui partagent le fait de se baser sur les traces numériques comme source d’information pour l’étude des phénomènes sociaux R. Rogers, "Internet Research: The Question of Method," Journal of Information Technology and Politics, 7, 2/3, 2010, 241-260
  • 10.
    CARTOGRAPHIE DU WEB(WEB MAPPING)  La cartographie du web s’appuie sur l’idée que les liens hypertexte créés sur le web peuvent être utilisés comme proxy des liens sociaux.  D’un point de vue pratique, il s’agit de retracer dans un graphe le réseau créé par les liens hypertextes présents sur un ensemble de pages web.
  • 11.
    Cartographie de lablogosphère politique en 2012 (Le Monde - Linkfluence, http://www.lemonde.fr/politique/visuel/2012/02/02/cartographie-de-la-blogosphere-politique- en-2012_1635269_823448.html )
  • 12.
    Source : LeMonde / Linkfluence
  • 13.
    CARTOGRAPHIE DE LABLOGOSPHÈRE  Méthodes numériques Divided they Blog Adamic & Glance, 2005
  • 14.
  • 15.
    USAGES EN ENTREPRISE  Etudedes communautés d’influence  Etude de l’e-réputation sur le Web social  Etude des conversations spontanées autour d’une marque  Etude de la propagation virale du contenu
  • 16.
    CARTOGRAPHIE DE GITHUB,RÉSEAUX SOCIAL DE DÉVELOPPEURS OPEN SOURCE Source : linkfluence.net Attention à la cardinalité et à la distance !
  • 17.
    CARTE DES INVESTISSEURSNOUVELLES TECHNOS(2010) Source : linkfluence.net
  • 18.
    Comprendre la morphologie duWeb Savoir construire un corpus de sites web Savoir représenter un corpus de sites web
  • 19.
    LES RISQUES DELA CARTOGRAPHIE DU WEB http://internet-map.net
  • 20.
  • 21.
    COMMENT OBTENIR UNECARTE DU WEB EFFICACE ET LISIBLE ?
  • 22.
    LA MORPHOLOGIE DUWEB : LA LOI DE PUISSANCE Barabási, Albert-László (2002) Linked: The New Science of Networks
  • 23.
  • 24.
  • 25.
    LES COUCHES DUWEB the top layer (Wikipedia.org) the higher layer (Fishusa.com) the middle layer (Icefishingtoday.com) the lower layer (Thediaryofalakenerd.blogspot.com)
  • 26.
    LES COUCHES DUWEB (VISIBILITÉ) top layer First 2/3 results of Google (everyone see them) higher layer First page of Google (interested users find them) middle layer First 10 pages of Google (experts find them) lower layer Not showing/indexed (nowhere to be found)
  • 27.
    Comprendre la morphologie duWeb Savoir construire un corpus de sites web Savoir représenter un corpus de sites web
  • 28.
    LES LOGICIELS :WEB CRAWLER
  • 29.
    LES CRAWLERS  Le crawler automatique (Issuecrawler)  Le crawler manuel (Navicrawler)
  • 30.
    Crawler automatique https://www.issuecrawler.net/
  • 31.
    LES RISQUES DUCRAWL AUTOMATIQUE
  • 32.
    LES RISQUES DUCRAWL AUTOMATIQUE
  • 33.
    LES RISQUES DUCRAWL AUTOMATIQUE
  • 34.
    LES RISQUES DUCRAWL AUTOMATIQUE
  • 35.
    LE CRAWL MANUEL: NAVICRAWLER http://webatlas.fr/wp/navicrawler/
  • 36.
  • 37.
    DÉLIMITER LE CORPUS couper choix libre séparation facile
  • 38.
    DÉLIMITER LE CORPUS couper choix libre séparation facile Déchirer choix limité séparation difficile
  • 39.
    LE CORPUS SURLA CARTE
  • 40.
    Comprendre la morphologie duWeb Savoir construire un corpus de sites web Savoir représenter un corpus de sites web
  • 41.
    COMMENT REPRÉSENTER LESLIENS D’UN CORPUS DE SITES WEB ?
  • 42.
    WEB SOUS FORMEDE GRAPHE
  • 43.
  • 44.
  • 45.
    GRAPHES DES HYPERLIENS 1.Proximité : Deux nœuds sont rapprochés si les sites qu’ils représentent sont directement ou indirectement liés. 2. Ranking : La taille des nœuds est proportionnelle à l’autorité du site (in- dregree). 3. Partition : La couleur des nœuds peut être changée pour montrer les différentes catégories.
  • 46.
    EXEMPLES Severo M. (2012),« Le patrimoine culturel immatériel sur la Toile. Comparaison entre réseaux nationaux », in Culture et recherche, n. 127, p. 58-57 http://www.culturecommunication.gouv.fr/content/download/53634/415776/file/ Culture%20et%20recherche%20127_automne%202012.pdf
  • 47.
  • 51.
    LA CARTOGRAPHIE DUWEB À L’IUT DE TOURCOING Exercice : « Par quels moyens promouvoir un portail web pour les illustrateurs afin de valoriser ce métier ? »
  • 52.
    LA CARTOGRAPHIE DUWEB À L’IUT DE TOURCOING Exercice : « Le magazine Causette veut se promouvoir dans le milieu féministe français »
  • 53.