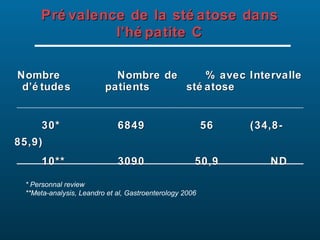
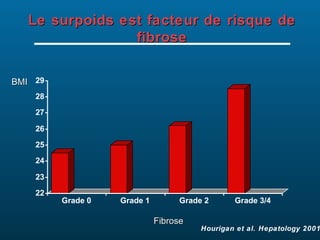
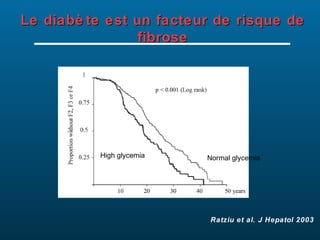
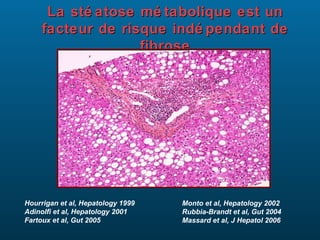
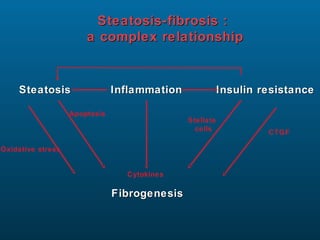
Le document traite des relations complexes entre l'hépatite C, la stéatose hépatique, l'insulinorésistance et le diabète, en définissant les concepts de syndrome métabolique et de stéatose non alcoolique. Il présente des données épidémiologiques, des critères de diagnostic, ainsi que l'impact de l'insulinorésistance dans la progression de la maladie hépatique. Des études soulignent le lien entre l'obésité et l'insulinorésistance, et soulignent l'importance de la gestion de ces facteurs pour améliorer la santé des patients atteints d'hépatite C.


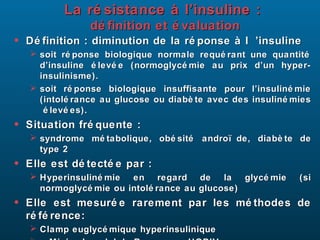
![Evaluation
Formules simples mais grossiè res
• Formules mathé matiques basé es sur des pré lè vements à
jeun
• Homeostasis Model Assessment of Insulin Resistance
HOMA:
Ins (µUI/ml) x Gly (mmol/l) / 22.5
ré sistance à l’insuline si > 3
• Quantitative Insulin Check Index QUICKI :
1 / (log [Ins (µUI/ml)] + log [Gly (mg/dl)])
HGPO : Bon compromis
• Formules mathé matiques basé es sur les pré lè vements
de glycé mie et d’insuliné mie aux diffé rents temps de
l’HGPO (0, 30, 60, 90, 120 min)
• Formule de Belfiore : 2/ [(AUC insulin x AUC glucose)+1]
• Bien corré lé e au clamp](https://image.slidesharecdn.com/serfati-hcvobsit-130118031109-phpapp02/85/Serfati-hcv-obesite-8-320.jpg)


![Niveau des frcv à bzv [mode de compatibilité]](https://cdn.slidesharecdn.com/ss_thumbnails/niveaudesfrcvbzvmodedecompatibilit-130415102247-phpapp02-thumbnail.jpg?width=640&height=640&fit=bounds)


![Cours d immunologie generale Dr Louis [Enregistrement automatique].pptx](https://cdn.slidesharecdn.com/ss_thumbnails/coursdimmunologiegeneraledrlouisenregistrementautomatique-260114234321-8e6b96ef-thumbnail.jpg?width=640&height=640&fit=bounds)
