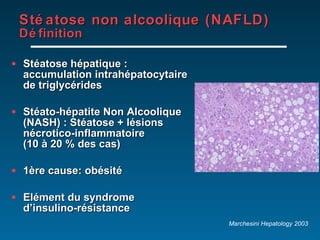
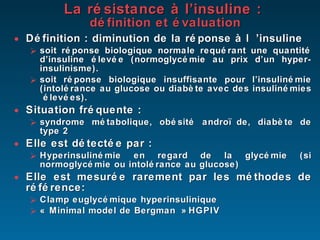
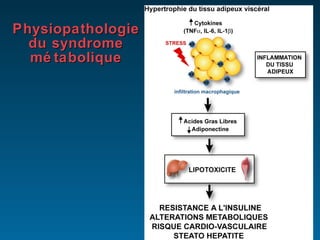
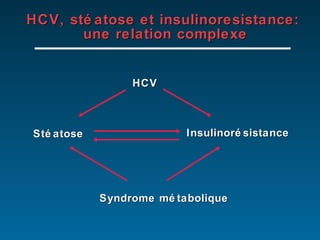
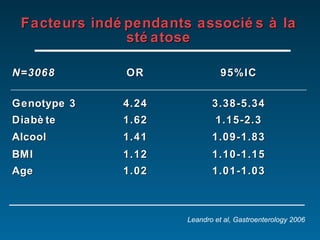
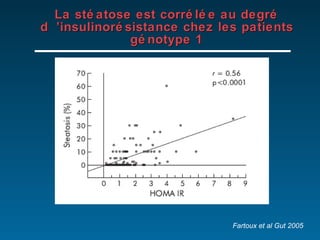
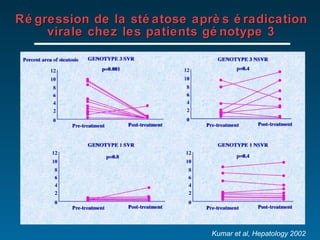
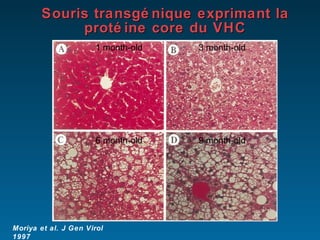
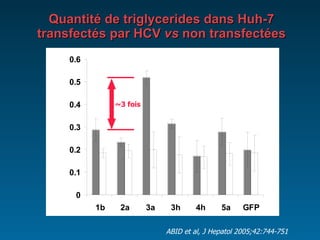
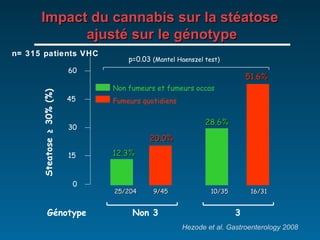
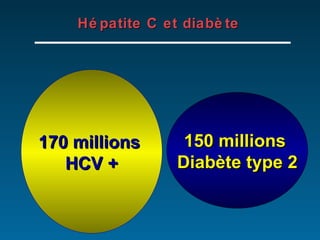
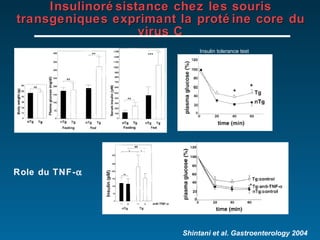
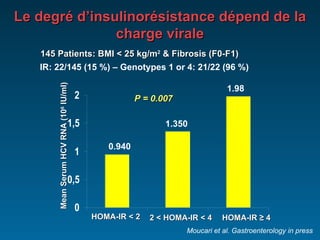
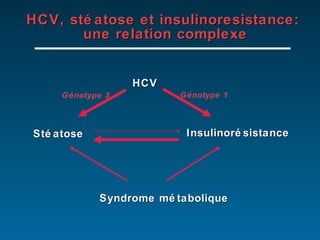
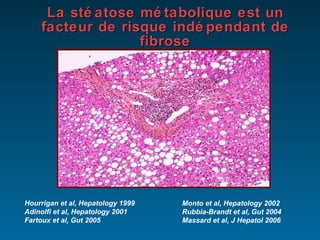
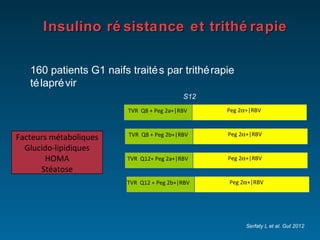
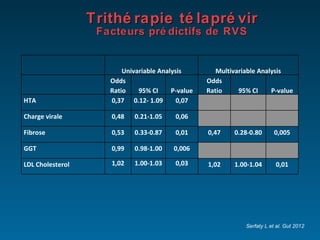
HCV et NASH   Lawrence Serfaty   Service d’Hépatologie Saint-Antoine   UMR-S 893   UPMC
Plan Définitions: NASH, syndrome métabolique, insulinorésistance Le VHC et stéatose Le VHC et diabète Fibrogénèse et facteurs métabolique Traitement antiviral
Stéatose non alcoolique (NAFLD)  Définition Stéatose hépatique : accumulation intrahépatocytaire de triglycérides Stéato-hépatite Non Alcoolique (NASH) : Stéatose + lésions nécrotico-inflammatoire  (10 à 20 % des cas) 1ère cause: obésité Elément du syndrome d’insulino-résistance Marchesini Hepatology 2003
Le syndrome métabolique   Définition IDF 2005 Alberti Lancet 2005 Obésité abdominale    94 cm H, 80 cm F et au moins deux critères: TG    1,7 mmol/l HDL < 1 mmol/l H, 1,3 mmol/l F TA    130/85 ou traitement G à jeun    5,6 mmol/l ou D2T
La résistance à l’insuline :  définition et évaluation Définition : diminution de la réponse à l ’insuline soit réponse biologique normale requérant une quantité d’insuline élevée (normoglycémie au prix d’un hyper- insulinisme). soit réponse biologique insuffisante pour l’insulinémie (intolérance au glucose ou diabète avec des insulinémies  élevées). Situation fréquente :  syndrome métabolique, obésité andro ïde, diabète de type 2 Elle est détectée par : Hyperinsulinémie en regard de la glycémie (si normoglycémie ou intolérance au glucose) Elle est mesurée rarement par les méthodes de référence: Clamp euglycémique hyperinsulinique « Minimal model de Bergman » HGPIV
Evaluation  Formules simples mais grossières   Formules mathématiques basées sur des prélèvements à jeun Homeostasis Model Assessment of Insulin Resistance  HOMA :   Ins (µUI/ml) x Gly (mmol/l) / 22.5   résistance à l’insuline si > 3 Quantitative Insulin Check Index  QUICKI :   1 / (log [Ins (µUI/ml)] + log [Gly (mg/dl)]) HGPO : Bon compromis  Formules mathématiques basées sur les prélèvements de glycémie et d’insulinémie aux différents temps de l’HGPO (0, 30, 60, 90, 120 min) Formule de Belfiore :  2/ [(AUC insulin x AUC glucose)+1] Bien corrélée au clamp
Physiopathologie du syndrome métabolique
Prévalence dans la population générale: US Williams CD et al, Gastroenterology 2011 Stéatose: 46% NASH: 12% Cirrhose: 3%
HCV, stéatose et insulinoresistance:  une relation complexe HCV Stéatose Insulinorésistance Syndrome métabolique
Prévalence de la stéatose dans l’hépatite C Nombre  Nombre de % avec  Intervalle d’études   patients   stéatose 30*    6849   56   (34,8-85,9) 10**   3090   50,9   ND * Personnal review **Meta-analysis, Leandro et al, Gastroenterology 2006
Prévalence de la stéatose dans l’hépatite C et dans les autres hépatopathies n   HCV Témoins* Bach 50   72 % 19 % Lefkowitch 161   69 % 43 % Czaja 60   52 % 22 % Serfaty 100   76% 20% Rozario 127   62% 50% * Chronic hepatitis B or autoimmune liver disease
Facteurs indépendants associés à la stéatose N=3068 OR 95%IC Genotype 3 4.24 3.38-5.34 Diabète 1.62 1.15-2.3 Alcool 1.41 1.09-1.83 BMI 1.12 1.10-1.15 Age 1.02 1.01-1.03 Leandro et al, Gastroenterology 2006
La stéatose est corrélée au degré d ’insulinorésistance chez les patients génotype 1 Fartoux et al Gut 2005
La stéatose est corrélée à la charge virale chez les patients génotype 3 Fartoux et al Gut 2005
Régression de la stéatose après éradication virale chez les patients génotype 3 Kumar et al, Hepatology 2002
Souris transgénique exprimant la protéine core du VHC Moriya et al. J Gen Virol 1997 1 month-old 3 month-old 6 month-old 9 month-old
Inhibition de l’activité microsomal triglyceride transfer protein (MTP) chez la souris transgénique exprimant la protéine core du VHC TG Apo B Impaired VLDL secretion Intracytoplasmic TG storage Steatosis Assembly MTP  Perlemuter et al. FASEB J 2002. HCV core
Quantité de triglycerides dans Huh-7 transfectés par HCV  vs  non transfectées ABID et al, J Hepatol 2005;42:744-751 ~3 fois
Deux types de stéatose dans l’hépatite C Surpoids Genotype 3 Stéatose Alcool Diabète Serfaty et al, Am J Gastoenterol 2002 Rubbia-Brandt et al, J Hepatol 2000 Adinolfi et al, Hepatology 2001 Monto et al, Hepatology 2002 Poynard et al, Hepatology 2003 Stéatose métabolique Insulinorésistance Stéatose virale (virémie)  HCV
Impact du cannabis sur la stéatose  ajusté sur le génotype Génotype  Non 3  3  p=0.03  (Mantel Haenszel test) 20.0% 28.6% 51.6% 0 15 30 45 60 Non fumeurs et fumeurs occas Fumeurs quotidiens Steatose ≥ 30% (%) 12.3% 25/204  9/45  10/35  16/31 Hezode et al. Gastroenterology 2008 n= 315 patients VHC
NASH et hépatite C 278 patients, une hépatite C prouvée histologiquement: HCV seul = 57% HCV + stéatose = 34% HCV + NASH = 9% Bedossa P et al, Hepatology 2007
Insulin resistance and steatosis according to genotype Bedossa P et al, Hepatology 2007 VASH (Viral Associated Steato-Hepatitis)
Types de stéatose en fonction du génotype  Unclassified Viral Metabolic Poynard et al, Hepatology 2001 Viral Metabolic Unclassified Non genotype 3 Genotype 3
Deux types de stéatose dans l’hépatite C Surpoids Genotype 3 Stéatose Alcool Diabète Serfaty et al, Am J Gastoenterol 2002 Rubbia-Brandt et al, J Hepatol 2000 Adinolfi et al, Hepatology 2001 Monto et al, Hepatology 2002 Poynard et al, Hepatology 2003 Stéatose métabolique Insulinorésistance Stéatose virale (virémie)  HCV ?
170 millions  HCV + 150 millions  Diabète type 2 Hépatite C et diabète
Prévalence du diabète dans l’hépatite C  N Population étudiée VHC Contrôles Allison 100  cirrhoses 50% 9% Grimbert 304  hépatopathies 24% 9% Mason 1117  hépatites virales 21% 12% Caronia 1232  cirrhoses virales 23,6% 9,4%
Prévalence de l’infection VHC dans le diabète N Population étudiée Diabètiques Contrôles Mason 594 diabète 377 thyroide 4,2% 1,6% Okan 692 diabète 1014 don sang 7,5% 0,1% Sangiorgio 1514 diabète 7,6% - Simo 176 diabète 6172 don sang 11,5% 2,5%
Infection VHC et risque de diabète Méta analyse études rétrospectives (n=14) White DL et al, J Hepatol 2008
Infection VHC et risque de diabète/VHB Méta analyse études rétrospectives (n=8)
Insulinorésistance: HCV  versus  HBV (Appariés:   Age, Sexe, BMI, Inflammation and Fibrose) 5 % 35 % HOMA-IR > 3 (%) P < 0.001 Moucari et al. Gastroenterology (in press) 462 patients HCV non diabètiques: HOMA > 3 chez 32%
Insulinorésistance chez les souris transgeniques exprimant la protéine core du virus C Shintani et al. Gastroenterology 2004 Insulin tolerance test Role du TNF- 
L’éradication du VHC améliore l’insulinosensibilité HOMA Month Romero-Gomez et al. Gastroenterology 2005 PegIFN+Riba
2842 HCV patients treated with IFN±Riba Sustained virological response reduces incidence of onset of type 2 diabetes in chronic hepatitis C Araze Y, Hepatology 2009
L’insulinorésistance est génotype spécifique Hui et al. Gastroenterology 2004 Moucari et al. Gastroenterology in press Genotype 1 Genotype 3
Mean Serum HCV RNA (10 6  IU/ml) 0.940 1.350 1.98 HOMA-IR < 2 2 < HOMA-IR < 4 HOMA-IR  ≥  4 Le degré d’insulinorésistance dépend de la charge virale P = 0.007 IR: 22/145 (15 %) – Genotypes 1 or 4: 21/22 (96 %) 145 Patients: BMI < 25 kg/m 2  & Fibrosis (F0-F1) Moucari et al. Gastroenterology in press
HCV, stéatose et insulinoresistance:  une relation complexe HCV Stéatose Insulinorésistance Génotype 3 Génotype 1 Syndrome métabolique
Insulinorésistance, stéatose et fibrose
Le surpoids est facteur de risque de fibrose BMI Fibrose Hourigan et al. Hepatology 2001
Le diabète est un facteur de risque de fibrose Normal glycemia   High glycemia   Ratziu et al. J Hepatol 2003
La stéatose métabolique est un facteur de risque indépendant de fibrose Hourrigan et al, Hepatology 1999 Adinolfi et al, Hepatology 2001 Fartoux et al, Gut 2005 Monto et al, Hepatology 2002 Rubbia-Brandt et al, Gut 2004 Massard et al, J Hepatol 2006
Steatosis-fibrosis :  a complex relationship Steatosis Fibrogenesis Oxidative stress Apoptosis Insulin resistance Stellate  cells CTGF Inflammation Cytokines
La stéatose est un facteur  de progression de la fibrose Fartoux et al. Hepatology 2005 10-30% 0 0.2 0.4 0.6 0.8 1 0 10 20 30 40 50 60 70 80 90 Mois > 30% < 5% 5-10% Probabilité de progression de fibrose entre 2 biopsies du foie - n=135 hépatites minimes (≤A1F1) - 2 biopsies à 61 mois d’intervalle - progression fibrose = F3/F4   Stéatose
NASH et fibrose % patients F3-F4 Bedossa et al. Hepatology 2007 278 patients, une hépatite C prouvée histologiquement
0 0.1 0.2 0.3 0.4 0.5 0.6 Progression rate of  fibrosis < 20g > 20g < 20g > 20g * Steatosis Steatosis > Alcohol Stéatose + consommation d’alcool  chez le patient VHC Serfaty et al,  Am J Gastroenterol 2002
La sévérité de la fibrose est corrélée au degré d’insulinorésistance  2.2 2.6 3.2 4.5 0.28 0.28 0.26 0.25 ( p =0.9) Moucari R et al.  EASL 2007 6 5 4 3 2 HOMA-IR (moy±DS) p <0.001 F0-F1 F2 F3 F4 Fibrose (Metavir) N = 600 VHC
Perte pondérale et fibrose chez les patients VHC HOMA  4,2  2,5  n=19 patients VHC, BMI 30, stéatose 3-6 mois= -6 kg Hickman IJ et al, Gut 2002 3 2 1 0 Pre Post Grade of Steatosis 6 4 2 0 Pre Post Stage of Fibrosis 5 3 1
Stéatose, insulinorésistance et réponse au traitement
Facteurs métaboliques et réponse au traitement antiviral BMI Stéatose métabolique Insulinorésistance
Surpoids et réponse au traitement Odds ratio Sexe masculin 0,35 Genotype 2/3 11,7 Cirrhose 0,15 Obésité (BMI>30) 0,24 Bressler et al. hepatology 2003
La stéatose est un facteur de résistance au traitement chez les patients génotype non 3  Poynard et al. Hepatology 2003 %RVS - 1428 patients traités pendant 12 mois par IFN/PegIFN   2b + ribavirine - stéatose > 5%: 63% - 22%
L’insulinorésistance est un facteur indépendant de réponse à la bithérapie  Romero-Gomez et al. Gastroenterology 2005 % de réponse prolongée 113 patients infectés par le génotype 1, traités pendant 12 mois par bithérapie
Impact du HOMA sur la RVS: Métaanalyse  Deltenre et al. J Hepatol 2011
Impact du HOMA sur la RVS Métaanalyse HOMA > ou < 2:  différence moyenne de taux de SVR Tous génotype: - 22,2% (IC -35,1% à  -9.4%, p <0,001) Génotype 1: - 11,3% (IC -22,6% à  -3.4%, p =0,05). Deltenre et al. J Hepatol 2011
Serfaty L. Hepato Gastro 2011 Optimisation de la bithérapie pégylée par un traitement insulinosensibilisant ?
Insulino résistance et trithérapie 160 patients G1 naifs traités par trithérapie télaprévir Facteurs métaboliques Glucido-lipidiques HOMA Stéatose Serfaty L et al. Gut 2012 S12 TVR  Q8 + Peg 2a+|RBV Peg 2  +|RBV TVR  Q8 + Peg 2b+|RBV Peg 2  +|RBV TVR  Q12+ Peg 2a+|RBV Peg 2  +|RBV TVR  Q12 + Peg 2b+|RBV Peg 2  +|RBV
Serfaty L et al. Gut 2012 Trithérapie télaprevir Réponse virologique en fonction du HOMA
Trithérapie télaprévir Baisse de la charge virale à S4 en fonction du HOMA Serfaty L et al. Gut 2012
Trithérapie télaprévir Facteurs prédictifs de RVS Serfaty L et al. Gut 2012 Univariable Analysis Multivariable Analysis Odds Ratio 95% CI P-value Odds Ratio 95% CI P-value HTA 0,37 0.12- 1.09 0,07 Charge virale 0,48 0.21-1.05 0,06 Fibrose 0,53 0.33-0.87 0,01 0,47 0.28-0.80 0,005 GGT 0,99 0.98-1.00 0,006 LDL Cholesterol 1,02 1.00-1.03 0,03 1,02 1.00-1.04 0,01
En résumé Stéatose Diabète Type 2 Stress  oxydatif Insulinorésistance VHC Fibrose Résistance  bithérapie Génotype 3 TNF-  SOCS CTGF Génotype 1
Recherche d’une insulinorésistance chez le patient VHC: Éléments du syndrome métabolique: TT, TA, G, TG, HDL HOMA, QUICKI: insulinémie ajeun ± HGPO Stéatose: échographie, scanner, steatotest, NASH test, ± PBH Correction des facteurs de risque métabolique Régime + exercice Equilibre du diabète En pratique
Indication de la bithérapie chez les patients G1 Bithérapie pégylée S4 CV indétectable (30%) CV détectable (70%) Bithérapie pégylée pdt 22/44 semaines en fonction  de la CV initiale Trithérapie Trithérapie d’emblée IL28B CC et F≤2 et HOMA<2 Non Oui Position AFEF
 
Suppresseurs de signalisation des cytokines (SOCS) : un mécanisme de résistance au traitement chez l’insulinorésistant   TNF-  STAT-1 Interferon IFN-R1
Expression de SOCS-3 et réponse au traitement Walsh et al, Gut 2006
L’insulinorésistance et ses facteurs de risque en fonction du status VHC  Shaheen M, Diabetes Research and Clinical Practice 2007 HCV - HCV + p n 10144 239 age 42.0 38.9 0.001 BMI 26.2 25.3 0.001 Sd Met 16.8 % 13.2 % 0.2 HOMA 2.4 3.0 0.001

Serfaty du 2012

  • 1.
    HCV et NASH Lawrence Serfaty Service d’Hépatologie Saint-Antoine UMR-S 893 UPMC
  • 2.
    Plan Définitions: NASH,syndrome métabolique, insulinorésistance Le VHC et stéatose Le VHC et diabète Fibrogénèse et facteurs métabolique Traitement antiviral
  • 3.
    Stéatose non alcoolique(NAFLD) Définition Stéatose hépatique : accumulation intrahépatocytaire de triglycérides Stéato-hépatite Non Alcoolique (NASH) : Stéatose + lésions nécrotico-inflammatoire (10 à 20 % des cas) 1ère cause: obésité Elément du syndrome d’insulino-résistance Marchesini Hepatology 2003
  • 4.
    Le syndrome métabolique Définition IDF 2005 Alberti Lancet 2005 Obésité abdominale  94 cm H, 80 cm F et au moins deux critères: TG  1,7 mmol/l HDL < 1 mmol/l H, 1,3 mmol/l F TA  130/85 ou traitement G à jeun  5,6 mmol/l ou D2T
  • 5.
    La résistance àl’insuline : définition et évaluation Définition : diminution de la réponse à l ’insuline soit réponse biologique normale requérant une quantité d’insuline élevée (normoglycémie au prix d’un hyper- insulinisme). soit réponse biologique insuffisante pour l’insulinémie (intolérance au glucose ou diabète avec des insulinémies élevées). Situation fréquente : syndrome métabolique, obésité andro ïde, diabète de type 2 Elle est détectée par : Hyperinsulinémie en regard de la glycémie (si normoglycémie ou intolérance au glucose) Elle est mesurée rarement par les méthodes de référence: Clamp euglycémique hyperinsulinique « Minimal model de Bergman » HGPIV
  • 6.
    Evaluation Formulessimples mais grossières Formules mathématiques basées sur des prélèvements à jeun Homeostasis Model Assessment of Insulin Resistance HOMA : Ins (µUI/ml) x Gly (mmol/l) / 22.5 résistance à l’insuline si > 3 Quantitative Insulin Check Index QUICKI : 1 / (log [Ins (µUI/ml)] + log [Gly (mg/dl)]) HGPO : Bon compromis Formules mathématiques basées sur les prélèvements de glycémie et d’insulinémie aux différents temps de l’HGPO (0, 30, 60, 90, 120 min) Formule de Belfiore : 2/ [(AUC insulin x AUC glucose)+1] Bien corrélée au clamp
  • 7.
  • 8.
    Prévalence dans lapopulation générale: US Williams CD et al, Gastroenterology 2011 Stéatose: 46% NASH: 12% Cirrhose: 3%
  • 9.
    HCV, stéatose etinsulinoresistance: une relation complexe HCV Stéatose Insulinorésistance Syndrome métabolique
  • 10.
    Prévalence de lastéatose dans l’hépatite C Nombre Nombre de % avec Intervalle d’études patients stéatose 30* 6849 56 (34,8-85,9) 10** 3090 50,9 ND * Personnal review **Meta-analysis, Leandro et al, Gastroenterology 2006
  • 11.
    Prévalence de lastéatose dans l’hépatite C et dans les autres hépatopathies n HCV Témoins* Bach 50 72 % 19 % Lefkowitch 161 69 % 43 % Czaja 60 52 % 22 % Serfaty 100 76% 20% Rozario 127 62% 50% * Chronic hepatitis B or autoimmune liver disease
  • 12.
    Facteurs indépendants associésà la stéatose N=3068 OR 95%IC Genotype 3 4.24 3.38-5.34 Diabète 1.62 1.15-2.3 Alcool 1.41 1.09-1.83 BMI 1.12 1.10-1.15 Age 1.02 1.01-1.03 Leandro et al, Gastroenterology 2006
  • 13.
    La stéatose estcorrélée au degré d ’insulinorésistance chez les patients génotype 1 Fartoux et al Gut 2005
  • 14.
    La stéatose estcorrélée à la charge virale chez les patients génotype 3 Fartoux et al Gut 2005
  • 15.
    Régression de lastéatose après éradication virale chez les patients génotype 3 Kumar et al, Hepatology 2002
  • 16.
    Souris transgénique exprimantla protéine core du VHC Moriya et al. J Gen Virol 1997 1 month-old 3 month-old 6 month-old 9 month-old
  • 17.
    Inhibition de l’activitémicrosomal triglyceride transfer protein (MTP) chez la souris transgénique exprimant la protéine core du VHC TG Apo B Impaired VLDL secretion Intracytoplasmic TG storage Steatosis Assembly MTP  Perlemuter et al. FASEB J 2002. HCV core
  • 18.
    Quantité de triglyceridesdans Huh-7 transfectés par HCV vs non transfectées ABID et al, J Hepatol 2005;42:744-751 ~3 fois
  • 19.
    Deux types destéatose dans l’hépatite C Surpoids Genotype 3 Stéatose Alcool Diabète Serfaty et al, Am J Gastoenterol 2002 Rubbia-Brandt et al, J Hepatol 2000 Adinolfi et al, Hepatology 2001 Monto et al, Hepatology 2002 Poynard et al, Hepatology 2003 Stéatose métabolique Insulinorésistance Stéatose virale (virémie) HCV
  • 20.
    Impact du cannabissur la stéatose ajusté sur le génotype Génotype Non 3 3 p=0.03 (Mantel Haenszel test) 20.0% 28.6% 51.6% 0 15 30 45 60 Non fumeurs et fumeurs occas Fumeurs quotidiens Steatose ≥ 30% (%) 12.3% 25/204 9/45 10/35 16/31 Hezode et al. Gastroenterology 2008 n= 315 patients VHC
  • 21.
    NASH et hépatiteC 278 patients, une hépatite C prouvée histologiquement: HCV seul = 57% HCV + stéatose = 34% HCV + NASH = 9% Bedossa P et al, Hepatology 2007
  • 22.
    Insulin resistance andsteatosis according to genotype Bedossa P et al, Hepatology 2007 VASH (Viral Associated Steato-Hepatitis)
  • 23.
    Types de stéatoseen fonction du génotype Unclassified Viral Metabolic Poynard et al, Hepatology 2001 Viral Metabolic Unclassified Non genotype 3 Genotype 3
  • 24.
    Deux types destéatose dans l’hépatite C Surpoids Genotype 3 Stéatose Alcool Diabète Serfaty et al, Am J Gastoenterol 2002 Rubbia-Brandt et al, J Hepatol 2000 Adinolfi et al, Hepatology 2001 Monto et al, Hepatology 2002 Poynard et al, Hepatology 2003 Stéatose métabolique Insulinorésistance Stéatose virale (virémie) HCV ?
  • 25.
    170 millions HCV + 150 millions Diabète type 2 Hépatite C et diabète
  • 26.
    Prévalence du diabètedans l’hépatite C N Population étudiée VHC Contrôles Allison 100 cirrhoses 50% 9% Grimbert 304 hépatopathies 24% 9% Mason 1117 hépatites virales 21% 12% Caronia 1232 cirrhoses virales 23,6% 9,4%
  • 27.
    Prévalence de l’infectionVHC dans le diabète N Population étudiée Diabètiques Contrôles Mason 594 diabète 377 thyroide 4,2% 1,6% Okan 692 diabète 1014 don sang 7,5% 0,1% Sangiorgio 1514 diabète 7,6% - Simo 176 diabète 6172 don sang 11,5% 2,5%
  • 28.
    Infection VHC etrisque de diabète Méta analyse études rétrospectives (n=14) White DL et al, J Hepatol 2008
  • 29.
    Infection VHC etrisque de diabète/VHB Méta analyse études rétrospectives (n=8)
  • 30.
    Insulinorésistance: HCV versus HBV (Appariés: Age, Sexe, BMI, Inflammation and Fibrose) 5 % 35 % HOMA-IR > 3 (%) P < 0.001 Moucari et al. Gastroenterology (in press) 462 patients HCV non diabètiques: HOMA > 3 chez 32%
  • 31.
    Insulinorésistance chez lessouris transgeniques exprimant la protéine core du virus C Shintani et al. Gastroenterology 2004 Insulin tolerance test Role du TNF- 
  • 32.
    L’éradication du VHCaméliore l’insulinosensibilité HOMA Month Romero-Gomez et al. Gastroenterology 2005 PegIFN+Riba
  • 33.
    2842 HCV patientstreated with IFN±Riba Sustained virological response reduces incidence of onset of type 2 diabetes in chronic hepatitis C Araze Y, Hepatology 2009
  • 34.
    L’insulinorésistance est génotypespécifique Hui et al. Gastroenterology 2004 Moucari et al. Gastroenterology in press Genotype 1 Genotype 3
  • 35.
    Mean Serum HCVRNA (10 6 IU/ml) 0.940 1.350 1.98 HOMA-IR < 2 2 < HOMA-IR < 4 HOMA-IR ≥ 4 Le degré d’insulinorésistance dépend de la charge virale P = 0.007 IR: 22/145 (15 %) – Genotypes 1 or 4: 21/22 (96 %) 145 Patients: BMI < 25 kg/m 2 & Fibrosis (F0-F1) Moucari et al. Gastroenterology in press
  • 36.
    HCV, stéatose etinsulinoresistance: une relation complexe HCV Stéatose Insulinorésistance Génotype 3 Génotype 1 Syndrome métabolique
  • 37.
  • 38.
    Le surpoids estfacteur de risque de fibrose BMI Fibrose Hourigan et al. Hepatology 2001
  • 39.
    Le diabète estun facteur de risque de fibrose Normal glycemia High glycemia Ratziu et al. J Hepatol 2003
  • 40.
    La stéatose métaboliqueest un facteur de risque indépendant de fibrose Hourrigan et al, Hepatology 1999 Adinolfi et al, Hepatology 2001 Fartoux et al, Gut 2005 Monto et al, Hepatology 2002 Rubbia-Brandt et al, Gut 2004 Massard et al, J Hepatol 2006
  • 41.
    Steatosis-fibrosis : a complex relationship Steatosis Fibrogenesis Oxidative stress Apoptosis Insulin resistance Stellate cells CTGF Inflammation Cytokines
  • 42.
    La stéatose estun facteur de progression de la fibrose Fartoux et al. Hepatology 2005 10-30% 0 0.2 0.4 0.6 0.8 1 0 10 20 30 40 50 60 70 80 90 Mois > 30% < 5% 5-10% Probabilité de progression de fibrose entre 2 biopsies du foie - n=135 hépatites minimes (≤A1F1) - 2 biopsies à 61 mois d’intervalle - progression fibrose = F3/F4 Stéatose
  • 43.
    NASH et fibrose% patients F3-F4 Bedossa et al. Hepatology 2007 278 patients, une hépatite C prouvée histologiquement
  • 44.
    0 0.1 0.20.3 0.4 0.5 0.6 Progression rate of fibrosis < 20g > 20g < 20g > 20g * Steatosis Steatosis > Alcohol Stéatose + consommation d’alcool chez le patient VHC Serfaty et al, Am J Gastroenterol 2002
  • 45.
    La sévérité dela fibrose est corrélée au degré d’insulinorésistance 2.2 2.6 3.2 4.5 0.28 0.28 0.26 0.25 ( p =0.9) Moucari R et al. EASL 2007 6 5 4 3 2 HOMA-IR (moy±DS) p <0.001 F0-F1 F2 F3 F4 Fibrose (Metavir) N = 600 VHC
  • 46.
    Perte pondérale etfibrose chez les patients VHC HOMA 4,2 2,5 n=19 patients VHC, BMI 30, stéatose 3-6 mois= -6 kg Hickman IJ et al, Gut 2002 3 2 1 0 Pre Post Grade of Steatosis 6 4 2 0 Pre Post Stage of Fibrosis 5 3 1
  • 47.
    Stéatose, insulinorésistance etréponse au traitement
  • 48.
    Facteurs métaboliques etréponse au traitement antiviral BMI Stéatose métabolique Insulinorésistance
  • 49.
    Surpoids et réponseau traitement Odds ratio Sexe masculin 0,35 Genotype 2/3 11,7 Cirrhose 0,15 Obésité (BMI>30) 0,24 Bressler et al. hepatology 2003
  • 50.
    La stéatose estun facteur de résistance au traitement chez les patients génotype non 3 Poynard et al. Hepatology 2003 %RVS - 1428 patients traités pendant 12 mois par IFN/PegIFN  2b + ribavirine - stéatose > 5%: 63% - 22%
  • 51.
    L’insulinorésistance est unfacteur indépendant de réponse à la bithérapie Romero-Gomez et al. Gastroenterology 2005 % de réponse prolongée 113 patients infectés par le génotype 1, traités pendant 12 mois par bithérapie
  • 52.
    Impact du HOMAsur la RVS: Métaanalyse Deltenre et al. J Hepatol 2011
  • 53.
    Impact du HOMAsur la RVS Métaanalyse HOMA > ou < 2: différence moyenne de taux de SVR Tous génotype: - 22,2% (IC -35,1% à -9.4%, p <0,001) Génotype 1: - 11,3% (IC -22,6% à -3.4%, p =0,05). Deltenre et al. J Hepatol 2011
  • 54.
    Serfaty L. HepatoGastro 2011 Optimisation de la bithérapie pégylée par un traitement insulinosensibilisant ?
  • 55.
    Insulino résistance ettrithérapie 160 patients G1 naifs traités par trithérapie télaprévir Facteurs métaboliques Glucido-lipidiques HOMA Stéatose Serfaty L et al. Gut 2012 S12 TVR Q8 + Peg 2a+|RBV Peg 2  +|RBV TVR Q8 + Peg 2b+|RBV Peg 2  +|RBV TVR Q12+ Peg 2a+|RBV Peg 2  +|RBV TVR Q12 + Peg 2b+|RBV Peg 2  +|RBV
  • 56.
    Serfaty L etal. Gut 2012 Trithérapie télaprevir Réponse virologique en fonction du HOMA
  • 57.
    Trithérapie télaprévir Baissede la charge virale à S4 en fonction du HOMA Serfaty L et al. Gut 2012
  • 58.
    Trithérapie télaprévir Facteursprédictifs de RVS Serfaty L et al. Gut 2012 Univariable Analysis Multivariable Analysis Odds Ratio 95% CI P-value Odds Ratio 95% CI P-value HTA 0,37 0.12- 1.09 0,07 Charge virale 0,48 0.21-1.05 0,06 Fibrose 0,53 0.33-0.87 0,01 0,47 0.28-0.80 0,005 GGT 0,99 0.98-1.00 0,006 LDL Cholesterol 1,02 1.00-1.03 0,03 1,02 1.00-1.04 0,01
  • 59.
    En résumé StéatoseDiabète Type 2 Stress oxydatif Insulinorésistance VHC Fibrose Résistance bithérapie Génotype 3 TNF-  SOCS CTGF Génotype 1
  • 60.
    Recherche d’une insulinorésistancechez le patient VHC: Éléments du syndrome métabolique: TT, TA, G, TG, HDL HOMA, QUICKI: insulinémie ajeun ± HGPO Stéatose: échographie, scanner, steatotest, NASH test, ± PBH Correction des facteurs de risque métabolique Régime + exercice Equilibre du diabète En pratique
  • 61.
    Indication de labithérapie chez les patients G1 Bithérapie pégylée S4 CV indétectable (30%) CV détectable (70%) Bithérapie pégylée pdt 22/44 semaines en fonction de la CV initiale Trithérapie Trithérapie d’emblée IL28B CC et F≤2 et HOMA<2 Non Oui Position AFEF
  • 62.
  • 63.
    Suppresseurs de signalisationdes cytokines (SOCS) : un mécanisme de résistance au traitement chez l’insulinorésistant TNF-  STAT-1 Interferon IFN-R1
  • 64.
    Expression de SOCS-3et réponse au traitement Walsh et al, Gut 2006
  • 65.
    L’insulinorésistance et sesfacteurs de risque en fonction du status VHC Shaheen M, Diabetes Research and Clinical Practice 2007 HCV - HCV + p n 10144 239 age 42.0 38.9 0.001 BMI 26.2 25.3 0.001 Sd Met 16.8 % 13.2 % 0.2 HOMA 2.4 3.0 0.001

Notes de l'éditeur

  • #16 In a recent study, Kumar et al have studied the impact of antiviral therapy on steatosis according to genotypes and response to treatment. As you can see on these figures, patients infected with genotype 3, it means viral steatosis, had significant improvement of steatosis in case of virological response, wherea patients infected with genotype 1, it means metabolic steatosis, had no such improvement whatever the response.
  • #18 In favour of the interaction between HCV and apo B, Perlemuter et al have shown in transgenic mice expressing HCV core protein that microsomal triglyceride transfer protein was inhibited, leading to impaired VLDL secretion and steatosis.
  • #21 Since a strong link was found between HCV genotype 3 and cannabis smoking, the relationship between steatosis and cannabis intake was studied following adjustment on genotype. In patients with genotype 3 like in those with genotype non-3, the proportion of patients with severe steatosis was significantly greater in daily cannabis smokers than in non smokers and occasional smokers.
  • #41 A number of cross sectional studies have shown that steatosis was associated with more severe fibrosis in chronic hepatitis C, independently from other risk factors.
  • #51 This figure shows you rates of sustained virologic response according to genotypes and steatosis in our 3 studies. In the two studies with genotype 1 patients, steatosis was associated with significantly lower rate of response. In the 2 studies with genotype 2 patients, steatosis was also predictive of lower rate of response. As expected, in patients infected with genotype 3, steatosis was not predictive of the response rate. In all studies, steatosis was an independent risk factor of bad response in genotype 1 and genotype 2 patients.
  • #52 This figure shows you rates of sustained virologic response according to genotypes and steatosis in our 3 studies. In the two studies with genotype 1 patients, steatosis was associated with significantly lower rate of response. In the 2 studies with genotype 2 patients, steatosis was also predictive of lower rate of response. As expected, in patients infected with genotype 3, steatosis was not predictive of the response rate. In all studies, steatosis was an independent risk factor of bad response in genotype 1 and genotype 2 patients.
  • #60 The pathogenic link between steatosis and fibrosis could be oxidative stress. According to the two hits hypothesis, steatosis could increase the sensitivity of hepatocytes to oxidative stress, the second hit being HCV itself or environemental factors such as alcohol, dru…and therefore could favor fibrogenesis through lipid peroxidation.